Chapter 6: Demand, Supply, Market Equilibrium, and Welfare Analysis
Demand
- Simple concept- people purchase less when prices are high and vice versa
Law of Demand
- Ceteris paribus means holding everything else constant
- There is an inverse relationship between quantity demanded and prices
| ]]Price per cup($)]] | ]]Quantity Demanded]] |
|---|---|
| .25 | 120 |
| .50 | 100 |
| .75 | 80 |
| 1.00 | 60 |
| 1.25 | 40 |
- For simplification of the demand model, we assume all other things as constant
Reasons for the Law of Demand (why people buy less when price increases)
- Income effect: when prices are low, people are easily able to afford it since their budget would allow it
Imagine having a budget of $10, and you are able to buy a limited quantity of apples
Now if your income increases, your budget increases by more than 10, which allows you to buy more of the apples
- Substitution effect: when products price increase, they tend to increase in relative to other products
2 products exist in the market A and B, where B is a substitute product for A
If product A were to become expensive, product B would most likely be cheaper than A
Due to the existence of substitutes, customers immediately leave product A for B
- Diminishing marginal utility: As more units of a product are consumed, the satisfaction/utility it provides tends to decline
- Apple users would purchase at maximum, a limited phones-they wouldn’t purchase a new iPhone every month since that extra phone would offer them no utility or not as much
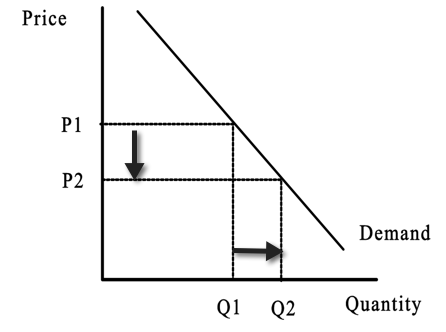
Quantity Demanded vs. Change in Demand
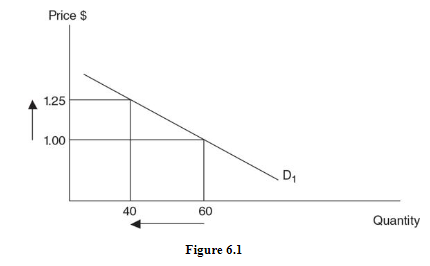
- Change is the quantity demanded only occurs due to change in price of a product
- If product X would become expensive (1.00 to 1.25), the quantity demanded would fall (60 to 40)
- Change in demand occurs when the entire demand curve shifts upwards or downwards due to specific factors
- Change in demand occurs irrespective of price changes of the product
Determinants of Demand
- Consumer income
- Price of substitutes
- The price of a complementary good
- Consumer tastes and preferences
- Consumer expectations about future prices
- Number of buyers in the market
1. Consumer income
- Goods are usually categorized into 2 types, inferior and normal
- Demand tends to decline (shift downwards) for inferior goods with an increase in consumer income
- Demand for normal goods increases (shifts upwards) with an increase in consumer income
- A good example of this would be how college students purchase used furniture (higher demand) at the beginning of their semesters
- The same students however go for the purchase of new furniture once they graduate/ or are employed
2. Price of substitute goods
- Substitutes goods are products that a consumer can use as alternates to satisfy the same essential function, yielding the same degree of happiness (utility)
- 2 goods would be considered substitutes if an increase in the price of one good causes an increase in demand for the other good
- Assuming 2 institutes only exist in the market: Mammoth State University (MSU) and Ivy Vine College (IVC)
- In an effort to generate more revenue, IVC raises fee per student which in turn leads to counter effects (see below)
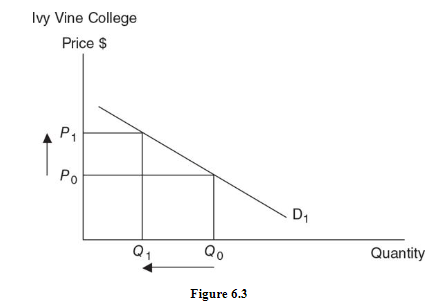
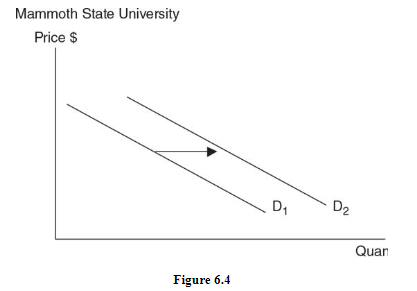
- Automatically, IVC faces a decline in demand while MSU faces increase in demand
3. Price of Complementary Goods
- Complementary goods are those which are purchased separately but used together
- The consumer receives more utility from consuming them together than consuming each separately
- The relation here is inverse of that of substitute goods
- If 2 products are complements, an increase in the price of one good causes demand for the other good to decline as well
- A good example would be of tortilla chips and the nacho sauce
- Both products are purchased together, and not individually
4. Tastes and Preferences
- This is the consumer’s taste for a product at any point
- If consumers like a product, the demand curve for that product shifts upwards and vice versa if they dislike it
- A good example is when the trend of vegetarianism hit the public, the consumption of plant-based food drastically increased
5. Future Expectations
- Consumer expectation plays a major role in the determination of the price
- if consumers expect that the price of something would increase in the future, they would buy the product at a larger scale leading to the demand curve shifting upwards
- A good example would be when consumers assume that gasoline prices may raise tomorrow by a certain percentage
- This would result in them filling up more gasoline in the day prior to overcome future trouble
- Demand can also be influenced by future expectations of income changes
6. Number of Buyers
- Increase in the number of buyers leads to an increase in demand (keeping everything else constant)
- This is usually due to demographic changes or increasing availability in more markets
- A good example would be after the abolishment of communism in USSR, many US based companies entered into Russia with their products, hence a new market with new consumer base
Supply
- The market supply shows the quantity a supplier is willing and able to offer at various prices at a given time
Law of Supply
- Law of supply states that when prices increase, the supply increases (while holding everything else constant)
- This proves a direct relationship between price and supply
Behind the scenes of the law of supply
Increasing Marginal Costs
- As suppliers increase the number of units supplied, they face increasing marginal cost
- In conclusion, they would only supply up to the quantity which allows them to at least cover their high marginal cost
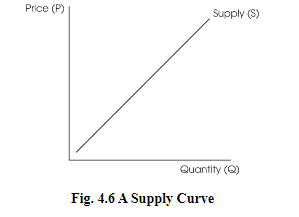
The Supply Curve
- The table above is sometime referred to as supply schedule
| ]]Price per cup ($)]] | ]]Quantity supplied]] |
|---|---|
| .25 | 40 |
| .50 | 60 |
| .75 | 80 |
| 1.00 | 100 |
| 1.25 | 120 |
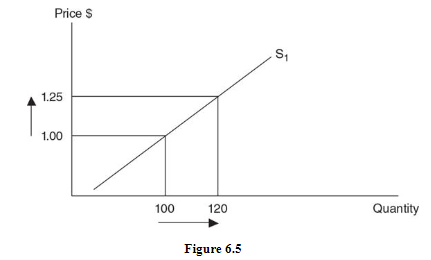
Quantity Supplied Versus Supply
- Change is the quantity supplied only occurs due to a change in the price of a product, holding all other factors constant
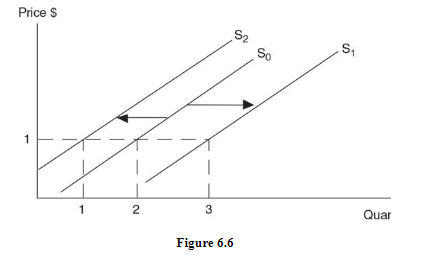
- Change in supply occurs when the entire supply curve shifts upwards or downwards due to specific factors
- Increase in supply is viewed as a rightward shift in the supply curve and vice versa
- Change in supply occurs irrespective of price changes of the product
Determinants of Supply
- The cost of an input to be used in the production
- Technology and productivity used to produce
- Taxes or subsidies
- Producer expectations about future prices
- The price of other goods that could be produced
- The number of producers in the industry
1. Cost of Inputs
- The cost of production (land, labor, capital) has an inverse impact on the supply
- When the cost of these increases, the supplier decides to produce less of the products since he is unable to afford the production cost
2. Technology or Productivity
- Newer technology causes the cost of production (reduces the marginal cost) to decline and helps improve the efficiency of the supplier
- This allows the supplier to produce more, shifting the supply curve outwards(towards the right)
- Flow production techniques, where similar products are produced in one go are preferred by suppliers as the marginal cost is reduced and supply can be increased
3. Taxes and Subsidies
- Taxes are added up to the unit cost of production, thus making it more expensive
- Due to this, heavily taxed products are produced in less quantity by suppliers(supply curve shifts towards the left)
- Subsidies are the opposite of taxes and help reduce price per unit
- This allows suppliers to produce more of the product(supply curve shifts towards right)
4. Price Expectations
- Producers’ willingness to supply depends greatly on future prices as well
- If a juice producer assumes that heat waves tomorrow would reduce the number of people coming out of their houses, he would hold back some of his supply
- If the same producer is aware that a marathon would be taking place on a particular date, he would supply more on that particular day at an inflated price
5. Price of Other Outputs
- Suppliers can use the same resources for production of 2 goods
- If the demand for let’s say milkshake rises, the supplier would reduce his supply of ice cream and shift towards selling more of milkshake
6. Number of Suppliers
- As the number of sellers increases in the market, the supply automatically increases
- This allows consumers more choices at a lower price due to an increase in competition
Market Equilibrium
- Consumers prefer lower prices whereas suppliers prefer higher prices
- Market is in a state of equilibrium when the quantity supplied equals the quantity demanded at a given price
- It is where the price expected by consumers is equal to the price required by suppliers
| Price per cup ($) | Quantity demanded | Quantity supplied | Qd-Qs | Situation | Price should |
|---|---|---|---|---|---|
| .25 | 120 | 40 | 80 | Shortage | rise |
| .50 | 100 | 60 | 40 | shortage | rise |
| {{.75{{ | {{80{{ | {{80{{ | 0 | equilibrim | Same |
| 1.00 | 60 | 100 | -40 | surplus | fall |
| 1.25 | 40 | 120 | -80 | surplus | fall |
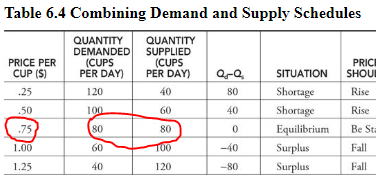
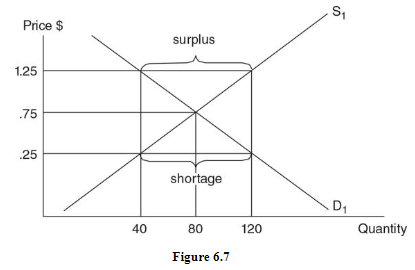
Shortage
- A shortage exists at a market price when the quantity demanded exceeds the quantity supplied
- At prices of 25 cents and 50 cents per cup, you can see the shortage in the figure above
- Suppliers don’t prefer lower prices and therefore decrease their quantity supplied.
- At prices below 75 cents per cup, lemonade buyers and sellers are in a state of disequilibrium
- With a shortage in the market, consumers become willing to pay slightly more which in turn allows suppliers to produce more
- Hence the shortage is eliminated at a price of 75 cents per cup
Surplus
- A surplus exists at a market price when the quantity supplied exceeds the quantity demanded
- At prices of $1 and $1.25 per cup, you can see the surplus in the figure above
- Consumers don’t wish to purchase more lemonade but suppliers are willing to supply more
- Hence the market is in disequilibrium state
- To overcome this, suppliers begin offering discounted prices which helps them overcome the problem
- Hence the surplus would be eliminated at a price of 75 cents per cup
- {{Note: Shortages and surpluses are relatively short-lived in a free market as prices rise or fall until the quantity demanded again equals the quantity supplied{{
Changes in Demand
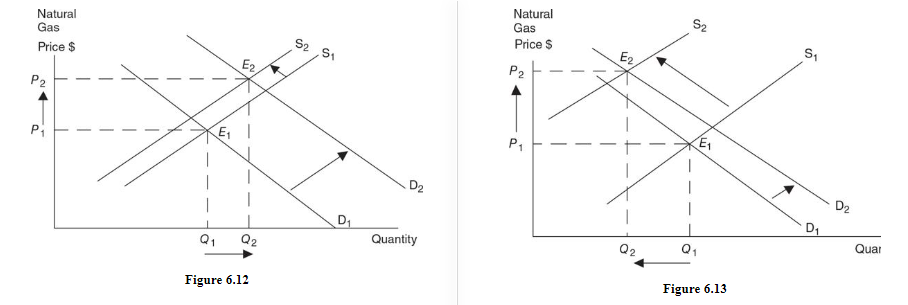
Increase in Demand
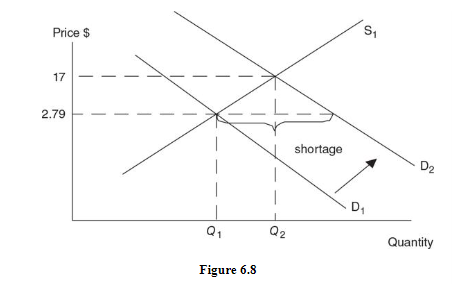
- As demand increases from D1 to D2 but supply stays constant, a shortage is created in the market
- Take an example the government suddenly announces that gasoline prices would drop greatly
- This would result in huge influx of demand, giving limited time for suppliers to cope with
- This creates shortage in the market with high gasoline demand but not enough supplied
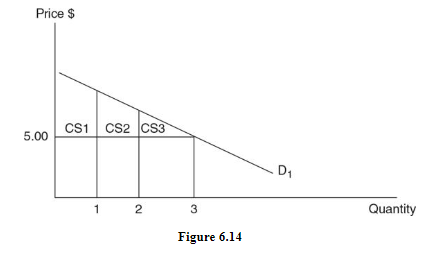
Decrease in Demand
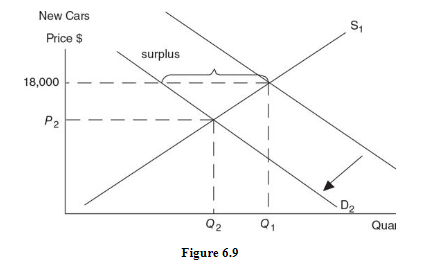
- As demand decreases from D1 to D2 but supply stays constant, a surplus is created in the market
- Take an example that fruit prices hike up greatly in an economy
- This would drop the quantity demanded for the fruits greatly, rendering most of the fruit stored to be useless
- This creates excess in the market with great quantity of fruits supplied but not enough demand
- When demand increases, equilibrium price and quantity both increase
- When demand decreases, equilibrium price and quantity both decrease
Changes in Supply
Increase in Supply
- Advancements in computer technology and production methods increases supply greatly
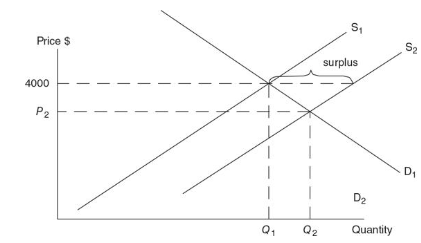
- At equilibrium price of $4,000, there is now a surplus
- To eliminate the surplus, the market price must fall to P2 and the equilibrium quantity must rise to Q2
Decrease in Supply
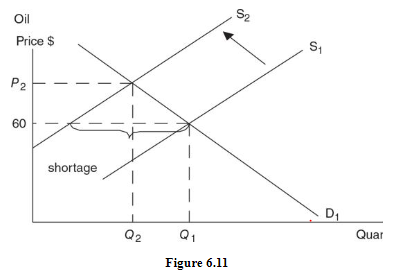
- Assume a decrease in the global supply of oil
- At equilibrium price of $60 per barrel, there is now a shortage of crude oil
- The market eliminates this shortage through higher prices temporarily and the equilibrium quantity of crude oil falls
- When supply increases, equilibrium price decreases and quantity increases
- When supply decreases, equilibrium price increases and quantity decreases
Simultaneous changes in Demand and Supply
- When both demand and supply are changing, one of the equilibrium outcomes (price or quantity) is predictable and one is unpredictable

- Before combining the two shifting curves, predict changes in price and quantity for each shift, by itself
- The variable that is rising in one case and falling in the other case is your ambiguous prediction
Welfare Analysis
- Total Welfare
- Total welfare= consumer surplus + producer surplus
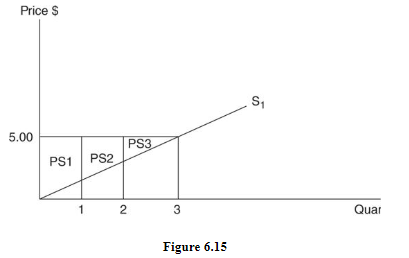
- Consumer Surplus
- consumer surplus, the difference between the price consumers are willing to pay and the price you actually pay for a product
- At a price of $5, three units of the good are purchased.
- First 2 units receive consumer surplus as the price being willingly paid for exceeds $5.
- The third unit pays a price exactly equal to his willingness to pay so he earns no consumer surplus.
- Total consumer surplus is the total amount earned by these three consumer together
Producer Surplus
- It is the difference between the price received and the marginal cost of producing the good
- The first two units earn producer surplus because $5 is above the marginal cost
- The third unit earns no additional producer surplus, since the marginal cost is exactly equal to the price received by supplier
- Total producer surplus is the total amount earned by these three producers.
- The area under the demand curve and above the market price is equal to total consumer surplus
- The area above the supply curve and below the market price is equal to total producer surplus
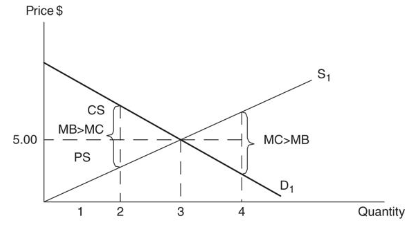
- Welfare would be maximized at equilibrium level
- Use area of triangle (1/2 x base x height) to calculate producer and consumer surplus
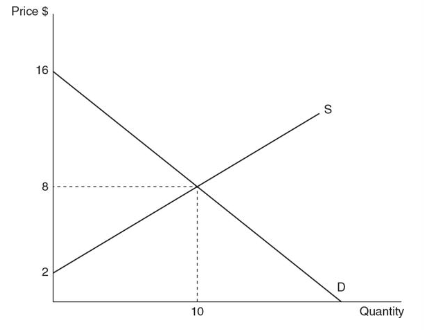
- Consumer surplus: ½ x 10 units wide x 8 units long = $40 surplus
- Producer surplus: ½ x 10 units wide x 6 units long = $30 surplus