Finance notes chap 1-6
Finance notes
Chap 1 : Corporation + financial markets
Before the gov could take the ownerships of corporations, something they can’t do now . In 1819, the U.S. Supreme Court ruled that corporations have the same property rights as individuals, protecting them from government seizure. This decision helped make modern business corporations. Nowadays, corporations are everywhere, but they face new challenges, like the 2008 financial crisis. This made the government change rules and ask questions about controlling companies.
Understanding corporate finance remains crucial amid changing political agendas and global tensions. The book focuses on how corporate financial decisions are made and introduces different organizational forms and the role of stock markets in trading ownership shares.
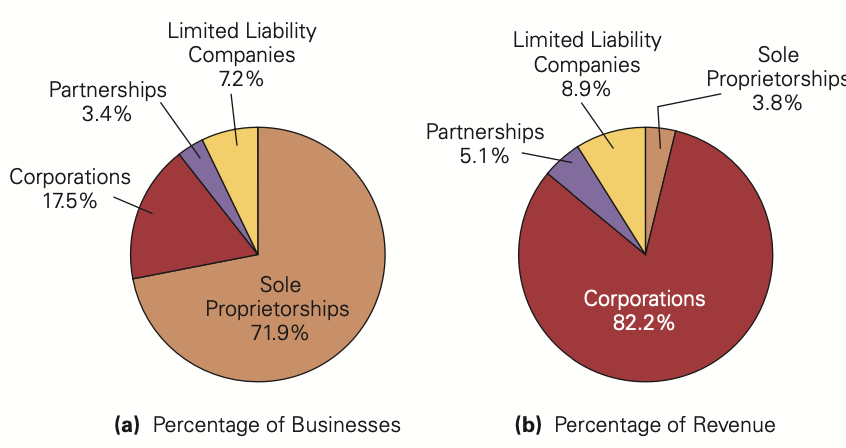
- 4 types of firms
sole proprietorships, partnerships, limited liability companies, and corporations
Sole proprietorships
a business owned and run by one person. Sole proprietorships are usually very small with few, if any, employees. They are the most common type of firm in the world, nearly 72% of businesses in the US are part of them.
Sole proprietorships share the following key characteristics:
- They're easy to start because it's just one person running the show, which is why many new businesses choose this setup.
- The downside is that there's no legal separation between the owner and the business. So, only one person can own it, and others can't invest in it.
- The owner is personally responsible for all the business debts. If the business can't pay its debts, the owner has to use personal assets to cover them. If they can't, they might have to declare bankruptcy.
- A sole proprietorship lasts only as long as the owner wants it to. It's also hard to sell or transfer ownership.
Once a business gets big enough to borrow money without the owner risking everything, they often switch to a different type of business structure to limit their liability.
Partnership
It’s like sole proprietorships but it has multiple owners.
- All partners are responsible for the business's debts. This means that any partner can be asked to pay off all the business's debts if needed.
- If one partner leaves or dies, the partnership ends, unless the partnership agreement says otherwise. There might be options like buying out the leaving partner to avoid closing down.
Some businesses, like law firms or doctor groups, stick with partnerships because the owners' reputations are a big part of the business. Having personal liability makes clients trust that the owners will work hard to keep their good reputation.
In a limited partnership, there are two types of owners: general partners and limited partners. General partners have the same rights and responsibilities as partners in a regular partnership—they're personally responsible for the business's debts. But limited partners have less risk—their liability is only up to the amount they've invested. They can't lose personal stuff to pay off the business's debts. Also, if a limited partner leaves or dies, it doesn't end the partnership, and their share can be sold to someone else. However, limited partners can't make decisions for the business.
Industries like private equity funds and venture capital funds often use limited partnerships. In these, a few general partners put in their own money and get more money from outside investors who become limited partners. The general partners decide how to invest all the money, and the outside investors just watch how their investments are doing without getting involved in the business decisions.
Limited liabilty compaines
A Limited Liability Company (LLC) is similar to a limited partnership, but without a general partner. This means that all owners have limited liability, and they can also be involved in running the business.
LLCs are a newer concept in the United States, starting in Wyoming in 1977 and last established in Hawaii in 1997. However, internationally, companies with limited liability have been around for much longer. In Germany, they've been known as Gesellschaft mit beschränkter Haftung (GmbH) for over 100 years, and similar structures exist in other European and Latin American countries, such as Société à responsabilité limitée (SARL) in France, SRL in Italy, and SL in Spain.
Corporartions
A corporation is a separate legal entity from its owners, meaning it has its own legal powers and responsibilities. It can enter contracts, acquire assets, and is protected under the U.S. Constitution. The key point is that the corporation is solely responsible for its obligations, not its owners, and vice versa.
To form a corporation, it needs approval from the state where it incorporates. This process is more expensive than starting a sole proprietorship. Many choose to incorporate in Delaware due to its favorable legal environment. Lawyers often help create a charter and bylaws to govern the corporation.
Ownership in a corporation is through shares of stock, and there's no limit to the number of owners. Each owner, or shareholder, owns a fraction of the company. They receive dividends, which are payments from the corporation to its shareholders, usually based on the amount of stock they own.
One unique aspect of a corporation is that anyone can own its stock, regardless of expertise. This allows for easy trading of shares and attracts outside investors. This ability to raise capital from investors has made corporations dominant in the economy.
For example, Walmart, one of the largest corporations globally, had over 2 million employees and $560 billion in revenue in 2021. The top six U.S. companies by sales volume in 2021 generated over $2 trillion in sales, surpassing the total sales of more than 25 million U.S. sole proprietorships.
Tax implications for corporate enetiites
The different types of firms are taxed differently. As a corporation is a separate legal entity, a corporation’s profits are taxed separately from its owners’ tax obligations. In effect, shareholders of a corporation pay taxes twice. Concept known as double taxation. This means that the corporation pays taxes on its profits, and then shareholders also pay taxes on the dividends they receive from those profits.
Double Taxation Example:
- Corporate Taxation:
- Imagine a corporation earns $8 per share before taxes.
- The corporation must pay corporate taxes on its profits. Let's say the corporate tax rate is 25%.
- So, 25% of $8 is $2. This means the corporation pays $2 in taxes per share.
- Dividend Distribution:
- After paying corporate taxes, the corporation distributes the remaining profits to its shareholders as dividends.
- In our example, if $2 is paid in taxes, then the remaining $6 is distributed as dividends to shareholders.
- Shareholder Taxation:
- Shareholders receive the dividends, but they are also taxed on this income. Let's say the tax rate on dividend income for shareholders is 20%.
- So, shareholders must pay 20% of $6, which is $1.20, in taxes on the dividends they receive.
- Overall Tax Impact:
- After all taxes are paid, shareholders end up with $6 (dividends) - $1.20 (taxes on dividends) = $4.80 per share.
- This means out of the original $8 earned per share, shareholders end up with only $4.80 after taxes. The remaining $3.20 ($2 in corporate taxes + $1.20 in taxes on dividends) is paid in taxes overall.
- This results in an effective tax rate of $3.20 / $8 = 40%
To fix this issue of double taxation, some corporations opt to become S Corporations. They allow profits to be directly allocated to shareholders without being taxed at the corporate level. This means the profits "pass through" to shareholders, who report their share of the income on their personal tax returns and pay taxes accordingly. While shareholders still pay taxes on these profits, they don't face double taxation as seen in traditional corporations. This can be advantageous for smaller businesses or startups where double taxation could significantly impact profits.
- Challenges with S Corporation Status: While S Corporation status offers tax advantages, it comes with certain restrictions. For instance, S Corporations cannot have more than 100 shareholders, and all shareholders must be U.S. citizens or residents. Additionally, S Corporations cannot have certain types of shareholders, such as other corporations or partnerships.
Most countries, including the U.S., offer some relief from double taxation for investors in corporations. For example, the U.S. has reduced the tax rate on dividend income compared to other sources of income, making it more favorable for investors.
1.2. ownership vs control of corporations
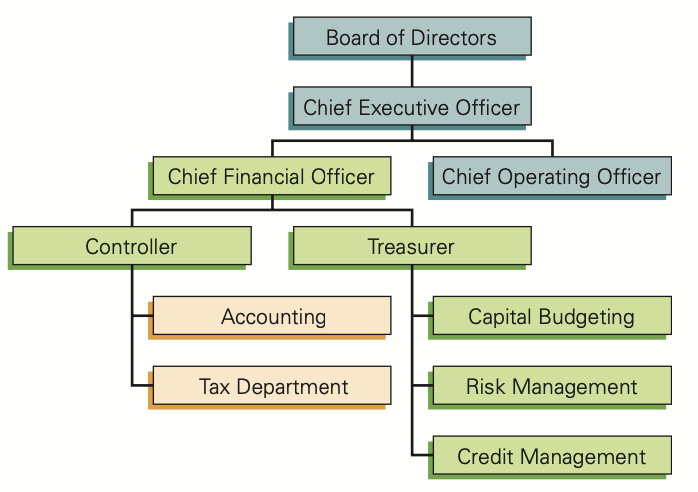
In a corporation, it's common for ownership and direct control to be separate. This is because there are often many owners, each of whom can freely trade their stock. Instead of the owners, direct control of the corporation typically lies with the board of directors and the chief executive officer (CEO).
In a corporation, the management team plays a crucial role in decision-making and overseeing the company's operations. Here's how the corporate management team is typically structured:
Corporate management team
Board of Directors:
- The board of directors is elected by the shareholders and holds the ultimate decision-making authority in the corporation.
- Shareholders typically have one vote per share in electing the board members, and those with more shares have more influence.
- The board sets rules on corporate governance, including the compensation of top managers, and monitors the company's performance.
- When a few shareholders own a significant portion of the stock, they may have the right to appoint directors or even serve on the board themselves.
Chief Executive Officer (CEO):
- The CEO is responsible for running the corporation and executing the policies set by the board of directors.
- They oversee the day-to-day operations of the company and work to achieve its strategic objectives.
- The CEO is often the highest-ranking executive in the company and reports directly to the board of directors.
Management Team:
- The CEO may delegate operational responsibilities to other members of the management team, depending on the size and structure of the corporation.
- The size and composition of the management team can vary from one corporation to another.
- The chief financial officer (CFO) is typically a key member of the management team and is responsible for managing the company's finances and financial risks. They often report directly to the CEO.
Organizational Structure:
- The organizational chart of a corporation typically outlines the hierarchy of positions within the company, including key roles such as CEO, CFO, and other senior executives.
- The separation of powers between the board of directors and the CEO may not always be distinct, and it's not uncommon for the CEO to also serve as the chairman of the board.
In summary, the corporate management team, consisting of the board of directors, CEO, and other senior executives, collaborates to set policies, oversee operations, and drive the company towards its goals.
The financial manager
The financial manager within a corporation plays a crucial role in three main areas:
1. Investment Decisions:
- The financial manager evaluates and makes decisions about where to invest the firm's money.
- They assess the costs and benefits of various investment opportunities to determine which ones will generate value for the shareholders.
- These decisions shape the company's activities and its ability to achieve its goals.
2.Financing Decisions:
- After deciding on investments, the financial manager determines how to finance them.
- They choose between raising additional funds from shareholders (equity) or borrowing money (debt) to finance large investments.
- The financial manager considers the characteristics of each source of funds and their impact on the company's overall financial structure.
3. Cash Management:
- The financial manager ensures the company has enough cash on hand to meet its daily operational needs.
- They manage working capital, which involves balancing short-term assets and liabilities.
- Effective cash management is crucial, especially for young or growing companies, as it can significantly impact their success.
Finance in Times of Disruption:
- In response to the 2008 financial crisis, the U.S. government enacted the Dodd-Frank Wall Street Reform and Consumer Protection Act to reform financial regulation.
- The Act aims to promote financial stability, end "too big to fail" practices, protect taxpayers from bailouts, and safeguard consumers from abusive financial practices.
Cash Management Importance:
- The financial manager ensures the company has sufficient cash to fund its operations and investments.
- Cash management is critical for companies, even those with successful products, as significant cash is often required for product development and market launch.
- Examples include Apple's secretive development of the iPhone, Boeing's production of the 787, and Audi's investment in self-driving technology.
Overall, the financial manager's responsibilities are essential for the company's financial health, strategic decision-making, and long-term success. They play a crucial role in managing investments, financing, and cash to ensure the company's growth and profitability.
Goal of the firm : The goal of a firm should ideally be aligned with the interests of its owners, but determining this can be hard, especially in corporations with multiple shareholders. Each shareholder may have different priorities and interests. However, in many cases, shareholders' interests converge when it comes to decisions that increase the value of their shares. Despite their diverse backgrounds and preferences, shareholders generally benefit when management decisions enhance the value of their investments.
Firm & society
Decisions that increase the value of a firm's equity can often be beneficial for society by creating valuable products and services for customers and generating job opportunities. However, problems arise when these decisions harm others or the broader society.
Ex : a corporation that pollutes the environment w/o bearing the costs of cleanup imposes negative externalities on society.
To address such issues, appropriate public policies and regulations are necessary to ensure that corporate interests align with societal interests. Effective regulations can prevent corporations from imposing harm on others and promote actions that benefit society overall while still allowing firms to pursue shareholder value maximization in a responsible manner.
Top of Form
Ethics & incentives within corporations
The separation of ownership and control in corporations can lead to conflicts of interest between managers and shareholders, known as agency problems. Managers may prioritize their own self-interest over the interests of shareholders. To address these issues, several mechanisms are put in place:
- Compensation Contracts: Managers' compensation contracts are designed to align their interests with those of shareholders. Compensation often includes bonuses tied to the firm's performance or stock options, incentivizing managers to make decisions that increase shareholder wealth.
- Board Oversight: Boards of directors are responsible for monitoring managerial actions and ensuring they act in the best interests of shareholders. Independent compensation committees and advisory boards help prevent excessive compensation and maintain accountability.
- Market for Corporate Control: A poorly performing company may become a target for a hostile takeover by corporate raiders. Shareholders dissatisfied with management can sell their shares, leading to a decline in stock price and making the company vulnerable to acquisition by an entity aiming to replace the board and management.
- Shareholder Activism: Shareholders have the power to influence managerial decisions through voting and shareholder proposals. Dissatisfied shareholders may pressure the board to replace underperforming executives.
Additionally, managers are increasingly expected to consider the interests of stakeholders beyond shareholders, such as employees, customers, and communities, in their decision-making. This approach, known as stakeholder capitalism, acknowledges that decisions impacting stakeholders can ultimately affect shareholder value.
When a corporation faces financial distress and is unable to repay its debts, control of the firm may pass to debt holders through bankruptcy proceedings. However, bankruptcy does not always result in liquidation; creditors may choose to restructure the firm and continue operations if it remains profitable, ensuring ongoing value creation for stakeholders
1.3. stock market Bottom of Form
The stock market plays a crucial role in providing liquidity to investors and establishing a market price for a company's shares. Here's how it functions:
- Liquidity: The stock market allows investors to buy and sell shares quickly and easily. Liquidity is essential because it provides investors with the flexibility to enter and exit their investments as needed. For example, if an investor needs to sell their shares to raise cash, they can typically do so on the stock market without much difficulty.
- Market Price Determination: The stock market determines the price of a company's shares through the forces of supply and demand. When more investors want to buy a stock, its price increases, and when more investors want to sell, its price decreases. This constant fluctuation in prices reflects investors' perceptions of a company's value and prospects.
- Feedback Mechanism: Share prices in the stock market provide continuous feedback to managers about investors' views of their decisions. If a company announces positive news or achieves strong financial results, its stock price may rise, signaling investor confidence in management's actions. Conversely, negative news or poor performance may lead to a decline in the stock price, indicating investor concerns.
- Research and Trading: Participants in the stock market, such as investors, analysts, and traders, conduct research and analysis to evaluate companies and make investment decisions. This research contributes to price discovery and helps investors make informed choices about buying or selling stocks.
Overall, the stock market serves as a platform for investors to trade securities, determine market prices, and provide feedback to companies and their management teams. This dynamic environment allows for efficient capital allocation and contributes to the functioning of the economy.
Primary Market: When a corporation itself issues new shares of stock and sells them to investors, it does so on the primary market.
In the primary market, newly issued securities, such as stocks or bonds, are sold for the first time directly by the issuing company to investors. Companies use the primary market to raise capital by issuing new shares of stock or bonds. Investors purchase these newly issued securities directly from the issuing company through methods like initial public offerings (IPOs) or seasoned equity offerings (SEOs). The primary market facilitates the direct transfer of funds from investors to the issuing company. Once the securities are sold in the primary market, they are subsequently traded in the secondary market.
Secondary Market: After this initial transaction between the corporation and investors, the shares continue to trade in a secondary market between investors without the involvement of the corporation
The secondary market is where already issued securities are traded among investors without the involvement of the issuing company. Investors buy and sell previously issued securities, such as stocks and bonds, on organized exchanges like the New York Stock Exchange (NYSE) or the Nasdaq, or through over-the-counter (OTC) markets. The secondary market provides liquidity to investors by enabling them to buy and sell securities easily and quickly. Prices of securities in the secondary market are determined by supply and demand dynamics and reflect investors' perceptions of a company's value and future prospects. Most of the trading activity in the stock market occurs in the secondary market, as investors frequently buy and sell shares among themselves without involving the issuing company.
Top of Form
In summary, the primary market is where new securities are issued and sold by companies to raise capital, while the secondary market is where previously issued securities are traded among investorsBottom of Form
Traditional Trading Venues:
New York Stock Exchange (NYSE): Historically, the NYSE was a prominent stock exchange where most trading occurred on its trading floor in lower Manhattan. Market makers, known as specialists, facilitated trades by matching buyers and sellers. They posted bid (buy) and ask (sell) prices for each stock, ensuring liquidity by always being willing to take the other side of the trade. Investors typically bought at the ask price and sold at the bid price, with the difference between them known as the bid-ask spread. The NYSE specialized in single-market maker per stock.
Nasdaq: Unlike the NYSE, Nasdaq didn't have a physical trading floor; all trading was done electronically or over the phone. Nasdaq featured multiple market makers for each stock, competing with one another. Market makers posted bid and ask prices on the Nasdaq network, visible to all participants. They earned profits from the bid-ask spread, with customers buying at the ask price and selling at the bid price. Nasdaq's structure allowed for increased competition among market makers, potentially resulting in narrower bid-ask spreads and lower transaction costs for investors.
Top of Form
New Competition and Market Changes:
In the early 2000s, the NYSE and Nasdaq dominated U.S. stock trading, but their share declined due to competition from electronic exchanges and alternative trading systems. By 2012, these newcomers handled over 50% of trades.
With this shift, official market makers largely vanished as trading became electronic. Anyone can now make a market by posting a limit order, specifying a set amount and price to buy or sell a stock. The bid-ask spread, determined by limit orders, reflects the best prices to buy and sell.
Traders posting limit orders provide liquidity, while those executing immediate market orders are "takers" of liquidity. Liquidity providers risk orders becoming outdated, prompting high-frequency traders (HFTs) to exploit price changes. HFTs use computers to place, update, and execute trades rapidly, profiting from liquidity provision and exploiting outdated orders.
- Limit Orders and Liquidity: Traders who post limit orders set specific prices at which they are willing to buy or sell a stock. This adds liquidity to the market because it provides options for others to trade against.
- Market Orders and "Takers" of Liquidity: Traders who place market orders buy or sell immediately at the best available price. They "take" liquidity because they are executing trades based on existing orders in the market.
- Risk for Liquidity Providers: Traders who provide liquidity by posting limit orders risk their orders becoming outdated if market conditions change. For example, if new information affects stock prices, their orders may no longer be attractive.
- High-Frequency Traders (HFTs): These traders use computer algorithms to quickly place, update, and execute trades based on market conditions. They profit by both providing liquidity (matching trades) and taking advantage of outdated orders, exploiting price changes in the market.
Dark pools
Dark pools are private trading platforms where investors can buy and sell stocks without publicly displaying their orders, allowing for potentially better prices but with less transparency compared to regular stock exchanges.
Dark Pools: Dark pools are alternative trading systems where orders are not displayed publicly like on regular exchanges. Instead, investors can trade at potentially better prices, but their orders may not be immediately filled.
Advantages: Traders use dark pools to get better prices and keep their trading strategies private.
Competition: With dark pools included, there are around 50 venues for stock trading in the US. These venues compete for order volume, focusing on providing liquidity (many orders) to attract traders.
Different Rules: Exchanges experiment with various rules to attract liquidity providers and discourage traders who exploit outdated orders. Some pay for posting limit orders, while others charge for market orders or high-frequency trading.
Market Evolution: Stock markets are continually evolving, with changes in rules and competition among venues. The future of stock trading remains uncertain as new developments unfold.
1.4. Finance & technology
The relation between financial innovation and technical innovation has become known as Fintech.
Telecommunications
Telecommunications in finance refers to the use of communication technologies to facilitate trading and information exchange in the financial markets.
- The introduction of telegraph in the 1840s revolutionized finance by enabling real-time transmission of stock prices between distant locations, leading to faster and more efficient trading. This also led to the development of the first stock ticker system, which transmitted stock prices over telegraph lines. Over time, communication technologies evolved, eventually transitioning to digital CRT technology systems and then to computers and the Internet. Today, some traders use microwave technology to achieve the highest possible speeds in transmitting information and orders, further enhancing market efficiency.
Top of Form
Bottom of Form
Security & Verification
security and verification technology in finance has a long history of development. It started with ancient methods like writing to keep track of transactions. Later, technologies like the telegraph and fax machine helped banks verify transactions faster over long distances.
Nowadays, the finance industry is pioneering a new technology called blockchain. Blockchain allows transactions to be recorded securely in a public database without needing a central authority like a bank. It was first used for cryptocurrencies like Bitcoin. This technology has the potential to change how financial transactions are done by making them more transparent and secure. However, its success depends on whether it's better than current methods.
Automation of banking services
In the world of consumer banking, automation has played a significant role in enhancing services. The introduction of the automatic teller machine (ATM) in 1967 marked the beginning of automated customer service, allowing people to perform various banking tasks without the need for human interaction. Today, automation in banking extends to tasks such as account opening, fund transfers between different institutions, bill payments, and even loan applications and approvals, all achievable without speaking to a bank representative.
Recent advancements in technology have led to the emergence of smartphone apps like PayPal's Venmo, Tencent's WeChat, and Block's Cash App, enabling individuals to make instant payments and money transfers effortlessly. In developing countries, cellular phones have become gateways to automated banking services, providing millions of people access to the modern financial system.
Moreover, the rise of robo-advisors presents a potential disruption to traditional investment advising. These computer programs offer personalized investment recommendations, aiming to replace human financial advisors. Whether consumers will embrace these automated services with the same enthusiasm as they did with ATMs remains uncertain, but the trend towards automation in banking services continues to reshape the industry.
Big data & machine learning
n the realm of finance, the concept of "big data" has been integral long before the term was coined. Financial institutions have recognized the value of collecting and utilizing data for decision-making purposes. Newspapers historically stored security prices, and with the rise of computers, companies like Bloomberg emerged, focusing on data collection and dissemination. In the 1990s, stock exchanges began offering trade-by-trade data, laying the foundation for what is now considered big data.
Today, investors have access to an extensive array of financial data at minimal cost, empowering them with insights into the companies they invest in. This abundance of data also enables firms and policymakers to make more informed decisions.
Machine learning algorithms have become crucial in predicting market price changes. Early attempts at identifying repeatable patterns in data were less successful, but with advancements in technology and computing power, companies like Renaissance Technologies and D.E. Shaw developed sophisticated pattern recognition software that accurately predicts short-term price movements. Their success is partly attributed to investors' tendency to conceal their advantage by spreading out their trades over time, a behavior that can be exploited to forecast future price moves. However, as algorithms compete and traders adjust their strategies to become less predictable, forecasting future price moves becomes increasingly challenging, leading to a technological arms race.
The availability of data has not only enhanced targeting in various sectors but has also revolutionized financial services. Start-ups like SoFi, LendingClub, and Upstart, along with established lenders like Capital One, utilize machine learning to make more informed lending decisions beyond basic credit scores. Similarly, insurance providers structure their offerings using big data. While these advancements open new markets and potentially reduce costs, there are concerns about higher-risk customers facing increased service costs or being denied service altogether based on machine learning algorithms.
Compétions
Technological advances have also paved the way for non-financial organizations to offer financial services. Companies like Apple, PayPal, and Google provide payment services traditionally offered by banks, while Amazon and Square offer business loans leveraging the data they collect on vendors. This intense competition is expected to drive further innovation in the financial industry.
Given finance's historical track record of embracing new technologies, continued investment in fintech is anticipated. The resulting innovations will likely continue reshaping the financial industry, offering both substantial profits to early adopters and significant value to end-users and the broader economy.
Top of Form
Chap 2 : intro to financial statement analysis Bottom of Form
Top of Form
Despite this broad ownership, stock ownership remains the primary tie investors have to the company. Therefore, it's crucial for investors to learn about a company before investing. Financial statements play a vital role in this process by communicating essential financial information regularly.Bottom of Form
Bottom of Form
2.1. Firms’ Disclosure of Financial Information
Financial statements are essential accounting reports containing past performance information issued periodically by firms, typically quarterly and annually.
Public companies in the United States are mandated to file these statements with the U.S. Securities and Exchange Commission (SEC) quarterly on Form 10-Q and annually on Form 10-K. Additionally, they must send an annual report with financial statements to shareholders.
While private companies also prepare financial statements, they are not obligated to disclose them publicly. These statements serve as crucial tools for investors, financial analysts, creditors, and internal managers, providing insights for corporate financial decisions.
Preparation of financial statements
Financial statements must adhere to Generally Accepted Accounting Principles (GAAP) to ensure accuracy and comparability across firms. Auditors, neutral third parties, are hired to verify the accuracy of annual financial statements prepared according to GAAP.
However, due to varying accounting standards globally, international companies face complexity in financial reporting. To address this, the International Financial Reporting Standards (IFRS) were established, aiming for global harmonization of accounting standards.
Differences between U.S. GAAP and IFRS are in inventory valuation, R&D expenses, impairment charges, and financial instruments treatment. While the SEC requires U.S. firms to report using U.S. GAAP, they may provide supplemental information using IFRS. The CFO's role has evolved post-crisis to include a broader focus on risk management, capital allocation, and advising business leaders. Key lessons from the financial crisis include prioritizing liquidity, building robust control infrastructure, and acting swiftly to address challenges.
Types of financial statements :
- the balance sheet,
- the income statement,
- the statement of cash flows
- the statement of stockholders’ equity.
These financial state- ments provide investors and creditors with an overview of the firm’s financial performance.
2.2. the balance sheet
The balance sheet, or statement of financial position,lists the firm’s assets and liabilities, providing a snapshot of the firm’s financial position at a given point in time.
 The balance sheet is divided into two parts (“sides”), with the assets on the left side and the liabilities on the right. The assets list the cash, inventory, property, plant, and equipment, and other investments the company has made; the liabilities show the firm’s obligations to creditors. Also shown with liabilities on the right side of the balance sheet is
Assets = Liabilities + stockholder equity
Ex : 177,7 = 155,5 + 22,2 ( as seen in the picture)
Assets
Assets are resources owned by a company that provide future economic benefits. They are classified into current assets and long-term assets on the balance sheet.
- Current Assets: These are assets expected to be converted into cash or used up within one year. They include:
- Cash and Marketable Securities: Easily convertible, low-risk investments.
- Accounts Receivable: Amounts owed to the company by customers who purchased goods or services on credit.
- Inventories: Raw materials, work-in-progress, and finished goods.
- Other Current Assets: Miscellaneous items like prepaid expenses.
- Long-Term Assets: These assets provide benefits beyond one year. They include:
- Property, Plant, and Equipment (PP&E): Tangible assets like real estate and machinery used for more than a year. Depreciation is deducted annually to account for wear and tear.
- Goodwill and Intangible Assets: Recorded when a company pays more for another company than the book value of its tangible assets. Represents intangible assets like brand names, patents, and customer relationships.
- Other Long-Term Assets: Various items such as non-operating property, startup costs, long-term investments, and property held for sale.
The total assets = currents assets + LT assets
Liabilities
Liabilities represent a company's obligations to other parties and are classified into current and long-term liabilities on the balance sheet.
- Current Liabilities: These are obligations expected to be settled within one year and include:
- Accounts Payable: Amounts owed to suppliers for goods or services purchased on credit.
- Short-term Debt: Repayments of debt due within the next year.
- Accrued Expenses: Amounts owed for expenses like salaries, taxes, and unearned revenue.
The difference between current assets and current liabilities yields the net working capital, which is the short-term capital available to run the business.
- Long-Term Liabilities: These are obligations extending beyond one year and include:
- Long-term Debt: Loans or debt obligations with maturities exceeding one year, often used for major investments or asset purchases.
- Leases: Contracts obligating the firm to make regular payments for using assets like buildings.
- Deferred Taxes: Taxes owed but not yet paid due to differences between financial reporting and tax regulations.
Long-term liabilities help finance large-scale investments or acquisitions and are crucial for sustaining a company's operations over time.
Understanding a company's liabilities helps assess its financial health, debt management, and ability to meet its obligations in the short and long term.
Top of Form
Stockholdler’s equity Bottom of Form
Stockholders' Equity, also known as shareholders' equity or net worth, represents the residual interest in the company's assets after deducting its liabilities. It reflects the value of the shareholders' ownership stake in the company.
- Formula : Total assets – Total liabilities . It represents the book value of equity, which is an accounting measure of the firm's net worth.
- Historical Cost vs. True Value: Assets listed on the balance sheet are often recorded at historical cost rather than their current market value. For example, property, plant, and equipment are recorded at their acquisition cost net of depreciation. However, the actual value of these assets today may be different from their historical cost.
- Unrecorded Assets: Many valuable assets, such as intellectual property, brand reputation, customer relationships, and employee expertise, are not captured on the balance sheet. These intangible assets contribute to the firm's overall value but are not reflected in its book value of equity.
Understanding stockholders' equity provides insights into the financial health and value of a company from the perspective of its shareholders. However, it's essential to recognize that the balance sheet may not fully capture all the company's assets and their true value.
MArket value vs Book value
Market value and book value are two different measures of a company's equity, reflecting different perspectives on its worth:
- Book Value of Equity: This is the value of shareholders' equity as reported on the company's balance sheet ( the OG price), adjusted for depreciation). It represents the accounting value of the company's assets minus its liabilities. Book value is based on historical cost and may not accurately reflect the current market value of the company's assets.
Ex : If you have a car. Its book value is what you paid for it originally, minus any depreciation. So, if you bought it for $20,000 and it's now worth $15,000 after some years, its book value is $15,000.
- Market Value of Equity: Also known as market capitalization, it represents the total value of a company's outstanding shares in the stock market. Market value is determined by the current market price per share multiplied by the total number of shares outstanding. It reflects investors' expectations about the company's future performance and growth prospects. (Market value is what you can actually sell it for today.)
Ex : Now, imagine you want to sell that car. The market value is what someone is willing to pay for it right now. Maybe you find a buyer willing to pay $18,000 for your car. That's its market value.
Key Points:
- Market value often exceeds book value, especially for successful firms, because investors anticipate future earnings and growth potential.
- The market-to-book ratio, also known as the price-to-book (P/B) ratio, compares a company's market value to its book value of equity. A ratio greater than 1 indicates that the market values the company's assets higher than their historical cost.
- Variations in the market-to-book ratio reflect differences in fundamental firm characteristics and the value added by management.
- Companies with high market-to-book ratios are often considered growth stocks, while those with low ratios may be classified as value stocks.
In the context of a company:
- Book value is what the company's assets are worth according to its financial records.
- Market value is how much investors think the company is worth based on its stock price.
When market value is higher than book value, it means investors believe the company's assets are worth more than what's recorded on paper. This usually happens with growing or successful companies.
Understanding the relationship between market value and book value provides insights into investor perceptions and expectations regarding a company's financial health and growth prospects.
Top of Form
Bottom of Form
ExampleTop of Form
Market Versus Book Value
Problem : If Global has 3.6 million shares outstanding, and these shares are trading for a price of $14 per share, what is Global’s market capitalization? How does the market capitalization compare to Global’s book value of equity in 2022?
Solution : Global’s market capitalization is ( 3.6 million shares ) × ( $14 share ) = $50.4 million. This market capitalization is significantly higher than Global’s book value of equity of $22.2 million. Thus, investors are willing to pay 50.4 22.2 = 2.27 times the amount Global’s shares are “worth” according to their book value.
Market-to-Book Ratio. In Example 2.1, we computed the market-to-book ratio (also called the price-to-book [P/B] ratio) for Global, which is the ratio of its market capital- ization to the book value of stockholders’ equity.
Market-to-Book Ratio = Market Value of Equity / Book Value of Equity
Enterpise value Bottom of Form
Enterprise value is the total cost to buy a company, including its stock value, debt, and minus any cash it has.
- Enterprise Value: This is like the total cost to buy a company. It includes everything you need to pay to take over the business.
- Market Value of Equity: This is the value of the company's stock, which we talked about earlier.
- Debt: This is how much the company owes to others.
- Cash: This is how much money the company has in the bank.
So, to find the enterprise value, you add up:
- The market value of the company's stock,
- The debt the company owes, and
- Then, you subtract any cash the company has because if you buy the company, you'll get that cash back.
Example:
- If the market value of a company's stock is $100 million,
- Its debt is $50 million,
- And it has $20 million in the bank,
Then, the enterprise value would be $100 million (stock) + $50 million (debt) - $20 million (cash) = $130 million. So, it would cost about $130 million to buy the whole company.
2.3. the income statement
The income statement or statement of financial performance5 lists the firm’s revenues and expenses over a period of time.
Earning Calculations
The income statement shows the revenue and expenses of a company over a period of time. It starts with the total sales revenue and subtracts the cost of sales to calculate the gross profit.
- Example: Gross profit is calculated as Total Sales Revenue minus Cost of Sales: $1,000,000 - $500,000 = $500,000.
- Explanation: Gross profit reflects the profit generated from sales revenue after deducting the direct costs of producing the goods or services sold.
Then, it deducts operating expenses such as administrative costs and depreciation to find the operating income.
- Example: Operating income is calculated as Gross Profit minus Operating Expenses and Depreciation: $500,000 - ($200,000 + $50,000) = $250,000.
- Explanation: Operating income, also known as earnings before interest and taxes (EBIT), reflects the profit from operations before considering interest expenses and taxes.
After accounting for other income and expenses, it computes the earnings before interest and taxes (EBIT).
Explanation: EBIT represents the company's earnings before deducting interest expenses and income taxes.
By subtracting interest expenses and taxes, the statement arrives at the net income, which represents the profit attributable to the company's shareholders. This net income is often reported as earnings per share (EPS), indicating the profit earned per share of stock outstanding. Diluted EPS considers the potential impact of additional shares from stock options or convertible bonds, providing a more conservative measure of earnings per share.
- Net Income:
- Example: After paying taxes of $50,000, the company's net income is $150,000 ($200,000 - $50,000).
- Explanation: Net income, also known as the bottom line, represents the company's profit after deducting all expenses, including taxes.
- Earnings Per Share (EPS):
- Example: If the company has 100,000 shares outstanding, its EPS would be $1.50 ($150,000 / 100,000). ( Net income / shares outstanding)
- Explanation: Earnings per share is the portion of a company's net income attributable to each outstanding share of its common stock, indicating its profitability on a per-share basis.
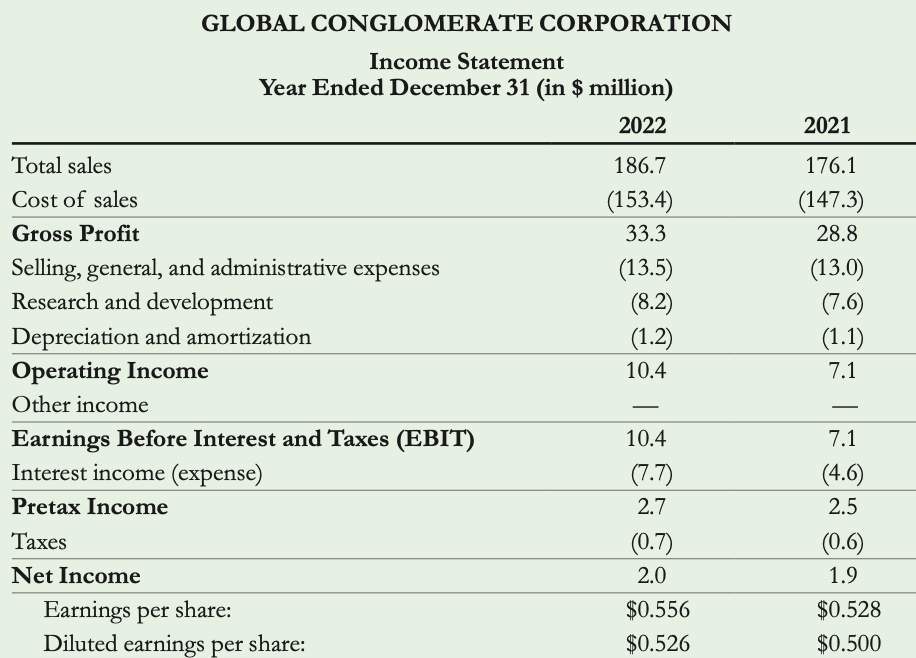
What is the diff between gross profit and net income? The main difference between gross profit and net income is that gross profit only considers the direct costs of production, while net income accounts for all expenses, including operating expenses, interest, taxes, and other non-operating costs. Net income provides a more comprehensive view of a company's profitability compared to gross profit.
What is diluted EPS? Diluted earnings per share (EPS) is a measure of a company's earnings per share calculated by considering the potential impact of dilutive securities, such as stock options, convertible bonds, or preferred stock, that could increase the number of shares outstanding.
2.4. Statement of cash flows
The Statement of Cash Flows is a financial statement that provides information about a company's cash inflows and outflows over a specific period. It helps investors understand how much cash the company has generated and how it has been used.
Operating Activities
This section starts with the company's net income from the income statement and then adjusts it by adding back non-cash expenses and accounting for changes in working capital.
- Purpose: It shows how much cash the company has generated or used in its core operations, providing insights into its ability to generate cash from its primary business activities , considering both cash and non-cash transactions.
- Adjusting for Non-Cash Items:
- Definition: Non-cash items, such as depreciation and amortization, are added back to net income because they are not actual cash outflows.
- Example: In 2022, Global had depreciation and amortization expenses of $1.2 million, which were added back to the net income of $2.0 million, resulting in a total cash flow from operating activities of $3.2 million.
- Adjusting for Changes in Working Capital:
- Accounts Receivable: When sales are recorded but cash has not been received yet, the increase in accounts receivable is deducted from net income because it represents additional lending to customers, reducing cash available.
- Accounts Payable: Increases in accounts payable are added back to net income because they represent borrowing from suppliers, increasing cash available.
- Inventory: Increases in inventory are deducted from net income because they represent cash expenses for the firm.
- Other Current Assets and Liabilities: Changes in other current assets and liabilities, excluding cash and debt, are also accounted for.
- Example: Global's accounts receivable increased by $5.3 million from 2021 to 2022. This increase is deducted from net income to reflect the negative impact on cash flow from operating activities
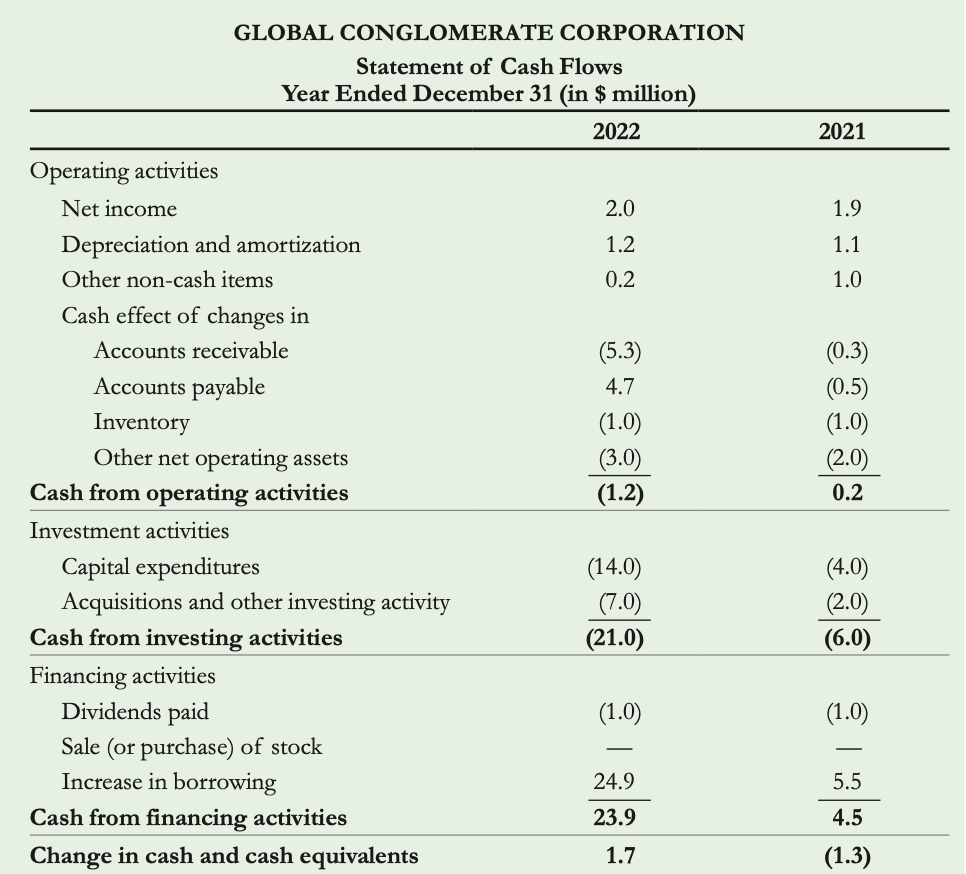
Investment Activities
This section lists the cash used/required for investment purposes, such as purchasing or selling assets like property, plant, and equipment (capital expenditures), or making investments in other companies.
- Purpose: It highlights the company's investment decisions and capital expenditures, indicating how it is allocating its resources for future growth or strategic purposes.
Here's how it works:
- Capital Expenditures (CapEx):
- Definition: Capital expenditures are investments made by the company in new property, plant, and equipment (PP&E).
- Explanation: While capital expenditures do not immediately impact the income statement as expenses, they represent cash outflows for the company.
- Example: In 2022, Global spent $21 million in cash on capital expenditures, indicating investments in new assets like buildings, machinery, or equipment.
- Other Investments:
- Definition: This category includes other long-term investments made by the company, such as acquisitions of other businesses or purchases of marketable securities.
- Explanation: These investments are also cash outflows for the company and are deducted from the cash flow from operating activities.
- Example: If Global acquired another company during the year or purchased marketable securities, the cash spent on these activities would be deducted from the cash flow from operating activities.
Overall, the investment activities section reflects the cash spent by the company on acquiring or improving assets, as well as on other long-term investments.
Top of Form
Bottom of Form
Financing Activities:
This section shows the flow of cash between the company and its investors, including activities such as issuing or repurchasing stocks, paying dividends, borrowing or repaying debt, and other financing transactions.
- Purpose: It reveals how the company is financing its operations and growth, whether through equity or debt, and how it is managing its capital structure.
Overall, the Statement of Cash Flows provides valuable insights into a company's liquidity, solvency, and financial flexibility, helping investors assess its ability to meet short-term obligations, fund future growth initiatives, and generate returns for shareholders.
Top of Form
Here's a breakdown:
- Dividends Paid:
- Definition: Dividends paid to shareholders represent a cash outflow from the company.
- Explanation: Dividends are the portion of the company's earnings distributed to its shareholders as a return on their investment.
- Example: In 2022, Global paid $1 million in dividends to its shareholders, indicating the cash outflow used to distribute profits.
- Retained Earnings:
- Definition: Retained earnings represent the portion of net income that is not paid out as dividends but retained by the company for reinvestment or other uses.
- Explanation: It reflects the amount of earnings reinvested back into the company for future growth.
- Example: If Global's net income was $2 million and it paid out $1 million in dividends, its retained earnings for the year would be $1 million.
- Stock Issuance or Repurchase:
- Definition: This includes cash received from issuing new shares of stock or cash spent on repurchasing existing shares.
- Explanation: Issuing stock raises capital for the company, while repurchasing stock reduces the number of outstanding shares.
- Example: If Global issued new shares during the year to raise funds or repurchased some of its own stock, these transactions would be reflected in this section.
- Changes in Borrowing:
- Definition: This reflects the cash inflows or outflows from changes in short-term and long-term borrowing.
- Explanation: Increases in borrowing represent cash inflows as the company raises capital through debt issuance.
- Example: If Global borrowed additional funds during the year, the cash received from borrowing would be included in this section.
The final line of the financing activities section summarizes the net cash inflows or outflows from financing activities. This section helps investors understand how the company is financing its operations and investments and whether it is relying more on debt or equity financing.
Bottom of Form
2.5. Other Financial statement information
Statement of Stockholders’ Equity
This statement breaks down the stockholders’ equity from the balance sheet into components like retained earnings and net sales of stock.
- It helps track changes in equity over time. For example, if a company had no stock sales or repurchases, its stockholders’ equity would increase by the amount of retained earnings.
Change in stockholders’ equity = Retianed earnings + Net sales of stocks
= Net income – Dividends + sales of stock – repurchases of stock
Management Discussion and Analysis (MD&A)
It’s where the company’s management provides info on recent performance, significant events, and future plans. It discusses the company's strategies, goals, and potential risks it faces. It also discloses any off-balance sheet transactions, which are arrangements that could affect the company's future performance but aren't listed on the balance sheet.
Notes to the Financial Statements
These are detailed explanations accompanying the financial statements. They clarify accounting assumptions, provide information on subsidiaries or product lines, detail stock-based compensation plans, and outline debt types and repayment schedules. Notes also cover acquisitions, leases, taxes, and risk management activities. They're crucial for interpreting the financial statements fully.
Example 2.3 illustrates how companies report sales revenues by product category and calculate percentage growth to forecast future revenues. For instance, if a product category showed the highest growth rate in one year, analysts can use that rate to estimate its revenues for the next year.
2.6. Financial statement analysis
Financial ratios are used to assess the financial health and performance of a company by analyzing its financial statements. These ratios provide insights into various aspects such as profitability, liquidity, leverage, and valuation. Here's a simplified explanation of some key financial ratios mentioned in the text:
- Profitability Ratios: These ratios measure the company's ability to generate profits relative to its revenue.
- Gross Margin: Percentage of revenue retained after subtracting the cost of goods sold.
- Operating Margin: Operating income as a percentage of revenue.
- EBIT Margin: Earnings Before Interest and Taxes (EBIT) as a percentage of revenue.
- Net Profit Margin: Net income as a percentage of revenue.
- Liquidity Ratios: These ratios assess the company's ability to meet its short-term obligations.
- Current Ratio: Current assets / current liabilities.
- Quick Ratio: (Current assets - Inventory) / current liabilities.
- Cash Ratio: Cash and cash equivalents / current liabilities.
- Working Capital Ratios: These ratios measure the efficiency of the company's working capital management. ( unit : dys)
- Accounts Receivable Days: Average number of days it takes to collect accounts receivable.
- Accounts Payable Days: Average number of days it takes to pay accounts payable.
- Inventory Days: Average number of days inventory is held.
- Interest Coverage Ratios: These ratios indicate the company's ability to cover interest expenses.
- EBIT/Interest Coverage: Earnings Before Interest and Taxes (EBIT) divided by interest expenses.
- EBITDA/Interest Coverage: Earnings Before Interest, Taxes, Depreciation, and Amortization (EBITDA) divided by interest expenses.
- Leverage Ratios: These ratios assess the company's debt levels.
- Debt-Equity Ratio: Total debt divided by total equity.
- Debt-to-Capital Ratio: Total debt divided by total debt plus total equity.
- Valuation Ratios: These ratios assess the company's valuation in the market.
- Price-Earnings (P/E) Ratio: Market price per share divided by earnings per share.
- Enterprise Value to EBITDA: Enterprise value divided by EBITDA.
- Operating Returns: These ratios measure the company's returns from its operations.
- Return on Equity (ROE): Net income divided by shareholders' equity.
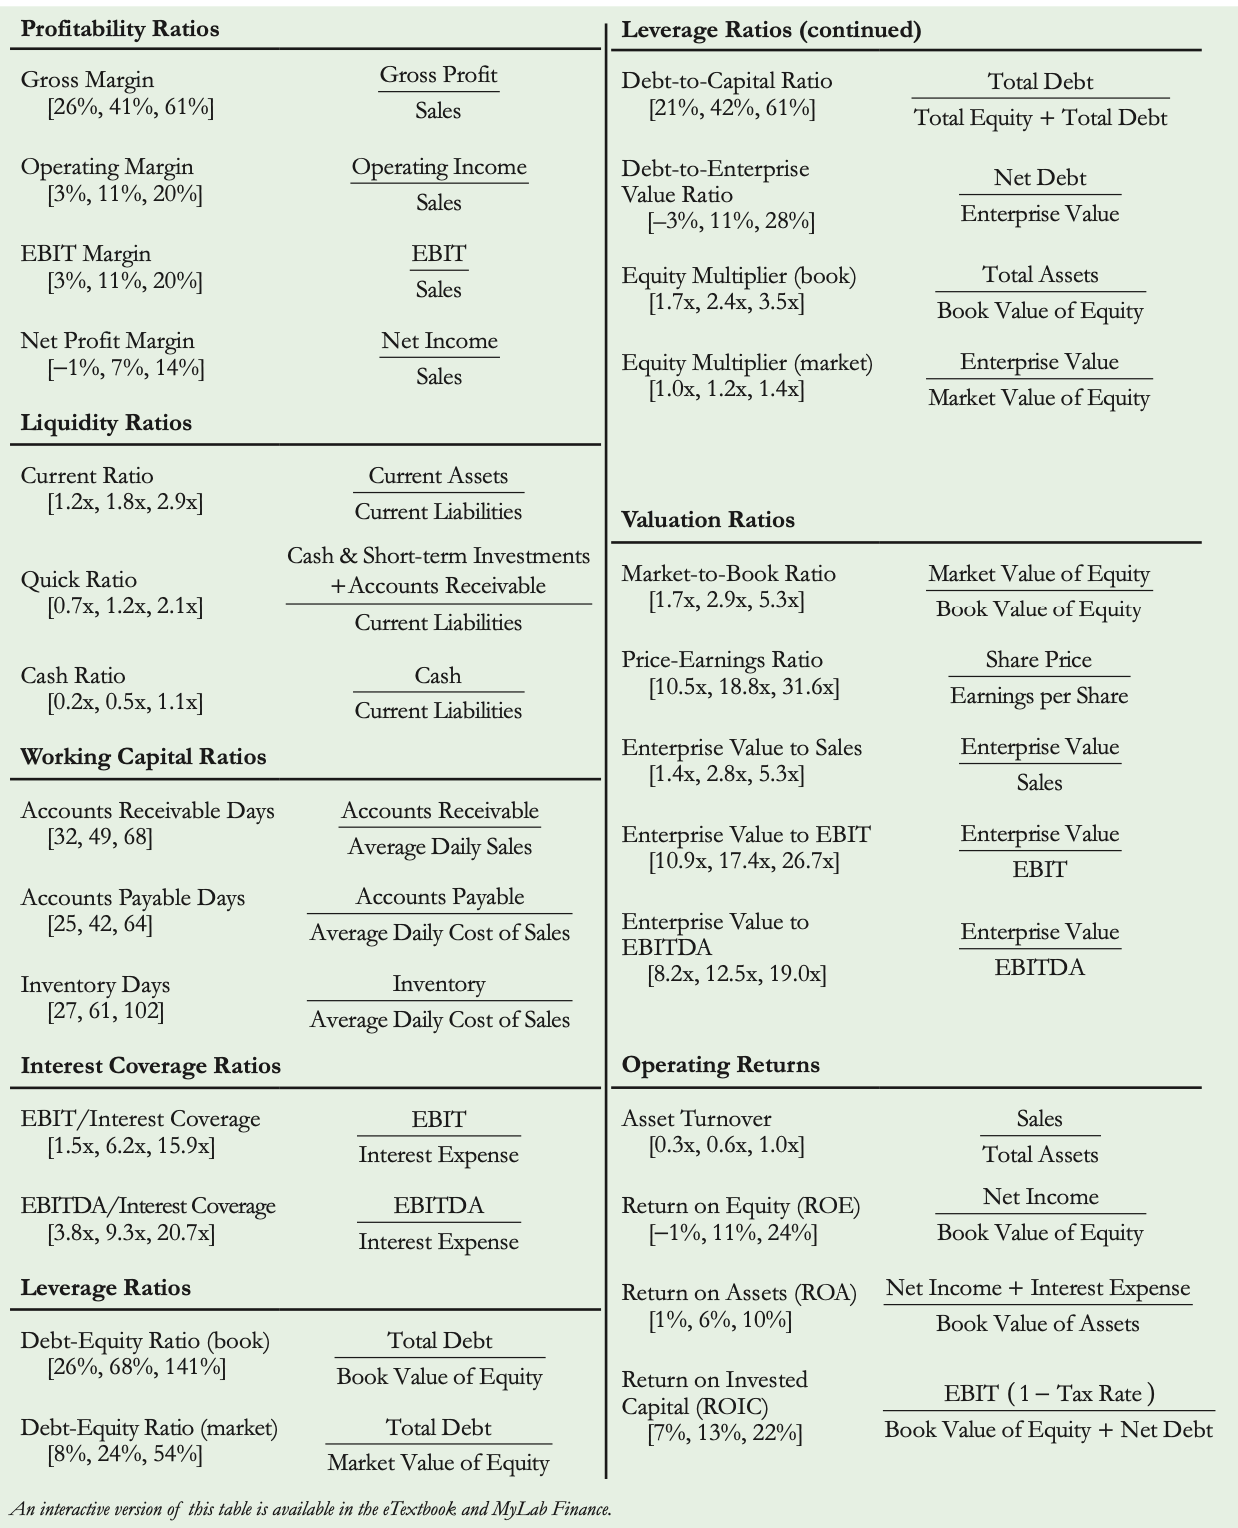 Return on Assets (ROA): Net income plus interest expenses divided by total asse
ts.
Dupont Identity
The DuPont Identity is a powerful analytical tool used to break down a firm's return on equity (ROE) into its component parts, providing insights into the drivers of profitability. It expresses ROE as the product of three ratios: net profit margin, asset turnover, and equity multiplier.
- Net Profit Margin: This ratio measures the firm's profitability by expressing how much profit the company generates from each dollar of sales. It is calculated as net income divided by sales.
- Asset Turnover: Asset turnover indicates how efficiently a company is utilizing its assets to generate revenue. It is calculated as sales divided by total assets.
- Equity Multiplier: The equity multiplier represents the degree of financial leverage used by the firm, indicating how much assets are financed by equity versus debt. It is calculated as total assets divided by shareholder's equity (or book value of equity).
Formula : Net prfot marign x asset turnover x equity multiplier
- Walmart:
- Net profit margin = $13.7 billion / $572.8 billion ≈ 2.39%
- Asset turnover = $572.8 billion / $244.9 billion ≈ 2.34
- Equity multiplier = $244.9 billion / $83.3 billion ≈ 2.94
- ROE = 2.39% × 2.34 × 2.94 ≈ 16.4%
- Target:
- Net profit margin = $6.9 billion / $106 billion ≈ 6.51%
- Asset turnover = $106 billion / $53.8 billion ≈ 1.97
- Equity multiplier = $53.8 billion / $12.8 billion ≈ 4.20
- ROE = 6.51% × 1.97 × 4.20 ≈ 53.9%
Despite having lower asset turnover, Target achieves a higher ROE than Walmart due to its higher net profit margin and leverage.
If Target had a similar equity multiplier to Walmart, its ROE would have been: = 6.51% × 2.34 × 2.94 ≈37.7%
TargetROE=6.51%×2.34×2.94≈37.7%
This calculation assumes Target's leverage (equity multiplier) is the same as Walmart's, leading to a hypothetical ROE.
q
The Enron and WorldCom scandals were two prominent cases of corporate financial fraud in the early 2000s. Enron, once praised as innovative, used deceptive accounting methods to inflate its financial performance, ultimately leading to its bankruptcy filing in 2001. Similarly, WorldCom engaged in accounting fraud by misclassifying expenses as capital expenditures to overstate its earnings. These scandals prompted the enactment of the Sarbanes-Oxley Act in 2002, aimed at improving financial reporting transparency and corporate governance. Despite regulatory efforts, financial scandals like the Wirecard case in Germany continue to underscore the ongoing challenges in ensuring financial integrity and regulatory compliance.
Chap 3 : Financial Decision Making and the Law of One Price
Microsoft's decision to enter a bidding war with Google and Yahoo! for a stake in Facebook in 2007 was based on a careful assessment of the costs and benefits. They evaluated the potential revenues from advertising sales on Facebook, along with the appreciation of their stake in the company.
- By using the Valuation Principle, which relies on current market prices to determine the value of costs and benefits, Microsoft could compare the benefits of the investment against its costs. This principle allowed them to calculate the net present value (NPV) of the decision, indicating whether the cash value of benefits exceeded the cash value of costs at the present time. Ultimately, Microsoft's decision proved profitable, as the value of their stake in Facebook appreciated significantly by the time of Facebook's IPO in 2012. The concept of the Law of One Price, which asserts that equivalent investment opportunities in competitive markets must have the same price, underpins the valuation process in financial decision-making.
3.1. Valuing decisions
Objectif : how to make decisions that increase the value of the firm to investors
This involves these skills:
Marketing: to forecast the increase in revenues resulting from an advertising campaign
Accounting: to estimate the tax savings from a restructuring
Economics: to determine the increase in demand from lowering the price of a product
Organizational Behavior : to estimate the productivity gains from a change in management structure
Strategy: to predict a competitor’s response to a price increase Operations: to estimate the cost savings from a plant modernization
Analyzing costs & benefits
1st step in decision making identifying the costs & benefits of a decision, then it’s to quantify them .
When making decisions, iwe need to understand the costs and benefits involved. First, we identify what we stand to gain (benefits) and lose (cost). Then, we put a number on these gains and losses to compare them effectively ( quantify them) .
EXAMPLE:
Imagine a jewelry maker has the chance to trade 400 ounces of silver for 10 ounces of gold today. But because gold and silver have different values, it's not enough to just count ounces—we need to figure out their cash value today to compare them properly.
For the silver, let's say it's worth $25 per ounce in the market right now. So, 400 ounces of silver equals $10,000 today. Now, for the gold, let's assume it's valued at $1900 per ounce today. That means the 10 ounces of gold are worth $19,000 today.
Now that we've put both the costs and benefits in terms of cash value today, we can compare them. The jewelry maker stands to gain $19,000 from the gold but will lose $10,000 from the silver, resulting in a net gain of $9000 today. So, by making the trade, the jewelry maker will end up $9000 richer. That's how analyzing costs and benefits helps make smart decisions
Using market prices to determine cash values
In a competitive market, where goods can be bought and sold at the same price, that price determines the cash value of the goods. The decision maker's opinions or preferences don't alter this value as long as a competitive market exists.
Example 3.1 competitve market prices determine value
Problem: You have just won a radio contest and are disappointed to find out that the prize is four tickets to the Def Leppard reunion tour (face value $40 each). Not being a fan of 1980s power rock, you have no intention of going to the show. However, there is a second choice: two tickets to your favorite band’s sold-out show (face value $45 each). You notice that tickets to the Def Leppard show are being bought and sold online for $30 apiece and tickets to your favorite band’s show are being bought and sold at $50 each. Which prize should you choose?
Solution : The key to making the right choice between the two prize options lies in understanding market prices, not personal preferences or the face value of the tickets:
- Four Def Leppard tickets are worth $30 each online, totaling $120.
- Two tickets to your favorite band's show are worth $50 each, totaling $100.
Choosing the Def Leppard tickets and selling them would give you $120, which is more than enough to buy two tickets to your favorite band's show and still have $20 left over for a T-shirt.
- This decision-making process is guided by the Valuation Principle in finance, which states that the value of an asset is determined by its competitive market price. By evaluating costs and benefits using these market prices, we can determine whether a decision will increase the wealth of the firm or its investors.
EX 3.2. applying the valuation principle
Problem: You are the operations manager at your firm. Due to a pre-existing contract, you have the oppor- tunity to acquire 125 barrels of oil and 1500 pounds of copper for a total of $12,000. The cur- rent competitive market price of oil is $80 per barrel and for copper is $4 per pound. You are not sure you need all of the oil and copper, and are concerned that the value of both commodities may fall in the future. Should you take this opportunit
Solution : To decide whether to seize the opportunity, let's evaluate its costs and benefits using current market prices:
125 barrels of oil at $80 per barrel (125 x 80) = $10,000 today
1500 pounds of copper at $4 per pound (1500x4) = $6000 today
The total cost is $12,000 (10,000+ 6000-12,000).
However, the combined market value of the oil and copper is $16,000. So, the net value of the opportunity is $4000 today, indicating a positive outcome.
Even if you don't require all the oil and copper immediately, or anticipate a decline in their value, you can still sell them at current market rates, fetching $16,000. Therefore, taking this opportunity would benefit the firm, increasing its value by $4000.
3.2 interest rates & time value of money
For most financial decisions costs and benefits occur at different points in time. For example, typical investment projects incur costs up front and provide benefits in the future.
The time value of money
The time value of money refers to the principle that a dollar received today is worth more than a dollar received in the future. This is because money today can be invested or earn interest, increasing its value over time.
EX: if you have $1 today and invest it in a bank account with a 7% interest rate, you will have $1.07 at the end of one year.
Therefore, when evaluating investment opportunities w/ cash flows occurring at different points in time, it's essential to consider the time value of money. Simply subtracting future benefits from present costs ignores this principle and may lead to incorrect evaluations.
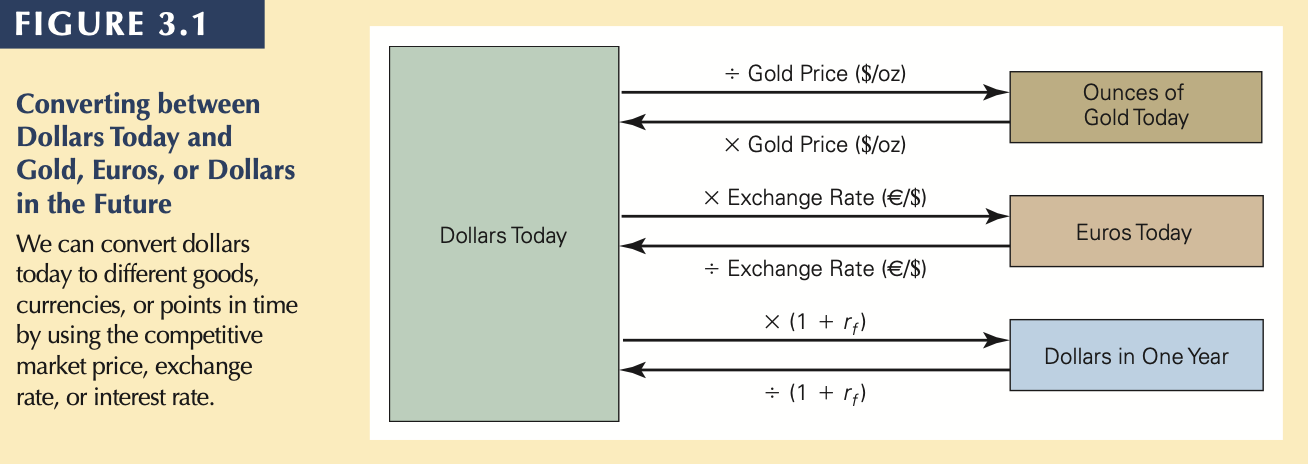
The Interest Rate: An Exchange Rate Across Time
The interest rate serves as an exchange rate across time, allowing us to convert money from one point in time to another. Just as an exchange rate enables us to convert money from one currency to another, the interest rate allows us to exchange money from one time period to another. This rate, known as the risk-free interest rate, represents the market price today of money in the future.
EX: if the current annual interest rate is 7%, it means that by borrowing or investing at this rate , we can exchange $1 today for $1.07 in one year. This exchange rate factor, denoted as (1 + ), risk-free interest rate defines the conversion rate between dollars today and dollars in one year, without any risk.
When evaluating investment opportunities, it's important to consider the time value of money. This principle states that a dollar received today is worth more than a dollar received in the future, due to the ability to invest and earn interest. Therefore, costs and benefits occurring at different points in time must be adjusted to a common time frame for accurate comparison.
EX value of investment in 1yr: To evaluate the investment considering the time value of money, we first adjust the cost of $100,000 today to its equivalent value in one year using the interest rate of 7%. This gives us a cost of $107,000 in one year ( 100 000 x 1.07).
Think of this as the opportunity cost of spending $100,000 today; we're essentially giving up the $107,000 we would have if we left the money in the bank. Alternatively, if we borrowed $100,000, we would owe $107,000 in one year.
Now, both costs and benefits are in terms of "dollars in one year," allowing us to directly compare them : 105,000 − $107,000 = −$2000 in one year
In other words, we could earn $2000 more in one year by putting our $100,000 in the bank rather than making this investment. We should reject the investment: If we took it, we would be $2000 poorer in one year than if we didn’t.
EX value of investement today : To determine the value of the investment in terms of dollars today, we use the interest rate factor to convert the benefit of $105,000 in one year to its equivalent amount in present terms.
We divide the future benefit by the interest rate factor, which is (1.07 $ in one year $ today). This gives us: Benefit = ($105,000 in one year) ÷ (1.07 $ in one year $ today) = $105,000 × 1 today
This calculation results in $98,130.84 today. This amount represents the present value of receiving $105,000 in one year, considering the time value of money. It's also the amount the bank would lend to us today if we promised to repay $105,000 in one year. Therefore, $98,130.84 is the competitive market price at which we can "buy" or "sell" $105,000 in one year.
Now, we can compute the net value of the investment in terms of dollars today. Subtracting the present value of $100,000 from the cost of $100,000 today yields:
$98,130.84 - $100,000 = -$1869.16 today
Once again, the negative result indicates that we should reject the investment. Taking the investment would make us $1869.16 poorer today because we have given up $100,000 for something worth only $98,130.84
Present vs future value : Both approaches show that the decision to reject the investment remains the same, whether we consider the value in dollars today or dollars in one year.
if we convert from dollars today to dollars in one year,
( −$1869.16 today ) × (1.07 $ in one year $ today ) = −$2000 in one year
we see that the two results are equivalent, but expressed as values at different points in time.
- Price Today of Money in the Future: When we talk about the value of money in the future, we need to consider how much it's worth in today's terms. For instance, if you're promised $1 a year from now, that $1 isn't worth as much if you had it in your hand today. The reason is you could invest that $1 today and earn some interest on it. So, to know its value today, we need to discount it.
- Discount Factor: The term 1/1+r , where r is the interest rate, represents this discount. EX: if the interest rate is 7%, then the discount factor is 1/1+0.07, which is approximately 0.93458. This means that $1 received in one year is worth about $0.93458 today.
- Risk-Free Interest Rate: This discount rate, represented by r, is also called the risk-free interest rate. It's called "risk-free" because it's the rate at which we can convert money from one point in time to another without any risk, like depositing money in a bank savings account.
So, in summary, the discount factor tells us how much less money received in the future is worth in today's terms, and the risk-free interest rate determines this discount factor.
EX 3.3 : comapring costs at different points in time
Problem : The cost of rebuilding the San Francisco Bay Bridge to make it earthquake-safe was approxi- mately $3 billion in 2004. At the time, engineers estimated that if the project were delayed to 2005, the cost would rise by 10%. If the interest rate were 2%, what would be the cost of a delay in terms of dollars in 2004?
Solution : If the project were delayed, it would cost $3 billion × 1.10 = $3.3 billion in 2005. To compare this amount to the cost of $3 billion in 2004, we must convert it using the interest rate of 2%:
$3.3 billion in 2005 ÷ ( $1.02 in 2005 $ in 2004 ) = $3.235 billion in 2004 Therefore, the cost of a delay of one year was
 $3.235 billion − $3 billion = $235 million in 2004
That is, delaying the project for one year was equivalent to giving up $235 million in cash.
We can use the risk-free interest rate to determine values in the same way we used competitive market prices.
3.3 present value & the NPV decision rule
While we can compare costs and benefits at any point in time, most businesses prefer to evaluate them in terms of their present value, i.e., how much they are worth in cash today. This simplifies decision-making and makes it more practical. Building on the Valuation Principle, we introduce the concept of Net Present Value (NPV). NPV helps us determine the current value of a series of cash flows by discounting them back to the present using the risk-free interest rate.
- Golden Rule: The NPV Rule states that if the NPV of a project is positive, it's considered a good investment because it adds value to the company. But, if the NPV is negative, it suggests that the project would subtract value from the company and should be avoided.
Net present value
NPV is the difference between the present value of benefits and the present value of costs associated with a project or investment. 🡪 NPV = PV (Benefits) − PV (Costs)
In NPV calculations, positive cash flows represent benefits, while negative cash flows represent costs. We calculate the present value of each cash flow and then sum them up to find the NPV. 🡪 NPV = PV ( All project cash flows ) NPV is the total of the present values of all project cash flows.
Ex: Let's say your firm is offered an investment opportunity where you invest $500 today and receive $550 in one year with certainty. Using the risk-free interest rate of 8%, we calculate the present value of the benefit as $509.26 today.
- PV calculation : $550/$1.08 = $509.26
- NPV Calculation: $509.26 - $500 = . $9.26 today
Even if your firm doesn't have the $500 upfront, it can borrow $509.26 from the bank at the 8% interest rate and then take the project. What are your cash flows in this case?
Today : $509.26 ( loan ) − $500 ( invested in the project ) = $9.26 In one year: $550 ( from project ) − $509.26 × 1.08 ( loan balance ) = $0
This transaction leaves you with exactly $9.26 extra cash today and no future net obliga- tions.
Positive NPV: A positive NPV indicates that the investment decision adds value to the firm, making it a good decision regardless of your current cash situation or spending preferences.
In summary, NPV helps companies assess the value of investment opportunities by comparing the present value of benefits with the present value of costs
The NPV Decison rule
The NPV Decision Rule simplifies investment decisions by focusing on cash flows today. Here's a breakdown:
Definition: NPV Decision Rule states that when faced with investment options, choose the one with the highest NPV. This choice is akin to receiving the NPV amount in cash today.
For projects, if NPV is positive, accepting it increases the wealth of the firm and its investors. If NPV is negative, rejecting it avoids decreasing wealth. When NPV equals zero, there's no gain or loss from accepting or rejecting the project.
- Positive NPV: Projects with positive NPV should be accepted because they increase wealth. Essentially, their NPV represents the cash you'd receive today if you choose that option.
- Negative NPV: Projects with negative NPV should be rejected because accepting them would reduce wealth. Not pursuing them doesn't incur any cost.
- Zero NPV: Projects with zero NPV neither increase nor decrease wealth. They're not necessarily bad but don't add value either.
In essence, the NPV Decision Rule guides investment choices by considering the present value of costs and benefits. It ensures decisions contribute positively to firm value and align with investors' interests.
EX 3.4 ; The NPV Is Equivalent to Cash Today
Problem : Your firm needs to buy a new $9500 high-speed printer. As part of a promotion, the manu- facturer has offered to let you pay $10,000 in one year, rather than pay cash today. Suppose the risk-free interest rate is 7% per year. Is this offer a good deal? Show that its NPV represents cash in your pocket.
Solution : If you take the offer, the benefit is that you won’t have to pay $9500 today, which is already in PV terms. The cost, however, is $10,000 in one year. We therefore convert the cost to a present value at the risk-free interest rate:
PV (Cost) = ($10,000 in one year ) ÷ (1.07 $ in one year $ today ) = $9345.79 today The NPV of the promotional offer is the difference between the benefits and the costs:
NPV = $9500 − $9345.79 = $154.21 today
The NPV is positive, so the investment is a good deal. It is equivalent to getting a cash discount today of $154.21, and only paying $9345.79 today for the printer. To confirm our calculation, sup- pose you take the offer and invest $9345.79 in a bank paying 7% interest. With interest, this amount will grow to $9345.79 × 1.07 = $10,000 in one year, which you can use to pay for the printer.
We can also use the NPV decision rule to choose among projects. To do so, we must compute the NPV of each alternative, and then select the one with the highest NPV. This alternative is the one that will lead to the largest increase in the value of the firm.
EX 3.5: Choosing among alternative plans Top of Form
Problem : Suppose you started a Web site hosting business and then decided to return to school. Now that you are back in school, you are considering selling the business within the next year. An investor has offered to buy the business for $200,000 whenever you are ready. If the interest rate is 10%, which of the following three alternatives is the best choice?
- Sell the business now.
- Scale back the business and continue running it while you are in school for one more year,
and then sell the business (requiring you to spend $30,000 on expenses now, but generating
$50,000 in profit at the end of the year).
- Hire someone to manage the business while you are in school for one more year, and then
sell the business (requiring you to spend $50,000 on expenses now, but generating $100,000 in profit at the end of the year).
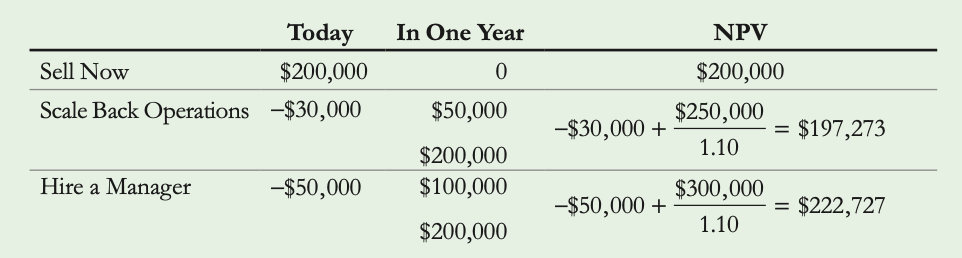 Solution:
NPV & cash needs
In the scenario where you need $60,000 immediately for expenses, selling the business might seem like the better option since it offers a lump sum of $200,000 upfront. However, considering NPV and cash needs, hiring a manager and selling the business later is actually the superior choice.
Here's why:
- Borrowing Strategy: By hiring a manager and borrowing $110,000 at a 10% interest rate, you'll owe $121,000 in one year (110,000 x 1.10). However, the total cash flows from this approach, including the $60,000 received immediately, result in a net gain of $179,000 in one year.
- Selling and Investing Strategy: Selling the business now and investing the excess $140,000 would yield $154,000 in one year (140,000 x 1.10). However, this strategy still leaves you with a total cash flow of $60,000 immediately.
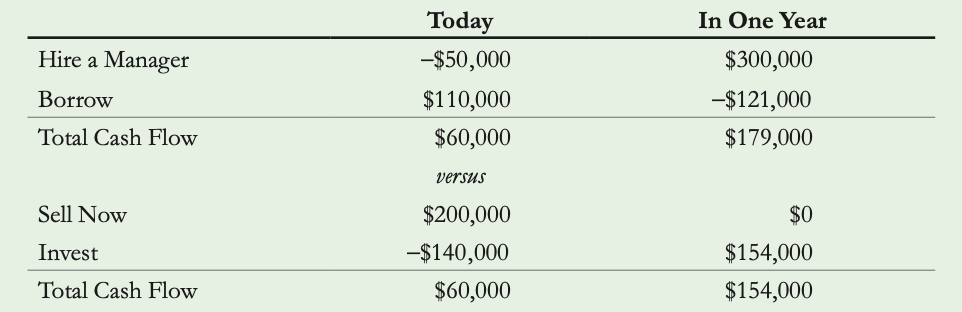 Comparison: Both strategies provide the needed $60,000 upfront. However, the hiring and borrowing option generates an additional $25,000 in one year compared to selling the business now and investing the proceeds.
- Maximizing NPV: The key takeaway is to prioritize maximizing NPV regardless of immediate cash needs. Afterward, you can adjust cash flows through borrowing or lending to align with your preferred timing.
In summary, regardless of preferences for cash distribution over time, focusing on maximizing NPV first ensures the most financially beneficial decision. Then, you can manage cash flow timing through borrowing or lending to achieve your preferred cash flow pattern.
3.4 Arbitrage and the Law of One Price
Arbitrage ensures that there's only one price for a items across different markets.
EX: Let's consider gold, which is traded in markets like New York and London. Suppose it's priced at $1850 per ounce in New York and $1900 per ounce in London. Which price should we use?
In such scenarios, arbitrage kicks in. Here's how:
- Arbitrage Opportunity: You can buy gold for $1850 per ounce in New York and sell it immediately for $1900 per ounce in London. This earns you $50 profit per ounce ( 1900-1850).
- Exploiting Arbitrage: If you trade large quantities, say 1 million ounces, you can make $50 million with no risk or investment.
- Market Response: Many others would spot this opportunity too. As they rush to exploit it, buy orders flood New York, and sell orders flood London. This surge in activity quickly adjusts the prices.
- Price Equalization: Prices adjust until they find a balance, likely somewhere between the initial prices. For instance, they might settle at $1875 per ounce.
Arbitrage ensures that differences in prices across markets are short-lived, as traders quickly exploit them, leading to price adjustments until equilibrium is reached.
Arbitage
Arbitrage is when people buy and sell the same thing in different places to profit from price differences. It's like finding free money because it involves no risk or investment. When such opportunities arise, investors rush to take advantage of them, driving prices back to balance. This process happens so quickly that arbitrage opportunities vanish fast, leaving markets in their normal state, where no such opportunities exist.
Law of one price
Top of FormThe Law of One Price states that if you can buy the same thing in different markets, it should cost the same everywhere.
EX: So, if gold is selling for $1850 in New York and $1900 in London, people will buy it where it's cheaper and sell where it's more expensive until prices are the same. This principle applies to all equivalent investment opportunities in competitive markets. It's handy because it means we can use any competitive price to figure out the cash value when calc
Bottom of Form
3.5. No-Arbitrage and Security Prices
Bottom of FormIn the world of finance, an investment opportunity traded in financial markets is called a financial security, or simply a security. The concepts of arbitrage and the Law of One Price have significant implications for security prices. We'll start by examining how these concepts affect the prices of individual securities and market interest rates. Then, we'll expand our view to value a group of securities. Along the journey, we'll gain crucial insights into firm decision-making and firm value, which will serve as the foundation for our exploration throughout this textbook.
Valuing a security w/ the law of one price
The Law of One Price states that equivalent investment opportunities should have the same price. We can use this principle to value a security if we can find another equivalent investment with a known price.
EX: Let's consider a simple security, like a bond, which promises a one-time payment of $1000 in one year. Assuming there's no risk associated with receiving this payment, we can deduce its price in a normal market given a risk-free interest rate of 5%.
To find the bond's price, we can compare it to another investment that yields the same cash flow. If we invest money at the bank's risk-free interest rate, how much would we need to invest today to receive $1000 in one year?
Using the PV formula, we calculate:
PV ($1000 in one year) = 1000 / 1.05 = $952.38 today
at the 5% risk-free interest rate would yield $1000 in one year with no risk.
Now, we have two ways to achieve the same cash flow: (1) buying the bond or (2) investing $952.38 at the 5% risk-free interest rate. Since these options generate equivalent cash flows, the Law of One Price dictates that they must have the same price in a normal market. Therefore, the price of the bond would be $952.38.$.
Identifying Arbitrage Opportunities with Securities :
Identifying Arbitrage Opportunities with Securities is essentially pinpointing instances where the Law of One Price is violated.
EX: Let's consider a scenario where the bond is priced at $940, lower than its fair value of $952.38. This creates an arbitrage opportunity.
To capitalize on this opportunity, we can buy the bond for $940 and simultaneously borrow $952.38 from the bank. With a 5% interest rate, we'll owe the bank $1000 in one year.
Here's the breakdown of cash flows:
- Today: Buy the bond for $940 and borrow $952.38 → Net cash flow: +$12.38 (- 940 + 952.38) .
- In One Year: Receive $1000 from the bond, pay back $1000 to the bank → Net cash flow: $0.00
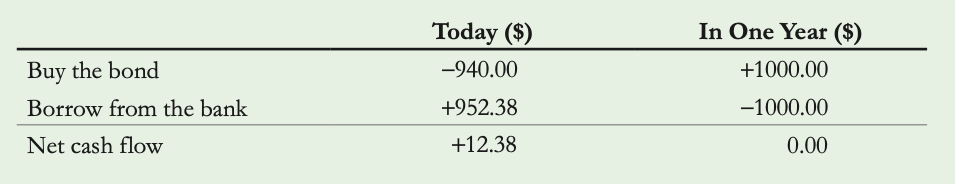 By executing this strategy, we profit $12.38 in cash today for each bond bought, without risking any of our own money or facing future obligations. However, as more investors catch wind of this opportunity and start buying the bond, its price will rise until it equals $952.38, eradicating the arbitrage chance.
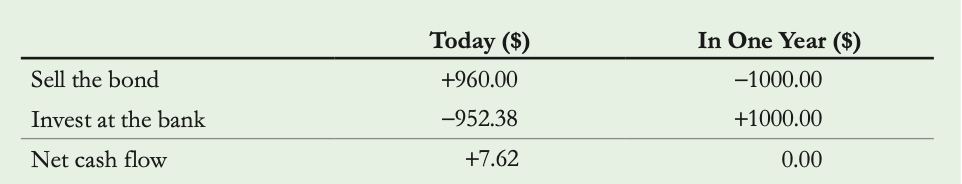 Conversely, if the bond's price is higher than $952.38, say $960, we'd sell the bond and invest $952.38 at the bank. This would yield a similar cash flow profile, ensuring a profit of $7.62 today. Again, as investors exploit this overpriced bond by selling, its price would drop back to $952.38.
Furthermore, even if you don't currently own the bond, you can still benefit from an overpriced bond by engaging in a short sale. This involves borrowing the bond from someone who owns it, promising to repay it later, and then selling it at the inflated price. Later, you'll need to buy back the bond or pay the owner its cash flows. This method allows you to exploit arbitrage opportunities without owning the security initially.
Determining the No-Arbitrage Price of a security involves two key steps:
- Identify the cash flows: Understand the future payments promised by the security, such as dividends, interest, or principal repayments.
- Calculate the present value (PV): Compute the present value of these future cash flows using an appropriate discount rate. This represents the cost of replicating the security's cash flows on your own.
If the market price of the security matches its present value, there's no arbitrage opportunity. However, if the market price deviates from this value, an arbitrage opportunity arises, prompting investors to exploit it. Therefore, the no-arbitrage price of a security can be expressed by the formula:
No-Arbitrage Price of a Security = Present Value of All Cash Flows Paid by the Security
Determining the interest rate from bond prices
Involves using the formula for the present value of the bond's cash flows. If we know the bond's price and the cash flow it will pay, we can solve for the interest rate.
EX: if a bond paying $1000 in one year is priced at $929.80 today, we can rearrange the formula to find the interest rate: 1000
This yields an interest rate of 7.55%. This method is commonly used to calculate interest rates in practice, where financial news services derive current interest rates from the prices of government bonds in the market.
The risk-free interest rate is essentially the percentage gain from investing in the bond, known as the bond's return. It's calculated as the difference between the final payment and the initial cost, divided by the initial cost.
In this case: Return=1000−929.80/ 929.80 =7.55%
Thus, in a market without arbitrage opportunities, the risk-free interest rate equals the return from investing in a risk-free bond. If the bond's return differs from the risk-free interest rate, arbitrage opportunities arise, driving prices towards equilibrium.
Top of Form
Bottom of Form
EX 3.6.
Problem : Consider a security that pays its owner $100 today and $100 in one year, without any risk. Suppose the risk-free interest rate is 10%. What is the no-arbitrage price of the security today (before the first $100 is paid)? If the security is trading for $195, what arbitrage opportunity is available? At what interest rate would the arbitrage opportunity disappear?
Solution : We need to compute the present value of the security’s cash flows. In this case there are two cash flows: $100 today, which is already in present value terms, and $100 in one year. The present value of the second cash flow is
$100 in one year ÷ 1.10 $ in one year $ today = $90.91 today
Therefore, the total present value of the cash flows is $100 + $90.91 = $190.91 today, which is the no-arbitrage price of the security.
If the security is trading for $195, we can exploit its overpricing by selling it for $195. We can then use $100 of the sale proceeds to replace the $100 we would have received from the security today and invest $90.91 of the sale proceeds at 10% to replace the $100 we would have received in one year. The remaining $195 − $100 − $90.91 = $4.09 is an arbitrage profit.
At a price of $195, we are effectively paying $95 to receive $100 in one year. So, an arbitrage opportunity exists unless the interest rate equals 100/95 − 1 = 5.26%.
NPV of trading securities & firm decision making
In a market where securities trade at no-arbitrage prices, the NPV of trading these securities is zero. This means that buying or selling a security doesn't create or destroy value on its own. The cost of buying a security equals the present value of its cash flows, and the benefit is the price paid for it. Similarly, when selling a security, the price received equals the present value of its future cash flows, and the cost is giving up those cash flows.
This zero-NPV result makes sense because if trading a security offered a positive NPV, it would create an arbitrage opportunity, which doesn't exist in normal markets. In competitive markets, trades occur at prices where neither party loses value, ensuring a zero NPV for all transactions.
Understanding this principle allows us to evaluate investment decisions separately from financing choices or other security transactions. It emphasizes that the creation of value comes from real investment projects, not just financial transactions. This concept is known as the Separation Principle, highlighting the distinction between investment decisions and financing decisions.
Top of Form
EX 3.7.
Problem : Your firm is considering a project that will require an up-front investment of $10 million today and will produce $12 million in cash flow for the firm in one year without risk. Rather than pay for the $10 million investment entirely using its own cash, the firm is considering raising addi- tional funds by issuing a security that will pay investors $5.5 million in one year. Suppose the risk-free interest rate is 10%. Is pursuing this project a good decision without issuing the new security? Is it a good decision with the new security?
Solution : Without the new security, the cost of the project is $10 million today and the benefit is $12 mil- lion in one year. Converting the benefit to a present value
$12 million in one year ÷ (1.10 $ in one year $ today ) = $10.91 million today
we see that the project has an NPV of $10.91 million − $10 million = $0.91 million today.
Now suppose the firm issues the new security. In a normal market, the price of this security
will be the present value of its future cash flow:
Price(Security) = $5.5 million ÷ 1.10 = $5 million today
Thus, after it raises $5 million by issuing the new security, the firm will only need to invest an ad- ditional $5 million to take the project.
To compute the project’s NPV in this case, note that in one year the firm will receive the $12 million payout of the project, but owe $5.5 million to the investors in the new security, leaving $6.5 million for the firm. This amount has a present value of
$6.5 million in one year ÷ (1.10 $ in one year $ today ) = $5.91 million today
Thus, the project has an NPV of $5.91 million − $5 million = $0.91 million today, as before.
In either case, we get the same result for the NPV. The separation principle indicates that we will get the same result for any choice of financing for the firm that occurs in a normal market. We can therefore evaluate the project without explicitly considering the different financing possibilities the firm might choose.
Valuing a portfolio
The Law of One Price extends to portfolios of securities, implying a concept known as value additivity. If a third security, C, has the same cash flows as a combination of securities A and B, then the price of security C must equal the combined price of A and B. This principle is expressed by the equation:
Value Additivity : Price(C) = Price(A + B) = Price(A) + Price(B)
In other words, the value of security C, which mirrors the cash flows of A and B combined, must be equal to the sum of the values of securities A and B. If this weren't the case, an arbitrage opportunity would arise, allowing investors to profit from discrepancies in prices until equilibrium is reached.
EX 3.8 : valuing an asset in a portfolio
Problem : Holbrook Holdings is a publicly traded company with only two assets: It owns 60% of Harry’s Hotcakes restaurant chain and an ice hockey team. Suppose the market value of Holbrook Hold- ings is $160 million, and the market value of the entire Harry’s Hotcakes chain (which is also publicly traded) is $120 million. What is the market value of the hockey team?
Solution :We can think of Holbrook as a portfolio consisting of a 60% stake in Harry’s Hotcakes and the hockey team. By value additivity, the sum of the value of the stake in Harry’s Hotcakes and the hockey team must equal the $160 million market value of Holbrook. Because the 60% stake in Harry’s Hotcakes is worth 60% × $120 million = $72 million, the hockey team has a value of $160 million − $72 million = $88 million.
Value additivity extends beyond securities to encompass entire portfolios and firms. Here's what it means:
- Portfolio Value: When you have a collection of securities forming a portfolio, the total value of that portfolio should be the sum of the values of each individual security within it. Essentially, if you were to buy each security separately, their total cost should match the cost of the portfolio as a whole. This ensures that there are no opportunities for arbitrage.
- Implications for Firm Value: This concept has significant implications for evaluating the value of an entire firm. Since a firm's cash flows are derived from all its projects and investments, the value of the firm is essentially the sum of the values of all these individual projects.
- Maximizing Firm Value: Therefore, when managers make decisions within a firm, they should focus on maximizing the net present value (NPV) of those decisions. The NPV represents the contribution of each decision to the overall value of the firm. In essence, maximizing NPV aligns with maximizing the value of the entire firm.
So, whether it's evaluating a portfolio of securities or making strategic decisions within a firm, value additivity guides us to ensure that the sum of the parts equals the whole, leading to efficient allocation of resources and maximization of value.
Chap 4 : The time value of money
In financial management, evaluating projects involves comparing costs and benefits that occur over different time periods. This requires tools to handle cash flows occurring at various points in time. One such tool is the timeline, which visually represents cash flows. Using this timeline, we establish rules for moving cash flows to different time points. This enables us to compute the present and future values of cash flows, allowing for comparison.
The net present value (NPV) is a key metric in project evaluation. It represents the net benefit of a project in terms of cash today. By converting all cash flows to a common time point, NPV helps compare the costs and benefits of long-term projects.
While these techniques are general, certain assets have cash flows following regular patterns. For such cases, we develop shortcuts to value annuities, perpetuities, and other assets with predictable cash flows. These tools enhance the efficiency of project evaluation and decision-making in financial management.
Top of Form
Bottom of Form
4.1 the timeline
Timelines are a fundamental tool for organizing and solving financial problems involving cash flows spanning multiple periods. They visually represent the timing of expected cash flows, aiding in decision-making.
Constructing a timeline involves marking specific dates and representing cash flows at those dates. The space between dates represents time periods. Each point on the timeline corresponds to a specific date, with date 0 representing the present. Cash inflows are represented as positive values, while outflows are negative.
EX: suppose you’re still feeling generous and have agreed to lend your brother $10,000 today. Your brother has agreed to repay this loan in two installments of $6000 at the end of each of the next two years. The timeline is as follows:
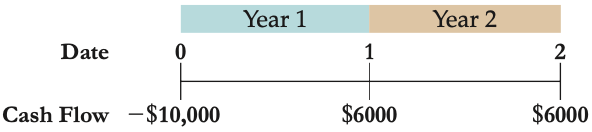
Notice that the first cash flow at date 0 (today) is represented as −$10,000 because it is an outflow. The subsequent cash flows of $6000 are positive because they are inflows.
Timelines can accommodate various time periods, such as months or years, and can represent any cash flow occurrence. They are essential for identifying all relevant cash flows in a financial decision, ensuring accurate analysis and informed decisions. Starting with simple timelines can lay a foundation for tackling more complex financial problems effectively.
EX 4.1 : Constructing a timeline Top of Form
Problem : Suppose you must pay tuition of $10,000 per year for the next two years. Your tuition payments must be made in equal installments at the start of each semester. What is the timeline of your tuition payments?
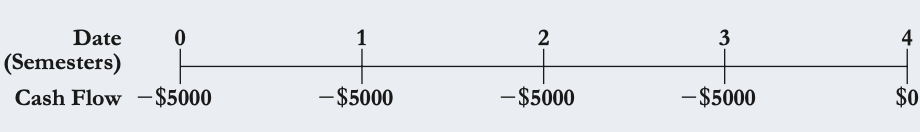 Solution : Assuming today is the start of the first semester, your first payment occurs at date 0 (today). The remaining payments occur at semester intervals. Using one semester as the period length, we can construct a timeline as follows:
4.2. the 3 rules of time travel
Financial decisions often require comparing or combining cash flows that occur at differ- ent points in time. In this section, we introduce three important rules central to financial decision making that allow us to compare or combine values.
Rule 1 : Comparing & combining values
emphasizes that values can only be compared or combined if they occur at the same point in time. This highlights the principle that cash flows must be in the same units to be meaningful for comparison or combination.
- EX: a dollar today holds more value than a dollar in the future due to the potential to earn interest.
Rule 2 : Moving cash flows forward in time
Introduces the concept of moving cash flows forward in time, known as compounding. When moving a cash flow forward, it is multiplied by an interest rate factor to account for the time value of money. This factor, (1+r), represents the rate at which the value grows over time. The process involves repeatedly compounding the cash flow for each period to determine its future value.
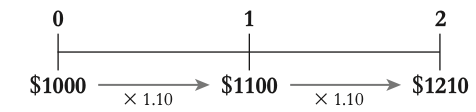 EX: if we have $1000 today and want to know its equivalent value in two years at a 10% interest rate, we compound the initial amount by (1+0.10)(1+0.10) twice to get the future value. -🡪1100 x 1.10 = 1210 in 2 years
The value obtained after moving a cash flow forward in time is known as its future value. In our example, $1210 is the future value of $1000 two years from today.
Note that the future value grows as we move the cash flow further into the future. This growth occurs because of the effect of earning "interest on interest," also known as compound interest. In our example, the value grows by $100 in the first year and by $110 in the second year.
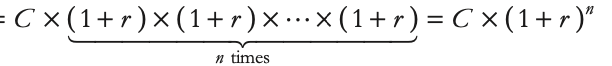 General Formula: To move a cash flow C forward n periods into the future, we compound it by the intervening interest rate factors. If the interest rate r is constant, then the future value
=
Understanding how to compound cash flows forward in time is crucial for evaluating the time value of money and making informed financial decisions.
The future value grows over time due to compound interest, which enables "interest on interest." This phenomenon leads to exponential growth, as illustrated in Figure 4.1. As time progresses, compound interest becomes increasingly significant in boosting the total future value, showcasing the power of compounding over longer periods.
EX 4.2. : the power of compounding
Problem : Suppose you invest $1000 in an account paying 10% interest per year. How much will you have in the account in 7 years? in 20 years? in 75 years?
Solution : You can apply Eq. 4.1 to calculate the future value in each case:
7 years: $1000 × ( 1.10 )7 = $1948.72
20 years: $1000 × (1.10 )20 = $6727.50
75 years: $1000 × ( 1.10 )75 = $1,271,895.37
Note that at 10% interest, your money will nearly double in 7 years. After 20 years, it will increase almost seven-fold. And if you invest for 75 years, you will be a millionaire!
Rule 3 : Moving Cash Flows Back in Time
Rule 3 of time travel in finance involves moving cash flows backward in time, a process known as discounting.
Moving Cash Flows Backward in Time: Suppose you want to determine the value today of a cash flow you expect to receive in the future, for example, $1000 in one year. If the current market interest rate is 10%, you can calculate this value : 1000 / 1.10 = $ 909.09, represents nc
Discounting: To move a cash flow backward in time, you must discount it by the interest rate factor (1+r), where r is the interest rate. This process is known as discounting.
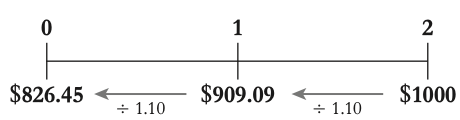 This rule can also be applied repeatedly. For example, if you anticipate receiving $1000 two years from today, you can calculate its present value by discounting it twice. At a 10% interest rate, the present value would be $826.45.
Present Value: The value obtained after moving a cash flow backward in time is known as its present value. In our example, $826.45 is the present value of $1000 received in two years.
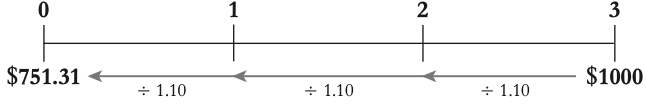 Another EX : Suppose the $1000 were three years away and you wanted to compute the present value. Again, if the interest rate is 10%, we have
That is, the present value today of a cash flow of $1000 in three years is given by
$1000 ÷ (1.10) ÷( 1.10) ÷ (1.10) = $1000÷(1.10)^3 =$751.31
 General Formula: To move a cash flow C backward n periods, you must discount it by the intervening interest rate factors. If the interest rate r is constant, then the present value PV can be calculated using the formula :
Understanding how to discount cash flows back in time is essential for evaluating the time value of money and making sound financial decisions.
EX 4.3 pesent value of a single future cash flow Top of Form
Problem : You are considering investing in a savings bond that will pay $15,000 in 10 years. If the competi- tive market interest rate is fixed at 6% per year, what is the bond worth today?
Solution : The cash flows for this bond are represented by the following timeline:
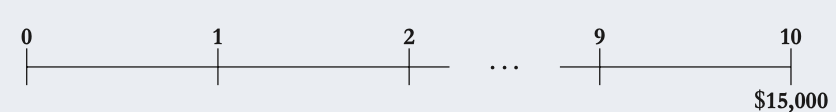
Thus, the bond is worth $15,000 in 10 years. To determine the value today, we compute the
present value:
PV = 1500 / 1.0610 = $8375.92 today
The bond is worth much less today than its final payoff because of the time value of money.
Applying the rules of time travel
 In this problem, we are tasked with determining how much we will have three years from today if we save $1000 today and $1000 at the end of each of the next two years, with a fixed 10% interest rate.
Bottom of Form
The timeline shows the three deposits we plan to make. We need to compute their value at the end of three years.
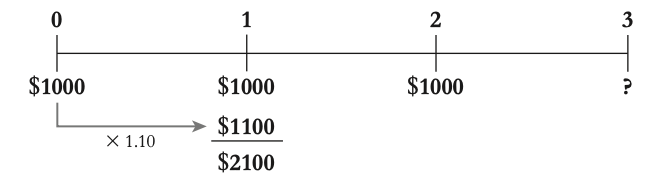 First, we can take the deposit at date 0 and move it forward to date 1. Because it is then in the same time period as the date 1 deposit, we can combine the two amounts to find out the total in the bank on date 1:
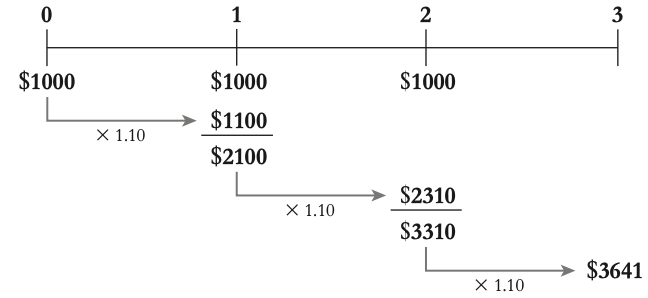 Using the first two rules of time travel, we find that our total savings on date 1 will be $2100. Continuing in this fashion, we can solve the problem as follows:
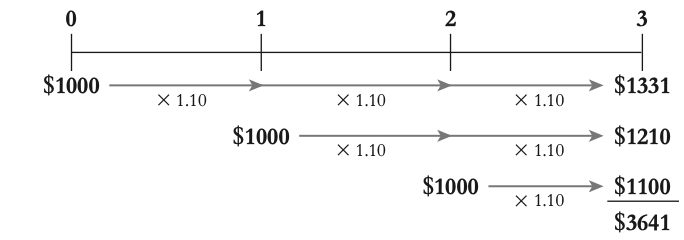 The total amount we will have in the bank at the end of three years is $3641. This amount is the future value of our $1000 savings deposits. Another approach to the problem is to compute the future value in year 3 of each cash flow separately. Once all three amounts are in year 3 dollars, we can then combine them
Next, we combine the cash flows at the end of year 3 to find the total amount we will have. We can add the future values of each cash flow:
+1000 * 1.10 * 1.10 * 1.10 = $1331 +1000 * 1.10 * 1.10 = $1210 +1000 * 1.10 = $1100
Total Future Value: Adding these amounts together, we find that the total future value at the end of year 3 is $3641.
Alternatively, we can calculate the future value of each cash flow separately and then combine them at the end of year 3:
bashCopy code
+1000 * 1.10 * 1.10 * 1.10 = $1331 +1000 * 1.10 * 1.10 = $1210 +1000 * 1.10 = $1100
Both methods yield the same result, demonstrating the flexibility of the rules of time travel. As long as we apply the rules correctly, the order of calculations does not affect the outcome. Table 4.1 summarizes the three rules of time travel and their associated formulas.
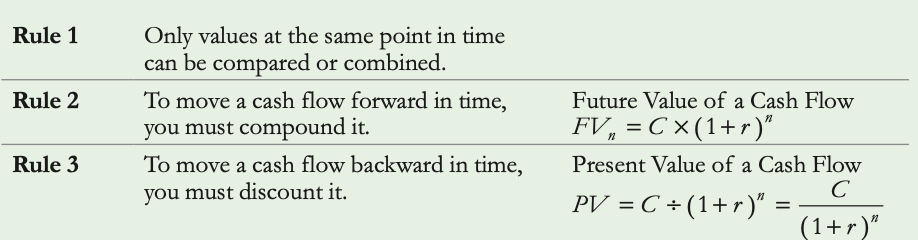

4.3. Valuing a stream of cash flows
The formula for valuing a stream of cash flows provides a systematic approach to determining the present value of a series of future cash flows. Here's a breakdown of the process:
Timeline Representation: We represent the cash flow stream on a timeline, where each cash flow Cn occurs at a different point in time, from date 0 to date N.
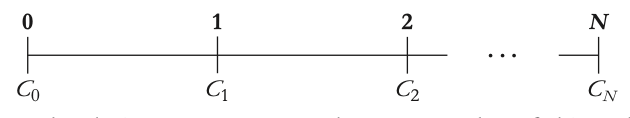
Discounting Cash Flows: Using the rules of time travel, we calculate the present value of each individual cash flow. This involves dividing each cash flow by the appropriate interest rate factor to move it back to the present. For a given interest rate r, we represent this 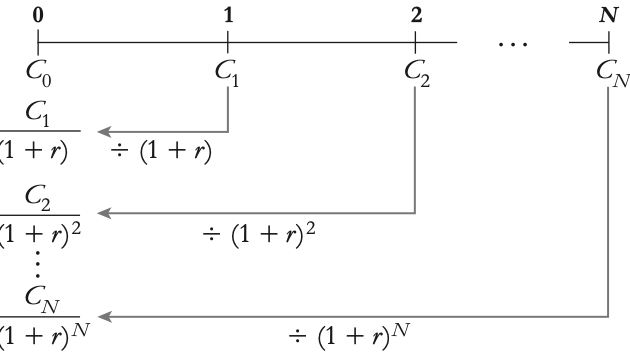 process on the timeline as follows:
Combining Present Values: Once all cash flows are converted to present values, we sum them up to find the total present value of the cash flow stream.
 The general formula for the present value of a cash flow stream is given by:
Alternatively, we can express this formula as a summation:
This formula essentially calculates the present value by summing the present values of each individual cash flow. It represents the amount you would need to invest today to generate the entire cash flow stream in the future.
EX 4.5.
Problem : You have just graduated and need money to buy a new car. Your rich Uncle Henry will lend you the money so long as you agree to pay him back within four years, and you offer to pay him the rate of interest that he would otherwise get by putting his money in a savings account. Based on your earnings and living expenses, you think you will be able to pay him $5000 in one year, and then $8000 each year for the next three years. If Uncle Henry would otherwise earn 6% per year on his savings, how much can you borrow from him?
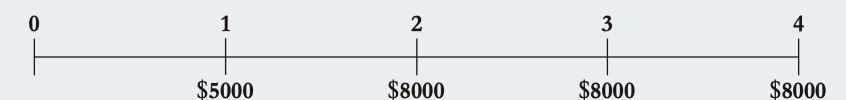 Solution :The cash flows you can promise Uncle Henry are as follows:
How much money should Uncle Henry be willing to give you today in return for your prom- ise of these payments? He should be willing to give you an amount that is equivalent to these payments in present value terms. This is the amount of money that it would take him to produce these same cash flows, which we calculate as follows:
PV =5000/ 1.06+8000/ 1.06 2 +8000/1.06 3 +8000/ 1.06 4 = 4716.98 + 7119.97 + 6716.95 + 6336.75 = 24,890.65
Thus, Uncle Henry should be willing to lend you $24,890.65 in exchange for your promised payments. This amount is less than the total you will pay him ( $5000 + $8000 + $8000 + $8000 = $29,000 ) due to the time value of money.
Let’s verify our answer. If your uncle kept his $24,890.65 in the bank today earning 6% interest, in four years he would have
FV = $24,890.65 × (1.06 )4 = $31,423.87 in four years
Now suppose that Uncle Henry gives you the money, and then deposits your payments to him in the bank each year. How much will he have four years from now?
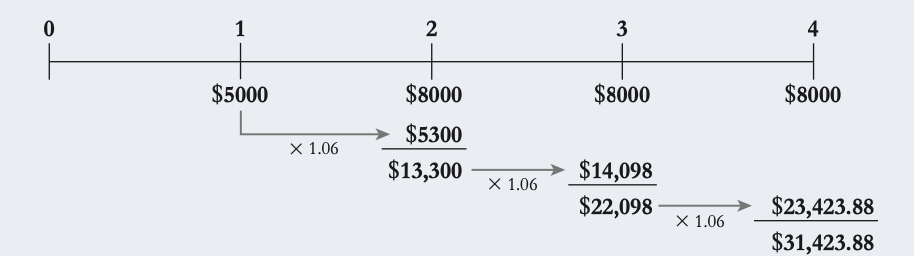 We need to compute the future value of the annual deposits. One way to do so is to compute the bank balance each year:
Future Value of a Cash Flow Stream with a Present Value of PV : FVn =PV×(1+r)n
4.4. Calculating the Net Present Value
The Net Present Value (NPV) of an investment decision is calculated by subtracting the present value of costs from the present value of benefits. In formula form:
NPV=PV(benefits)−PV(costs)NPV=PV(benefits)−PV(costs)
Here, the benefits refer to the cash inflows generated by the investment, while the costs refer to the cash outflows required to make the investment. Both benefits and costs are valued at a common point in time, typically the present.
Alternatively, we can represent any investment decision on a timeline as a cash flow stream, where investments (cash outflows) are negative cash flows and returns (cash inflows) are positive cash flows. Thus, the NPV of an investment opportunity can also be calculated as the present value of the net cash flow stream:
NPV=PV(benefits - costs)
This formula allows for a straightforward comparison of the total present value of benefits against the total present value of costs, enabling decision-makers to evaluate the profitability and feasibility of long-term investment decisions.
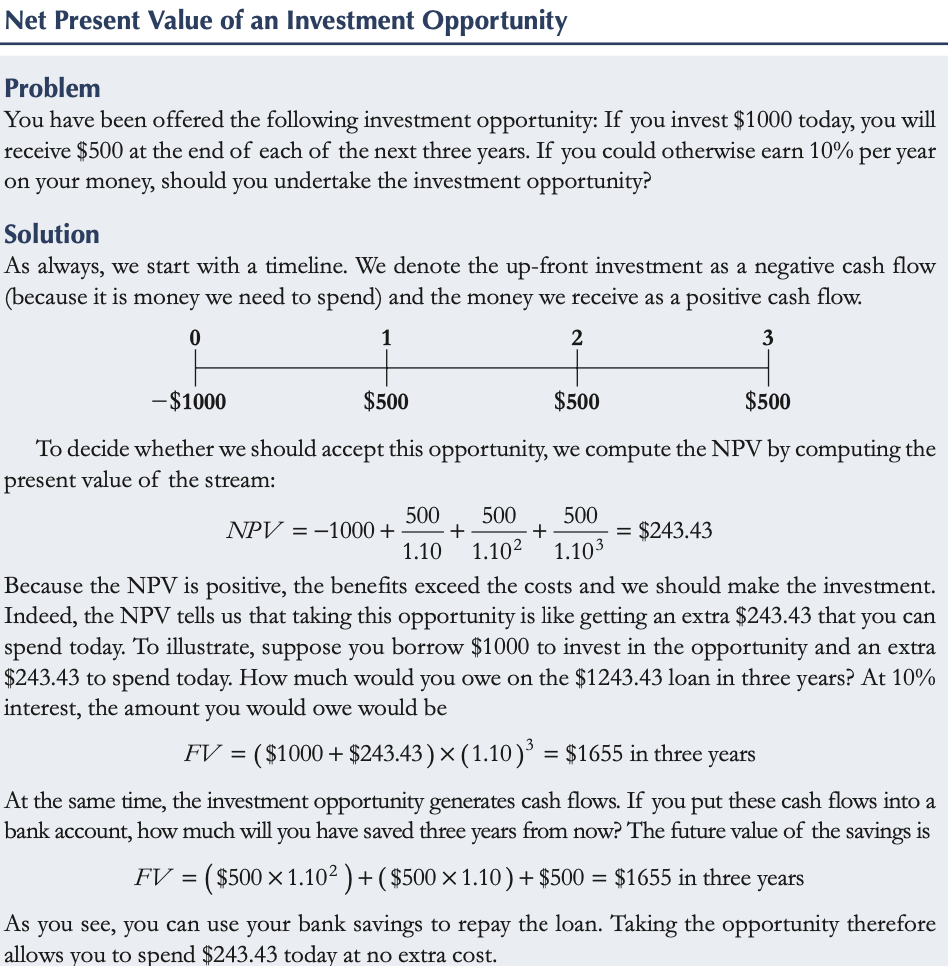 Top of Form
Bottom of Form
4.5. Perpetuities & Annuities
Perpetuities
Perpetuities are streams of equal cash flows that occur at regular intervals and last forever.
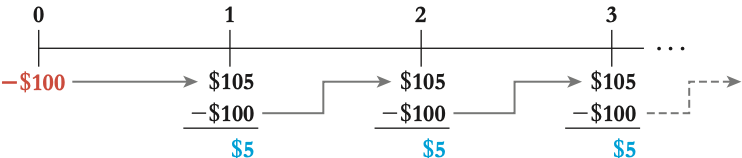 EX : suppose you could invest $100 in a bank account paying 5% inter- est per year forever. At the end of one year, you will have $105 in the bank—your original $100 plus $5 in interest. Suppose you withdraw the $5 interest and reinvest the $100 for a sec- ond year. Again you will have $105 after one year, and you can withdraw $5 and reinvest $100 for another year. By doing this year after year, you can withdraw $5 every year in perpetuity .
By investing $100 in the bank today, you can, in effect, create a perpetuity paying $5 per year. The Law of One Price tells us that the same good must have the same price in every market. Because the bank will “sell” us (allow us to create) the perpetuity for $100, the present value of the $5 per year in perpetuity is this “do-it-yourself ” cost of $100.
To calculate the present value of a perpetuity with a payment of C and an interest rate of r, we use the formula: PV=C/r
In other words, by depositing the amount rC today, we can withdraw interest of C each period indefinitely. This is because the cash flow for a perpetuity is constant, and the present value represents the cost of creating those cash flows at the bank.
This approach allows us to determine the present value of a perpetuity without summing an infinite number of terms, making it simpler and faster.
EX 4.7Top of Form
 Problem : You want to endow an annual MBA graduation party at your alma mater. You want the event to be a memorable one, so you budget $30,000 per year forever for the party. If the university earns 8% per year on its investments, and if the first party is in one year’s time, how much will you need to donate to endow the party?
Solution : This is a standard perpetuity of $30,000 per year. The funding you would need to give the university in perpetuity is the present value of this cash flow stream. From the formula,
PV = C/ r = $30,000 /0.08 = $375,000 today
If you donate $375,000 today, and if the university invests it at 8% per year forever, then the MBAs will have $30,000 every year for their graduation party.Bottom of Form
Annuities
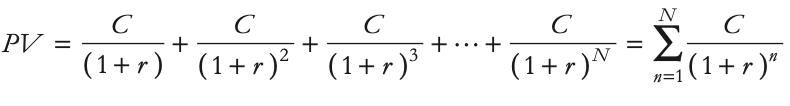 The present value of an annuity, which is a stream of �N equal cash flows paid at regular intervals, can be calculated using the formula:
Where:
- ��PV is the present value of the annuity.
- �C is the amount of each cash flow (the periodic payment).
- �r is the interest rate per period.
- �N is the number of periods.
This formula represents the total present value of all cash flows in the annuity, considering both the periodic payments and the return of the initial investment at the end of the annuity period.
To illustrate, let's say you invest $100 in a bank account paying 5% interest per year. After one year, you'll have $105 in the bank. By withdrawing the $5 interest and reinvesting the $100 for a second year, you can create a 20-year annuity of $5 per year, plus you'll receive an extra $100 at the end of 20 years.
By the Law of One Price, because it took an initial investment of $100 to create the cash flows on the timeline, the present value of these cash flows is $100. Rearranging terms using the formula above, we can compute the present value of the annuity:
��(20-year annuity of $5 per year)=$100−��($100 in 20 years)=$100−$100(1.05)20=$62.31PV(20-year annuity of $5 per year)=$100−PV($100 in 20 years)=$100−(1.05)20$100=$62.31
So the present value of $5 for 20 years is $62.31. This illustrates that the present value of an annuity is the initial investment in the bank account minus the present value of the principal that will be left in the account after the annuity period.
Top of Form
Bottom of Form
Chapter 5: Interest Rates
Interest rates can also vary due to risk or tax consequences: the US government is able to borrow at a lower interest rate than Johnson & Johnson, which in turn can borrow at a lower rate than American Airlines.
Because interest rates tend to change over time, investors will demand different interest rates for different investment horizons based on their expectations.
5.1 Interest Rate Quotes and Adjustments
Interest rates are quoted in a variety of ways. While generally stated as an annual rate, the interest payments themselves may occur at different intervals, such as monthly or semi-annually. When evaluating cash flows, however, we must use a discount rate that matches the time period of our cash flows; this discount rate should reflect the actual return we would earn over that time period.
The Effective Annual Rate
*Effective annual rate (EAR)= the total amount of interest that will be earned at the end of one year.
Adjusting the Discount Rate to Different Time Periods
Periods shorter than one year🡪 raise the interest rate fact (1+r) to the appropriate fractional power. Ex.: half year= six months.
General Equation for Discount Rate Period Conversion
We can convert a discount rate of r for one period to an equivalent discount rate for n periods:
![]() (1)
(1)
🡪 n can be larger than 1 (to compute a rate over more than one period) or smaller than 1 (to compute a rate over a fraction of a period). When computing present or future values, it is convenient to adjust the discount rate to match the time period of the cash flows. This adjustment is necessary to apply the perpetuity or annuity formulas.
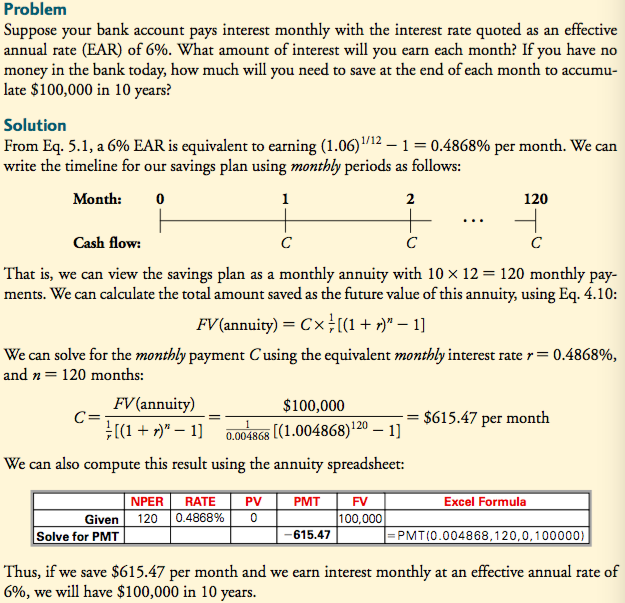
#Common mistake: using the wrong discount rate in the annuity formula
The discount rate period must match the periodicity of the cash flows in the annuity formula. Ex. Above: because the cash flows were monthly, we first must convert the EAR into a monthly discount rate. If we use 10% and then divided but 12🡪 we get a higher amount than we need. The reason we can save less is that by depositing the cash monthly rather than at the end of each year, we will earn interest on our deposits throughout the year.
Annual Percentage Rates
Bank also quote interest rates in terms of an annual percentage rate.
*Annual percentage rate (APR)= indicates the amount of interest earned in one year without the effect of compounding. // the amount of simple interest earned in one year.
Since it does not include the effect of compounding, the APR quote is typically less than the actual amount of interest that you will earn. To compute the actual amount that you will earn in one year, we must first convert the APR to an effective annual rate.
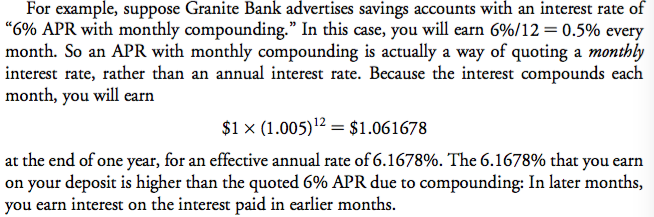
!!!APR does not reflect the true amount you will earn over one year, we cannot use the APR itself as a discount rate. Instead, the APR with k compounding periods is a way of quoting the actual interest earned each compounding period:
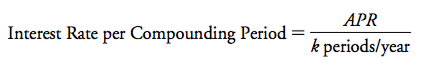 (2)
(2)
The effective annual rate corresponding to an APR with k compounding periods per year:
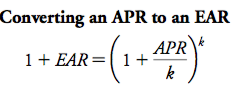
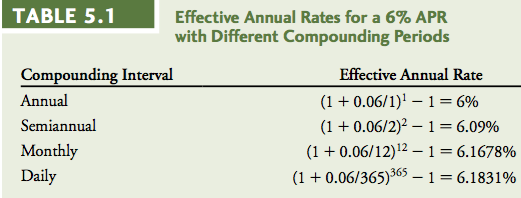
Investments can compound even more frequently than daily. In principle, the compounding interval could be hourly or every second.
*Continuous compounding= the compounding of interest every instant (an infinite number of times per year).
As a practical matter, compounding more frequently than daily has a negligible impact on the effective annual rate and is rarely observed.
When working with APRs we must:
- Divide the APR by the number of compounding periods per year to determine the actual interest rate per compounding period (2).
Then, if the cash flows occur at a different interval than the compounding period,
- Compute the appropriate discount rate be compounding (1).
Once these steps are completed, the discount rate can be used to evaluate the PV and FV of a set of cash flows.
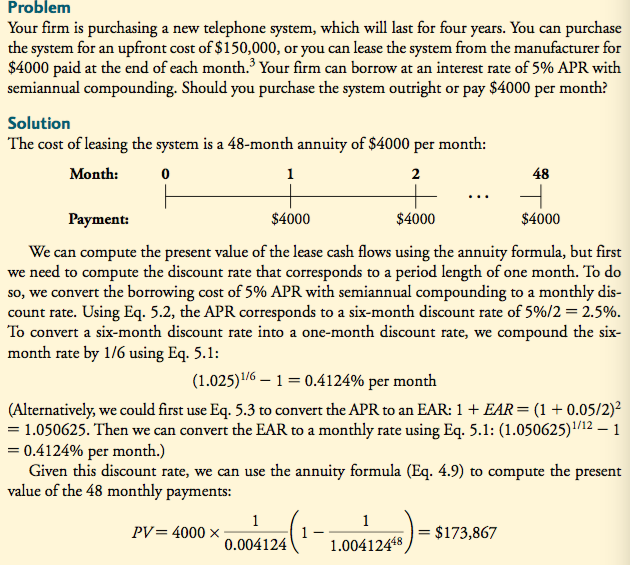
5.2 Application: Discount Rates and Loans
2 common financial problems: calculating a loan payment and calculating the remaining balance on a loan.
Computing Loan Payments
To calculate a loan payment, we equate the outstanding loan balance with the PV of the loan payments using the discount rate from the quoted interest rate of the loan, and then solve for the loan payment.
*Amortizing loans= a loan on which the borrower makes monthly payments that include interest on the loan plus some part of the loan balance. Ex.: mortgages and car loans.
Usually, each monthly payment is the same, and the loan is fully repaid with the final payment. Typical terms for a new car loan might be “6.75% APR for 60 months”. When the compounding interval for the APR is not stated explicitly, it is equal to the interval b/w the payments, or one month in this case. Thus, this quote means that the loan will be repaid with 60 equal monthly payments, computed using a 6.75% APR with monthly compounding.
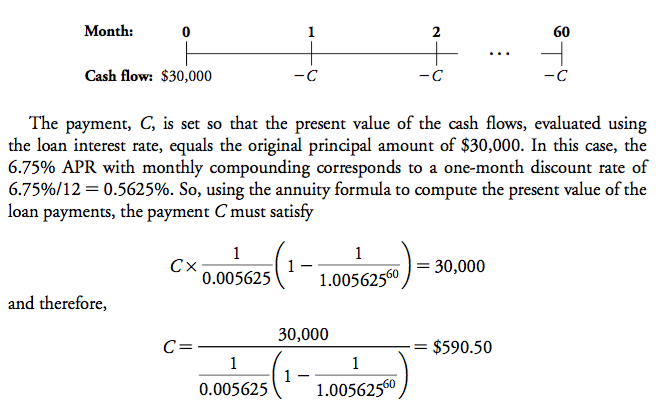
Computing the Outstanding Loan Balance
Outstanding balance on a loan= the outstanding principal, is equal to the PV of the remaining future loan payments, again evaluated using the loan interest rate.
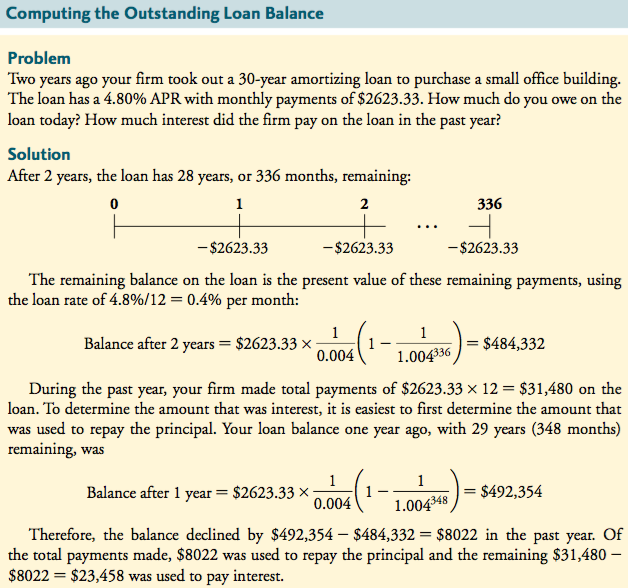
5.3 The Determinants of Interest Rates
Interest rates are determined in the market based on individuals’ willingness to borrow and lend. Factors that may influence interest rates: inflation, government policy, and expectations of future growth
#Global financial crisis: teaser rates and subprime loans
*Adjustable rate mortgages (ARMs)= mortgages with interest rates that are not constant over the life of the mortgage. These were the most common type of “subprime” loans.
When the interest rate on such a loan changes, the loan payments are recalculated based on the loan’s current outstanding balance, the new interest rate, and the remaining life of the loan.
Adjustable rate mortgages were the most common type of so-called “subprime” loans made to homebuyers with poor credit histories. These loans often featured low initial rates, aptly named teaser rates. After a short period ‘often 2 to 5 years) the interest rate would jump to a higher rate, implying that the monthly payment would also jump.
While the loan might have been affordable at the initial teaser rate, many subprime borrowers could not afford the higher payments that were required after the loan rate adjusted. Prior to 2007, while interest rates remained low and home price were high (and increasing), such borrowers were able to avoid default simply by refinancing their loans into new loans that also featured low initial teaser rates. In this way, they were able to keep their payments low. But as mortgage rates increased and housing prices began to decline in 2007, this strategy for keeping their loan payments low was no longer possible. In many cases the outstanding loan balance exceeded the market value of the home, making lenders unwilling to refinance the loans. Stuck with a loan at a now unaffordable interest rate, many homeowners defaulted, and the rate of foreclosure on subprime loans skyrocketed.
To prevent future lenders from using teaser rates to get borrowers into loans they might not ultimately be able to afford, the Dodd-Frank Act requires lenders to verify that borrowers have sufficient income to repay their loans even after the teaser rate expires.
*foreclosure: saisie
Inflation and Real Versus Nominal Rates
*Nominal interest rate= interest rate quoted by banks and other financial institutions that indicates the rate at which money will grow if invested for a certain period of time.
Of course, if prices in the economy are also growing due to inflation, the nominal interest rate does not represent the increase in purchasing power that will result from investing.
*Real interest rate (rr)= the rate of growth of purchasing power after adjusting for inflation.
r= nominal interest rate and i= the rate of inflation:
The real interest rate, together with a convenient approximation for the real interest rate when inflation rates are low:
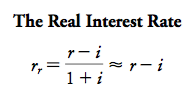
The real interest rate is approximately= the nominal interest rate less the rate of inflation.
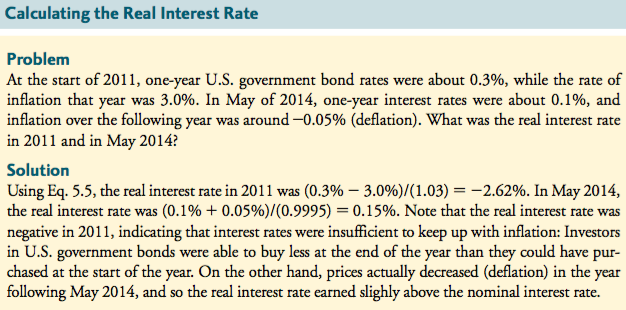
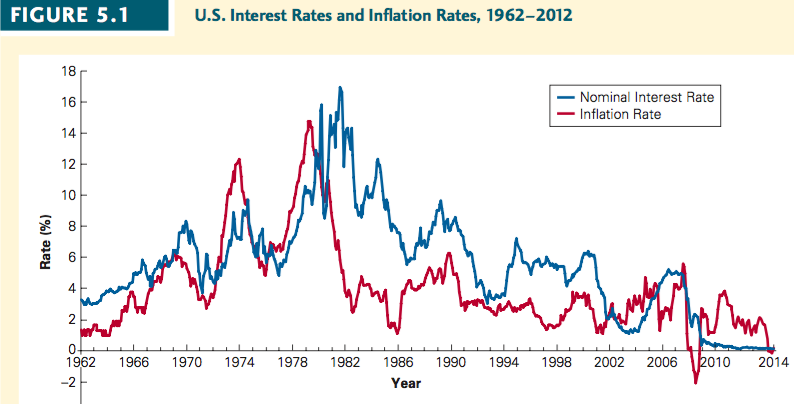
🡪 the nominal interest rate tends to move with inflation. Intuitively, individuals’ willingness to save will depend on the growth in purchasing power they can expect (given by the real interest rate). Thus, when the inflation rate is high, a higher nominal interest rate is generally needed to induce individuals to save. The last few years have been somewhat exceptional: nominal interest rates have been extremely low, leading to negative real interest rates.
Investment and Interest Rate Policy
Interest rates also affect firms’ incentive to raise capital and invest. 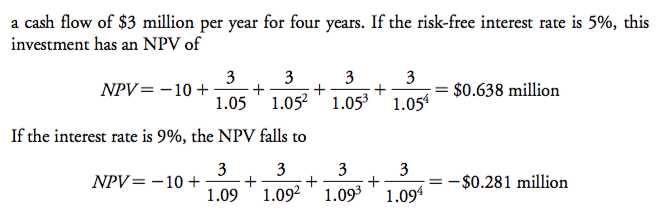
🡪 the investment is no longer profitable. Since we are discounting the positive cash flows at a higher rate, which reduces their present value. The cost of $10 million occurs today (=upfront investment), however, so its present value is independent of the discount rate.
More generally, when the costs of an investment precede the benefits, an increase in the interest rate will decrease the investment’s NPV. All else equal, higher interest rates will therefore tend to shrink the set of positive-NPV investments available to firms. The Federal Reserve in the United States and central banks in other countries use this relation- ship between interest rates and investment to try to guide the economy. They can raise interest rates to reduce investment if the economy is “overheating” and inflation is on the rise, and they can lower interest rates to stimulate investment if the economy is slowing or in recession.
Monetary Policy, Deflation, and the 2008 Financial Crisis
🡪When the 2008 financial crisis struck the economy, the U.S. Federal Reserve responded quickly to mitigate its impact on the broader economy by cutting its short-term interest rate target to 0% by year’s end. But while this use of monetary policy is generally quite effective, because consumer prices were falling in late 2008, the inflation rate was negative, and so even with a 0% nominal interest rate the real interest rate remained positive initially. The consequence of this deflation, and the risk that it might continue, meant that the Federal Reserve was “out of ammunition” with regard to its usual weapon against an economic slowdown—it could not lower rates further. This problem was one of the reasons the U.S. and other governments began to consider other measures, such as increased government spending and investment, to stimulate their economies.
*ammunition: munition
The Yield Curve and Discount Rates
The interest rates that banks offer on investments or charge on loans depend on the horizon, or term, of the investment or loan.
*Term structure (of interest rates) = the relationship b/w the investment term and the interest rate.
*Yield curve= a plot of bond yields as a function of the bonds’ maturity date. // plot the term structure.
We can use the term structure to compute the present and future values of a risk-free cash flow over different investment horizons.
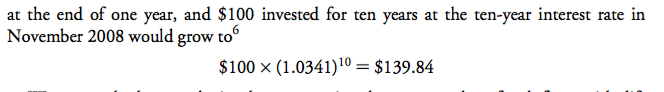
Cn= risk-free cash flow received in n years, rn= the risk-free interest rate (expressed as an EAR) for an n-year terms. When computing a PV, we must match the term of the cash flow and term of the discount rate.
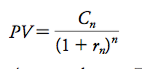
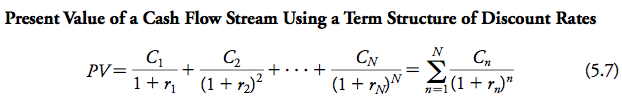
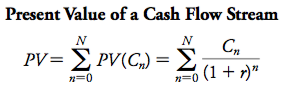 (chapter 4)
🡪 the difference: here, we use a different discount rate for each cash flow, based on the rate from the yield curve with the same term. When the yield curve is relatively flat, this distinction is relatively minor and is often ignored by discounting using a single “average” interest rate r. But when short-term and long-term interest rates vary widely, Eq. 5.7 should be used.
Warning: all of our shortcuts for computing PV (annuity and perpetuity formulas, the annuity spreadsheet) are based on discounting all of the cash flows at the same rate. They cannot be used in situations in which cash flows need to be discounted at different rates.
![]()
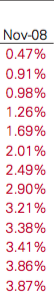
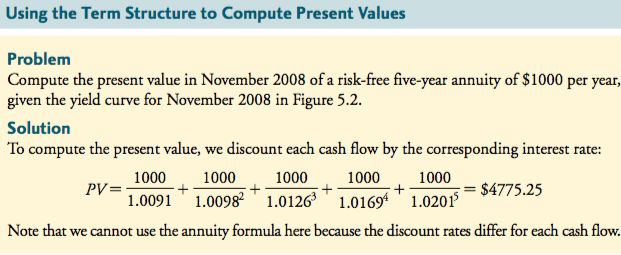
The Yield Curve and the Economy
Interest Rate Determination
The Federal Reserve determines very short-term interest rates through its influence on the federal funds rate.
*Federal funds rate= The Federal funds rate is like the interest rate banks charge each other when they need to borrow money overnight. It's set by the Federal Reserve, the central bank of the United States, as part of its monetary policy. This rate affects other interest rates in the market.
Imagine banks as friends who sometimes need to borrow money from each other to meet certain rules. The Federal funds rate is the interest rate they agree upon for these short-term loans.
Other interest rates, like those you see on a graph called the yield curve, are determined by the market. These rates are adjusted until the amount of money people want to lend matches the amount others want to borrow, at different time periods.
Investors' expectations about future interest rate changes also play a big role. If they think rates will go up, they might be less willing to lend or borrow for longer periods, which can affect how the yield curve looks.
#Common mistake: using the annuity formula when discount rates vary by maturity
Interest Rate Expectations
Suppose short-term interest rates are equal to long-term interest rates. If investors expect interest rates to rise in the future, they would not want to make long-term investments. Instead, they could do better by investing on a short-term basis and then reinvesting after interest rates rose. Thus, if interest rates are expected to rise, long-term interest rates will tend to be higher than short-term rates to attract investors.
Similarly, if interest rates are expected to fall in the future, then borrowers would not wish to borrow at long-term rates that are equal to short-term rates. They would do better by borrowing on a short-term basis, and then taking out a new loan after rates fall. So, if interest rates are expected to fall, long-term rates will tend to be lower than short-term rates to attract borrowers.
These arguments imply that the shape of the yield curve will be strongly influenced by interest rate expectations. A sharply increasing (steep) yield curve, with long-term rates much higher than short-term rates, generally indicates that interest rates are expected to rise in the future. A decreasing (inverted) yield curve, with long-term rates lower than short-term rates, generally signals an expected decline in future interest rates.
Because interest rates tend to drop in response to a slowdown in the economy, an inverted yield curve is often interpreted as a negative forecast for economic growth. Conversely, the yield curve tends to be steep as the economy comes out of a recession and interest rates are expected to rise.
Clearly, the yield curve provides extremely important information for a business manager. In addition to specifying the discount rates for risk-free cash flows that occur at different horizons, it is also a potential leading indicator of future economic growth.
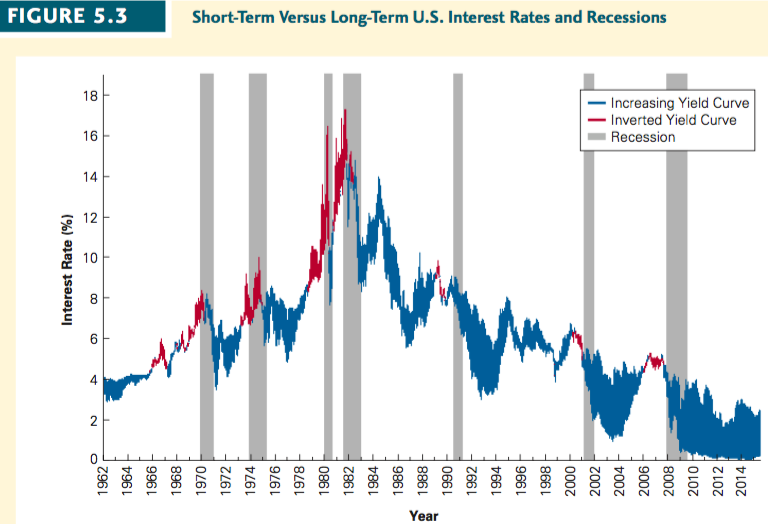
#Interview with Kevin M. Warsh: Federal Reserve governor (2006-2011), serving as chief liaison to the financial markets.
Main policy instruments used by central banks to control the economy: price stability, maximum sustainable employment, and financial stability. Lowering the federal funds short-term interest rate, the primary policy instrument, stimulates the economy. Raising the federal funds rate generally slows the economy. Buying and selling short-term U.S. Treasury securities through open market operations is standard practice.
Factors limit the effectiveness of Fed policy: monetary policy does not act in isolation. Fiscal (taxing and spending), trade, and regulatory policies have huge consequence on the state of economic and financial conditions. In the short term, monetary policy can help buy time for an economy to improve, but it cannot cure structural failings of an economy in isolation or compensate for the country’s growing indebtedness.
One effective, innovative tool, the Term Auction Facility (TAF), stimulated the economy by providing cheap and readily available term funding to banks, large and small, on the front lines of the economy, thus encouraging them to extend credit to businesses and consumers. 2 Quantitative Easing (QE) programs- special purchases of government and agency securities- to increase money supply, promote lending, and according to some proponents, increase prices of riskier assets.
Central bank liquidity swap lines. Euros for dollars or another currency and agreeing to reverse the swap at a later date. The Fed does not take exchange rate risk, but it is subject to the credit risk of its central bank counterparty.
ECB= European Central Bank
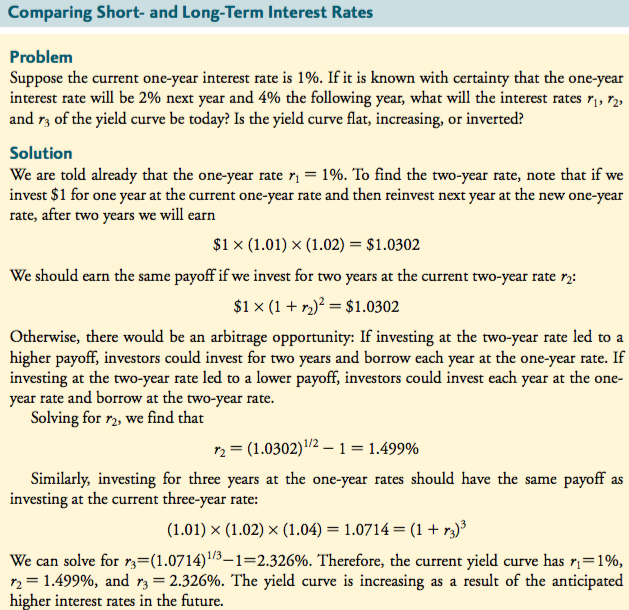
5.4 Risk and Taxes
🡪 2 other factors that are important when evaluating interest rates: risk and taxes
Risk and Interest Rates
Recall: interest rates vary with the investment horizon. Interest rates also vary based on the identity of the borrower.
The lowest interest rate is the rate paid on US Treasury notes. US Treasury securities are widely regarded to be risk free because there is virtually no chance the government will fail to pay the interest and default on these loans🡪 risk-free interest rate, we mean the rate on US Treasuries.
All other borrowers have some risk of default. For these loans, the stated interest rate is the maximum amount that investors will receive. Investors may receive less if the company has financial difficulties and is unable to fully repay the loan. To compensate for the risk that they will receive less if the firm defaults, investors demand a higher interest rate than the rate on US Treasuries. The difference b/w the interest rate of the loan and the Treasury rate will depend on investors’ assessment of the likelihood that the firm will default.
When discounting future cash flows, it is important to use a discount rate that matches both the horizon and the risk of the cash flows. The right discount rate for a cash flow is the rate of return available in the market on other investments of comparable risk and term.
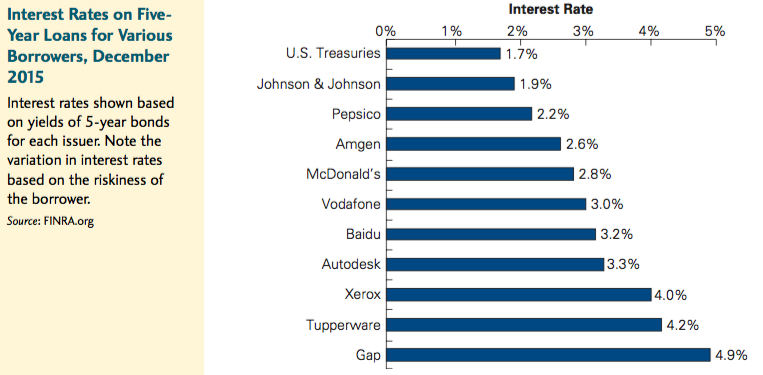
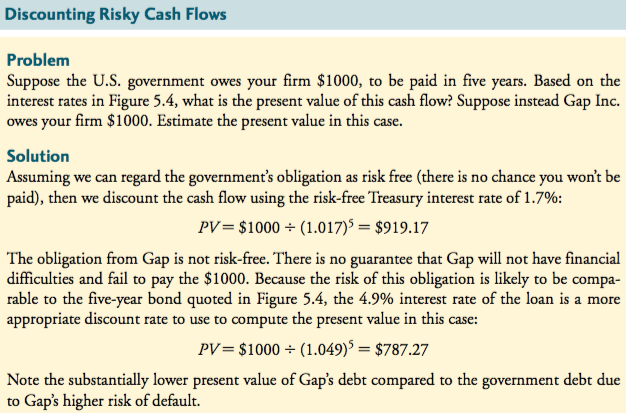
After-Tax Interest Rates
If the cash flows from an investment are taxed, the investor’s actual cash flow will be reduced by the amount of the tax payments. Here, we consider the effect of taxes on the interest earned on savings (or paid on borrowing). Taxes reduce the amount of interest the investor can keep.
*After-tax interest rate= reflects the amount of interest an investor can keep after taxes have been deducted.
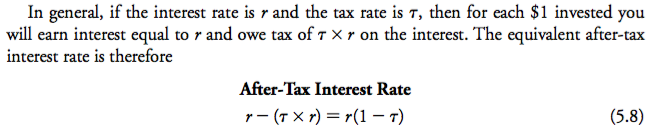
🡪 the same calculation can be applied to loans. In some cases, the interest on loans is tax deductible. In that case, the cost of paying interest on the loan is offset by the benefit of the tax deduction. The net effect is that when interest on a loan is tax deductible, the effective after-tax interest rate is ![]() . In other words, the ability to deduct the interest expense lowers the effective after-tax interest rate paid on the loan.
. In other words, the ability to deduct the interest expense lowers the effective after-tax interest rate paid on the loan.
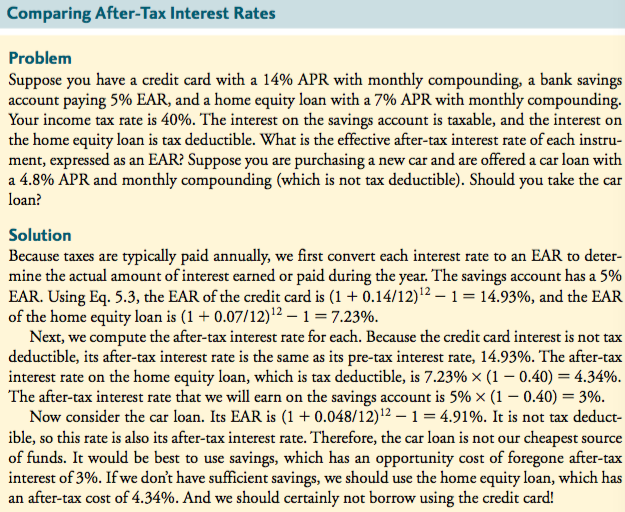
5.5 The Opportunity Cost of Capital
The interest rates we observe in the market will vary based on quoting conventions, the term of the investment, and risk. The actual return kept by an investor will also depend on how the interest is taxed.
Chap. 3: the market interest rate provides the exchange rate that we need to compute present values and evaluate an investment opportunity. But with so many interest rates to choose from, the term market interest rate is inherently ambiguous. Therefore, going forward, we will base the discount rate that we use to evaluate cash flows on the investor’s opportunity cost of capital (cost of capital).
*Opportunity cost of capital or the cost of capital= the best available expected return offered in the market on an investment of comparable risk and term to the cash flow being discounted; the return the investor forgoes on an alternative investment of equivalent riskiness and term when the investor takes on a new investment.
The cost of capital is clearly relevant for a firm seeking to raise capital from outside investors. In order to attract funds, the firm must offer an expected return comparable to what investors could earn elsewhere with the same risk and horizon. The same logic applies when a firm considers a project it can fund internally. Because any funds invested in a new project could be returned to shareholders to invest elsewhere, the new project should be taken only if it offers a better return than shareholders’ other opportunities.
Thus, the opportunity cost of capital provides the benchmark against which the cash flows of the new investment should be evaluated. Treasury securities with a similar term. The cost of capital for risky projects will often exceed this amount, depending on the nature and magnitude of the risk.
Chapter 6: Valuing Bonds
Understanding bonds and their pricing is useful for several reasons.
- The prices of risk-free government bonds can be used to determine the risk-free interest rates that produce the yield curve. Chap.5: yield curve provides important information for valuing risk-free cash flows and assessing expectations of inflation and economic growth.
- Firms often issue bonds to fund their own investments, and the returns investors receive on those bonds is one factor determining a firm’s cost of capital.
- Bonds provide an opportunity to begin our study how securities are priced in a competitive market.
🡪bonds and loans are both debts. A bond is a type of a loan which is used by big corporations or governments to raise capital by selling IOUs (Investor Owned Utilities) to the general public. Loans are a type of debt in which a lender lends the money and a borrower borrows the money.
6.1 Bond Cash Flows, Prices, and Yields
*yield: rendement
Bond Terminology
Chap. 3: a bond is a security sold by governments and corporations to raise money from investors today in exchange for promised future payments.
*Bond certificate states the terms of a bond as well as the amounts and dates of all payments to be made.
*Maturity date= the final repayment date of a bond.
*Term= time remaining until the final repayment date of a bond.
Bonds typically make two types of payments to their holders.
*Coupons= the promised interest payments of a bond.
The bond certificate typically specifies that the coupons will be paid periodically (ex.: semi-annually) until the maturity date of the bond.
*Face value or principal amount or par value= the notional amount of a bond used to compute its interest payments. The face value of the bond is generally due at the bond’s maturity. //Usually, the face is repaid at maturity.
A bond with a $1000 face value🡪 $1000 bond.
*Coupon rate determines the amount of each coupon payment of a bond. The coupon rate, expressed as an APR (annual % rate), is set by the issuer and stated on the bond certificate.
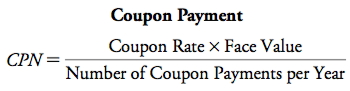
Each coupon payment (CPN)
Zero-Coupon Bonds
Simplest type of bond= zero-coupon bond.
*Zero-coupon bond or pure discount bonds= a bond that makes only one payment at maturity. // does not make coupon payments. The only cash payment the investor receives is the face value of the bond on the maturity date.
*Treasury bills= zero-coupon bonds, issued by the US government, with a maturity of up to one year.
Chap. 4: the PV of a future cash flow is less than the cash flow itself. As a result, prior to its maturity date, the price of a zero-coupon bond is less than its face value. That is, zero-coupon bonds trade at a discount (a price lower than the face value), so they are also called pure discount bonds.
*Discount= the amount by which a cash flow exceeds its present value. The process of converting a cash flow to its present value.
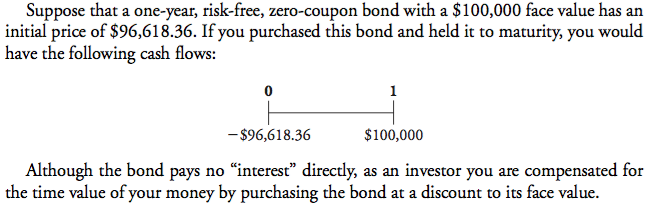
Yield to Maturity
Recall: IRR of an investment opportunity is the discount rate at which the NPV of the cash flows of the investment opportunity is equal to zero. So, the IRR of an investment in a zero-coupon bond is the rate of return that investors will earn on their money if they buy the bond at its current price and hold it to maturity.
*Yield to maturity (YTM)= the discount rate that sets the present value of the promised bond payments equal to the current market price of the bond. Equivalently, it is the IRR of an investment in a bond that is held to maturity and does not default.
The anticipated return if she holds the bound until it matures. (Investopedia).
The YTM for a zero-coupon bond is the return you will earn as an investor from holding the bond to maturity and receiving the promised face value payment.
The bond is risk free.
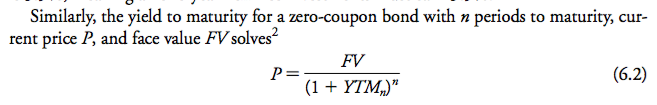
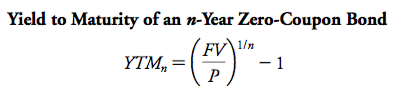
YTM= the per-period rate of return for holding the bond from today until maturity on date n.
Risk-Free Interest Rates
Competitive market interest rate rn available from today until date n for risk-free cash flows; we used this interest rate as the cost capital for a risk-free cash flow that occurs on date n. Because a default-free zero-coupon bond that matures on date n provides a risk-free return over the same period, the Law of One Price guarantees that the risk-free interest rate equals the yield to maturity on such a bond.
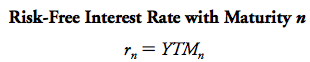
Consequently, we will often refer to the YTM of the appropriate maturity, zero-coupon risk-free bond as the risk-free interest rate.
*Spot interest rates= default-free, zero-coupon yields.
* Taux d'intérêt ponctuel = rendement par défaut, taux de coupon zéro.
Chap.5 : the yield curve, which plots the risk-free interest rate for different maturities. These risk-free interest rates correspond to the yields of risk-free zero-coupon bonds.
*Zero-coupon yield curve (chap.5) = a plot of the yield of risk-free zero-coupon bonds (STRIPS) as a function of the bond’s maturity date.
*STRIPS= Separate Trading of Registered Interest and Principal of Securities.
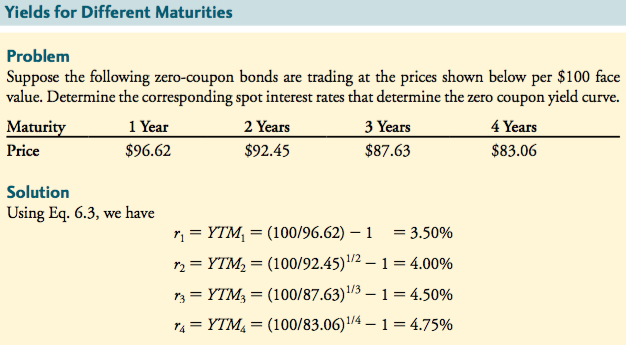
#Global financial crisis: negative bon yields
*midst: milieu
Midst 2008: US Treasury Bills traded at a negative yield (first time since the Great Depression). That is, these risk-free pure discount bonds traded at premium.
A negative yield on a Treasury bill implies that investors have an arbitrage opportunity: by selling the bill, and holding the proceeds in cash, they would have a risk-free profit of $25.56. Obtaining, storing, and securing large quantities of cash would also be very costs. Bonds are also much easier to trade, and use as collateral, than giant vaults.
Coupon Bonds
*Coupon bonds= bonds that pay regular coupon interest payments up to maturity, when the face value is also paid.
Like zero-coupon bonds, coupon bonds pay investors their face value at maturity. In addition, these bonds make regular coupon interest payments. 2 types of US Treasury coupon securities are currently traded in financial markets: Treasury notes and Treasury bonds.
*Treasury notes= a type of US Treasury coupon securities, currently traded in financial markets, with original maturities from one to 10 years.
*Treasury bonds= a type of US Treasury coupon securities, currently traded in financial markets, with original maturities of more than 10 years.
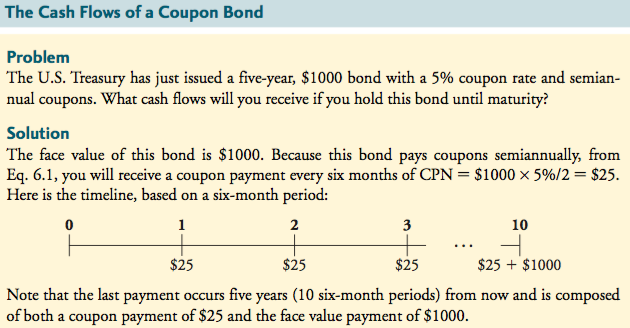
the YTM of a coupon bond can also be calculated. Recall: that the YTM for a bond is the IRR of investing in the bound and holding it to maturity; it is the single discount rate that equates the PV of the bond’s remaining cash flows to its current price.
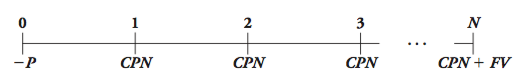
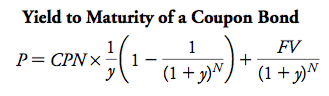
Unfortunately, unlike in the case of zero-coupon bonds, there is no simple formula to solve for the YTM directly. Instead, we use either trial-and-error or the annuity spreadsheet.
🡪 calculate a bond’s yield to maturity by solving (eq. above), the yield we compute will be a rate per coupon interval.
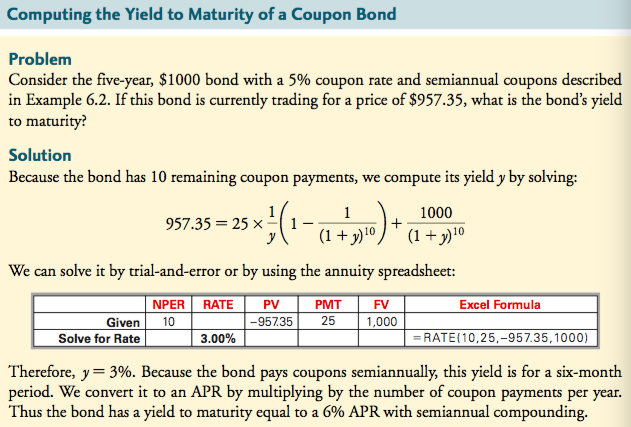
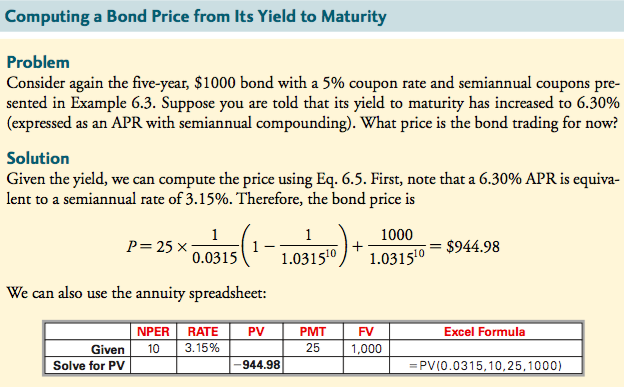
Since we can convert any price into a yield, and vice versa, prices and yields are often used interchangeably. Indeed, bond traders generally quote bond yields rather than bond prices. One advantage of quoting the yield to maturity rather than the price is that the yield is independent of the face value of the bond. When prices are quoted in the bond market, they are conventionally quoted as a % of their face value. Ex.: a price= 94.498 which imply an actual price of $944.98 given the $1000 face value of the bond. Why?
6.2 Dynamic Behaviour of Bond Prices
Recall: zero-coupon bonds trade at a discount- that is, prior to maturity, their price is less than their face value. Coupon bonds may trade at a discount, at a premium (a price greater than their face value), or at par (a price equal to their face value).
*Premium= a price at which coupon bonds trade that is greater than their face value. Also, the price a firm pays to purchase insurance, allowing the firm to exchange a random future loss for a certain upfront expense.
*Par=a price at which coupon bonds trade that is equal to their face value.
Discounts and Premiums
If the bond trades at a discount, an investor who buys the bond will earn a return both from receiving the coupons and from receiving a face value that exceeds the price paid for the bond. As a result, if a bond trades at a discount, its yield to maturity will exceed its coupon rate. Given the relationship between bond prices and yields, the reverse is clearly also true: If a coupon bond’s yield to maturity exceeds its coupon rate, the present value of its cash flows at the yield to maturity will be less than its face value, and the bond will trade at a discount.
A bond that pays a coupon can also trade at a premium to its face value. In this case, an investor’s return form the coupons is diminished by receiving a face value less than the price paid for the bond. Thus, a bond trades at a premium whenever its YTM is less than its coupon rate.
When a bond trades at a price equal to its face value, it is sais to trade at par. A bond trades at par when its coupon rate is equal to its YTM. A bond that trades at a discount is also said to trade below par, and a bond that trades at a premium is said to trade above par.
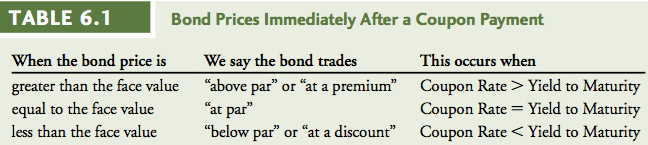
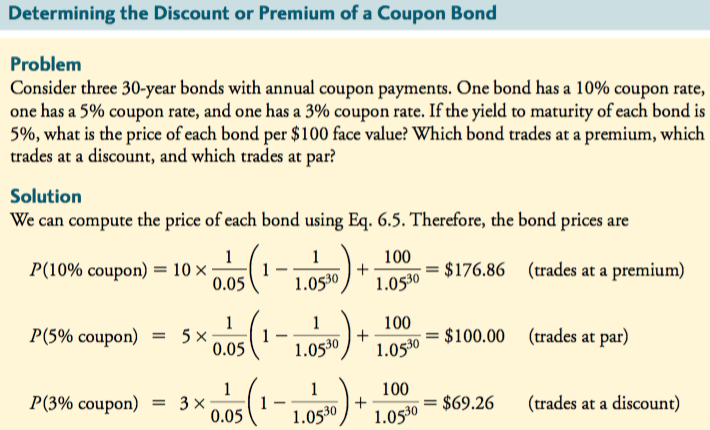
Most issuers of coupon bonds choose a coupon rate so that the bonds will initially trade at, or very close to, par (Ex.: at face value). After the issue date, the market price of a bond generally changes over time for 2 reasons:
- As time passes, the bond gets closer to its maturity date. Holding fixed the bond’s YTM, the present value of the bond’s remaining cash flows changes as the time to maturity decreases.
- At any point in time, changes in market interest rates affect the bond’s YTM and its price (the present value of the remaining cash flows).
Time and Bond Prices
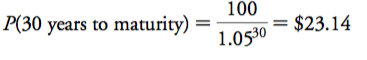
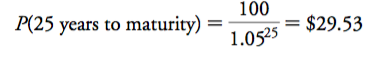
Less years🡪The bond price is higher, and hence the discount from its face value is smaller, when there is less time to maturity. The discount shrinks because the yield has not changed, but there is less time until the face value will be received. If you purchased the bond for $23.14 and then sold it after 5 year for $29.53, the IRR of your investment would be:
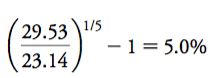
🡪 Your return is the same as the YTM of the bond. If a bond’s YTM has not changed, then the IRR of an investment in the bond equals its YTM even if you sell the bond early.
These results also hold for coupon bonds. The pattern of price changes over time is a bit more complicated for coupon bonds, however, because as time passes, most of the cash flows get closer but some of the cash flows disappear as the coupons get paid.
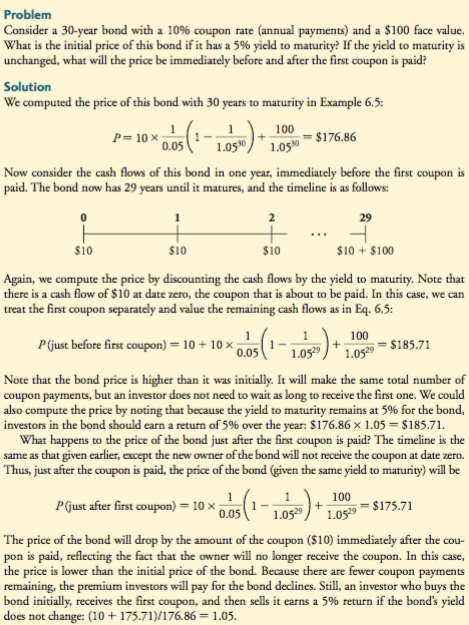
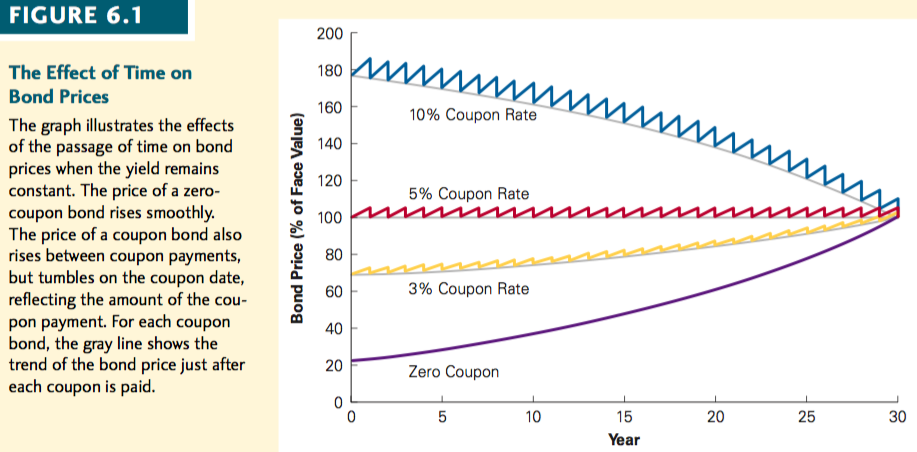
B/w coupon payments, the prices of all bonds rise at a rate equal to the YTM as the remaining cash flows of the bond become closer. But as each coupon is paid, the price of a bond drops by the amount of the coupon. When the bond is trading at a premium, the price drop when a coupon is paid will be larger than the price increase b/w coupons, so the bond’s premium will tend to decline as time passes (ex.: 10%). If the bond is trading at a discount, the price increase b/w coupon will exceed the drop when a coupon is paid, so the bond’s price will rise and its discount will decline as time passes. Ultimately, the prices of all bonds approach the bonds’ face value when the bonds mature and their last coupon is paid. Figure 6.1: YTM at 5%- investors will earn a 5% return on their investment. For the zero-coupon bond, this return is earned solely due to the price appreciation of the bond. For the 10% coupon bond, this return comes from the combination of coupon payments and price depreciation over time.
Interest Rate Changes and Bond Prices
As interest rates in the economy fluctuate, the yields that investors demand to invest in bonds will also change.
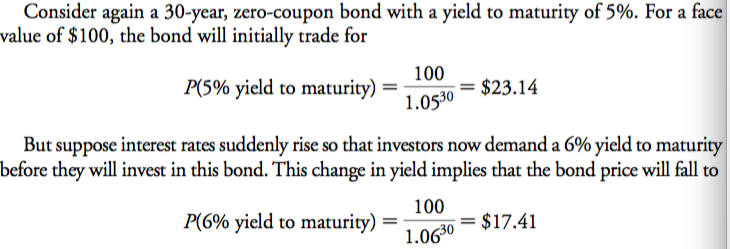
Relative to the initial price, the bond price changes by (17.41-23.14)/23.14= -24.8%.
🡪 A higher YTM implies a higher discount rate for a bond’s remaining cash flows, reducing their PV and hence the bond’s price. As interest rates and bond yields rise, bond prices will fall, and vice versa.
The sensitivity of a bond’s price to changes in interest rates depends on the timing of its cash flows. Because it is discounted over a shorter period, the PV of a cash flow that will be received in the near future is less dramatically affected by interest rates than a cash flow in the distant future. Thus, shorter-maturity zero-coupon bonds are less sensitive to changes in interest rates than are longer-term zero-coupon bonds. Similarly, bonds with higher coupon rates- because they pay higher cash flows upfront- are less sensitive to interest rate changes than otherwise identical bonds with lower coupon rates.
*Duration= the sensitivity of a bond’s price to changes in interest rates. The value-weighted average maturity of a bond’s cash flows.
Bonds with high durations are highly sensitive to interest rate changes.
#Clean and Dirty Prices for Coupon Bonds
Figure 6.1: coupon bond prices fluctuate around the time of each coupon payment in a sawtooth pattern: the value of the coupon bond rises as the next coupon payment gets closer and then drops after it has been paid. This fluctuation occurs even if there is no change in the bond’s YTM.
Because bond traders are more concerned about changes in the bond’s price that arise due to changes in the bond’s yield, rather than these predictable patterns around coupon payments, they often do not quote the price of a bond in terms of its actual cash price (dirty price or invoice price of the bond). Instead, bonds are often quoted in terms of a clean price.
*Dirty price or invoice price of the bond= a bond’s actual cash price.
*Clean price= a bond’s cash price less an adjustment for accrued interest, the amount of the next coupon payment that has already accrued.
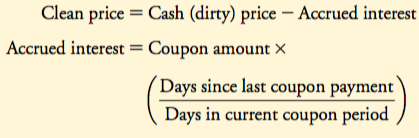
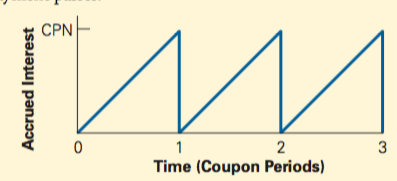
🡪 immediately before a coupon payment is made, the accrued interest will equal the full amount of the coupon, whereas immediately after the coupon payment is made, the accrued interest will be zero. Figure= bonds cash price. So, if we subtract accrued interest from the bond’s cash price and compute the clean price, the sawtooth pattern of the cash price is eliminated. Thus, absent changes in the bond’s YRM, its clean price converges smoothly over time to the bond’s face value.
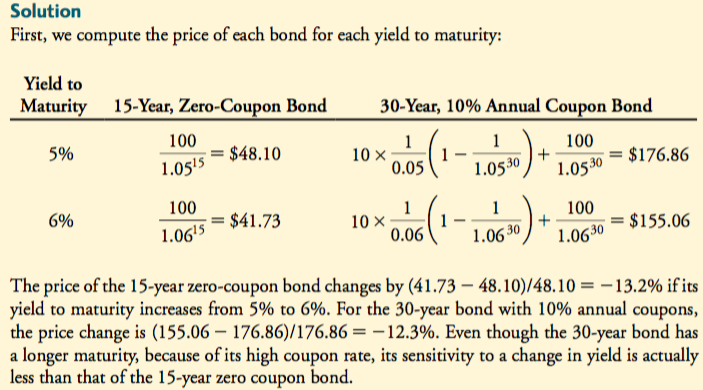
In actuality, bond prices are subject to the effects of both the passage of time and change in interest rates. Bond prices converge to the bond’s face value due to the time effect, but simultaneously move up and down due to unpredictable changes in bond yields.
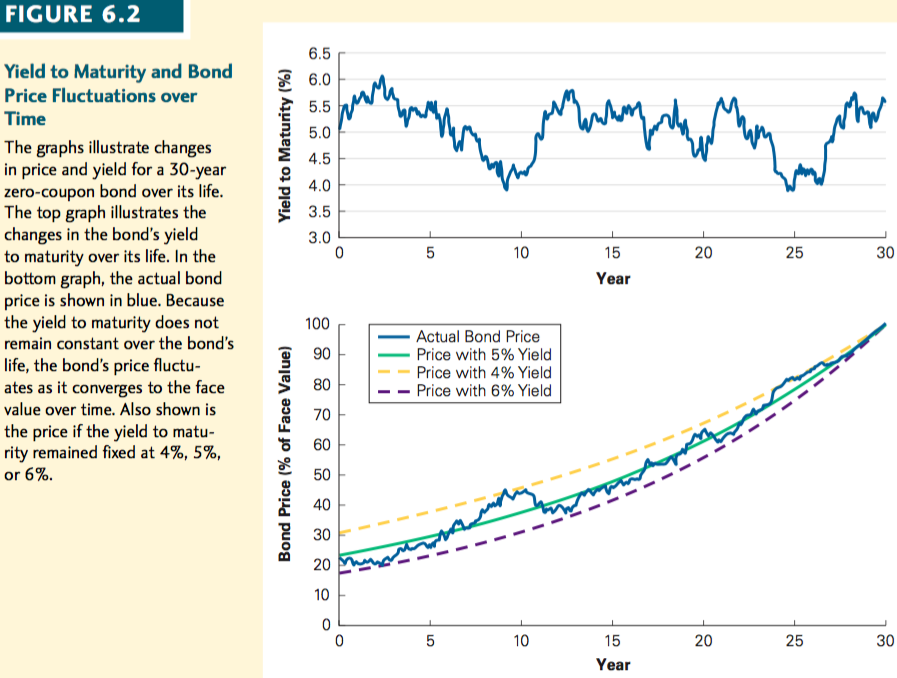
🡪 the bond price tends to converge to the face value as the bond approaches the maturity date, but also moves higher when its yield falls and lower when its yield rises. Prior to maturity the bond is exposed to interest rate risk. If an investor chooses to sell and the bond’s YTM has decreased, then the investor will receive a high price and earn a high return. If the YTM has increased, the bond price is low at the time of sale and the investor will earn a low return.
6.3 The Yield Curve and Bond Arbitrage
Using the Law of One Price, we show that given the spot interest rates, which are the yields of default-free zero-coupon bonds, we can determine the price and yield of any other default-free bond. As a result, the yield curve provides sufficient information to evaluate all such bonds.
Replicating a Coupon Bond
Because it is possible to replicate the cash flows of a coupon bond using zero-coupon bonds, we can use the Law of One Price to compute the price of a coupon bond from the prices of zero-coupon bonds. Ex.: 3-years, $1000 bond that pays 10% annual coupons using 3 zero-coupon bonds:
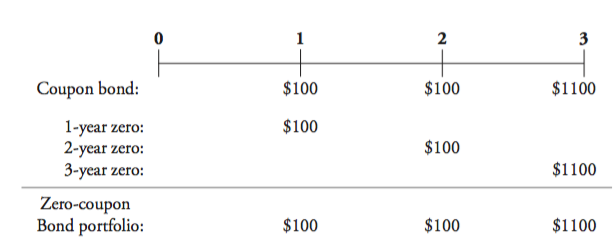
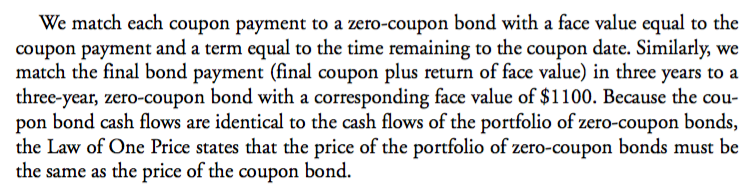
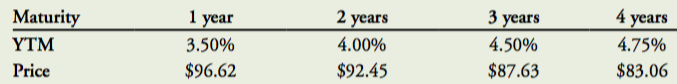
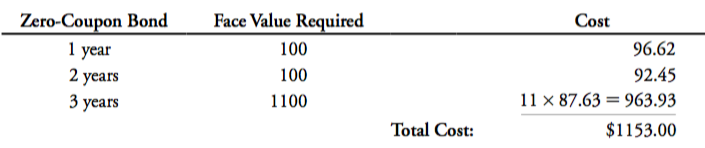
By the Law of One Price, the three-year coupon bond must trade for a price of $1153. If the price of the coupon bond were higher, you could earn an arbitrage profit by selling the coupon bond and buying the zero-coupon bond portfolio. If the price of the coupon bond were lower, you could earn an arbitrage profit by buying the coupon bond and short selling the zero-coupon bonds.
Valuing a Coupon Bond Using Zero-Coupon Yields
Before: used the zero-coupon bond prices to derive the price of the coupon bond. Now: use the zero-coupon bond yields. Recall: yield to maturity of a zero-coupon bond is the competitive market interest rate for a risk-free investment with a term equal to the term of the zero-coupon bond. Therefore, the price of coupon bond must equal the PV of its coupon payments and face value discounted at the competitive market interest rates.

CPN is the bond coupon payment, YTMn is the yield to maturity of a zero-coupon bond that matures at the same time as the nth coupon payment, and FV is the face value of the bond.
// price computed by replicating the bond. Thus, we can determine the no-arbitrage price of a coupon bond by discounting its cash flows using the zero-coupon yields. In other words, the information in the zero-coupon yield curve is sufficient to price all other risk-free bonds.
Coupon Bond Yields
Because the coupon bond provides cash flows at different points in time, the YTM of a coupon bond is a weighted average of the yields of the zero-coupon bonds of equal and shorter maturities. The weights depend (in a complex way) on the magnitude of the cash flows each period. Ex.:the zero-coupon bonds’ yields were 3.5%, 4.0%, and 4.5%. For this coupon bond, most of the value in the present value calculation comes from the present value of the third cash flow because it includes the principal, so the yield is closest to the three-year, zero-coupon yield of 4.5%.
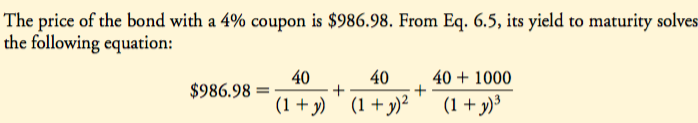
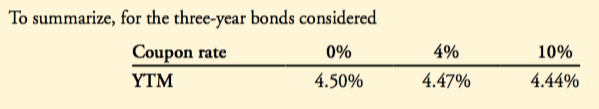
🡪 Coupon bonds with the same maturity can have different yields depending on their coupon rates. As the coupon increases, earlier cash flows become relatively more important than later cash flows in the calculation of the present value. If the yield curve is upward sloping (as the ex. Above), the resulting yield to maturity decreases with the coupon rate of the bond. Coupon rate increase🡪 YTM decrease (negatively related)?. Alternatively, when the zero-coupon yield curve is downward sloping, the YTM will increase with the coupon rate. When the yield curve is flat, all zero-coupon and coupon-paying bonds will have the same yield, independent of their maturities and coupon rates.
Treasury Yield Curves
We can use the zero-coupon yield curve to determine the price and YTM of other risk-free bonds.
*Coupon-paying yield curve= a plot of the yield of coupon bonds of different maturities.
US bond traders: Yield curve🡪 the coupon-paying Treasury yield curve
*On-the-run bonds= the most recently issued treasury security of a particular original maturity.
By convention, practitioners always plot the yield of the most recently issued bonds, termed the on-the-run bonds. We can apply the Law of One Price to determine the zero-coupon bond yields using the coupon-paying yield curve. Thus, either types of yield curve provide enough information to value all other risk-free bonds.
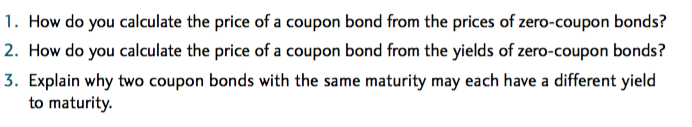
6.4 Corporate Bonds
Before: focused on default-free bonds (US Treasury securities), for which the cash flows are known with certainty. Now: other bonds such as corporate bonds, the issuer may default- might not pay back the full amount promised in the bond prospectus.
*Corporate bonds= bonds issued by a corporation.
*Credit risk= the risk of default by the issuer of any bond that is not default free; it is an indication that the bond’s cash flows are not known with certainty.
Corporate Bond Yields
Because of the cash flows promised by the bond are the most that bondholders can hope to receive, the cash flows that a purchaser of a bond with credit risk expects to receive may be less than that amount. As a result, investors pay less for bonds with credit risk than they would for an otherwise identical default-free bonds. Because the YTM for a bond is calculated using the promised cash flows, the yield of bonds with credit risk will be higher than that of otherwise identical default-free bonds.
No Default
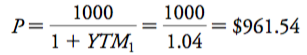
Certain Default
Only 90%: 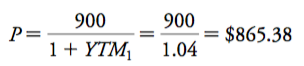
🡪 The prospect of default lowers the cash flow investors expect to receive and hence the price they are willing to pay.
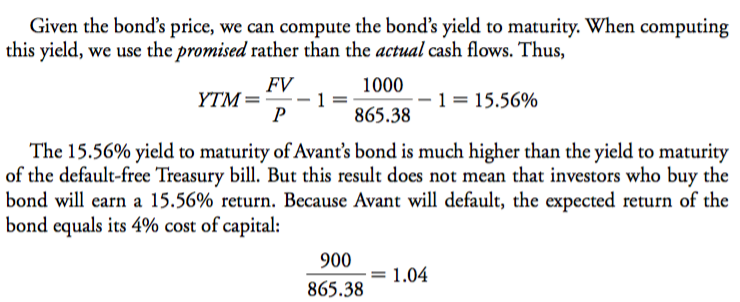
🡪 the yield to maturity of a defaultable bond exceeds the expected return of investing in the bond. Because we calculate the yield to maturity using the promised cash flows rather than the expected cash flows, the yield will always be higher than the expected return of investing in the bond.
#Are Treasuries Really Default-Free Securities?
Treasuries really risk free? The default probability is smaller than for any other bond. US Treasury security is risk free🡪 Treasury security is the lowest-risk investment denominated in US dollars in the world.
*Debt-ceiling= a constraint imposed by the US Congress limiting the overall amount of debt the government incur.
🡪 no investment is truly “risk free”.
Risk of Default
Chance a firm will default lies somewhere b/w (probability of default= 0 and definitely default) and for most firms, is probably much closer to zero.
A firm is more likely to default if the economy is weak than if the economy is strong, then investors will demand a risk premium to invest in this bond.
The bond’s expected return, which is equal to the firm’s debt cost of capital, is less than the yield to maturity if there is a risk of default. Moreover, a higher yield to maturity does not necessarily imply that a bond’s expected return is higher.
Bond Ratings
It would be both difficult and inefficient for every investor to privately investigate the default risk of every bond. Consequently, several companies rate the creditworthiness of bonds and make this information available to investors. Bonds with the highest rating are judged to be least likely to default. By consulting these ratings, investors can assess the creditworthiness of a particular bond issue. The ratings therefore encourage widespread investor participation and relatively liquid markets.
*Investment-grade bonds= bonds in the top 4 categories of creditworthiness with a low risk of default.
*Speculative bonds, junk bonds, or high-yield bonds= bonds in one of the bottom 5 categories of creditworthiness (below investment grade) that have a high risk of default. High-yield bonds= bonds below investment grade which trade with a high yield to maturity to compensate investors for their high risk of default.
The rating depends on the risk of bankruptcy as well as the bondholders’ ability to lay claim to the firm’s assets in the event of such a bankruptcy. Thus, debt issues with a low-priority claim in bankruptcy will have a lower rating than issues from the same company that have a high- priority claim in bankruptcy or that are backed by a specific asset such as a building or a plant.
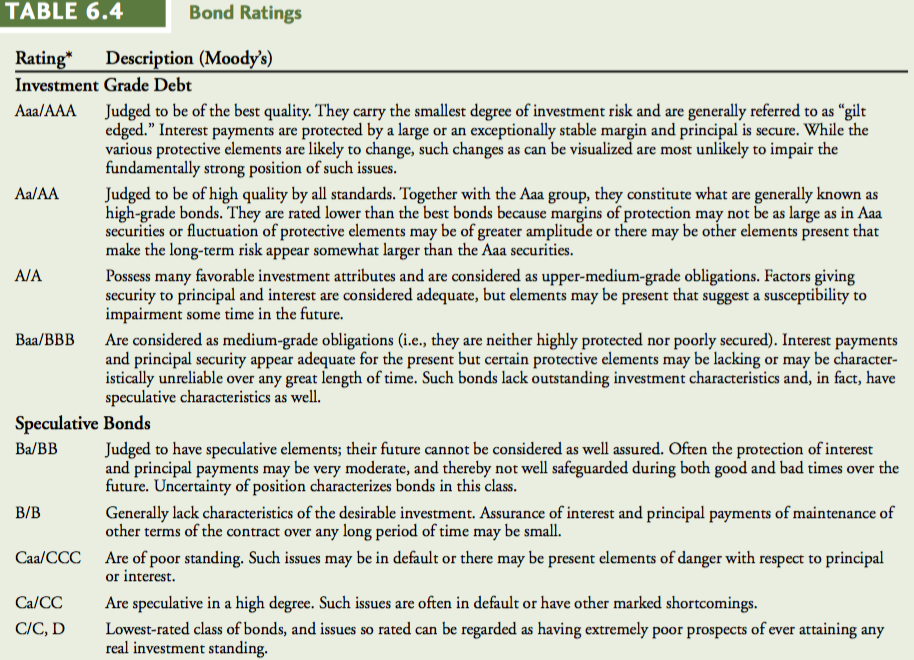
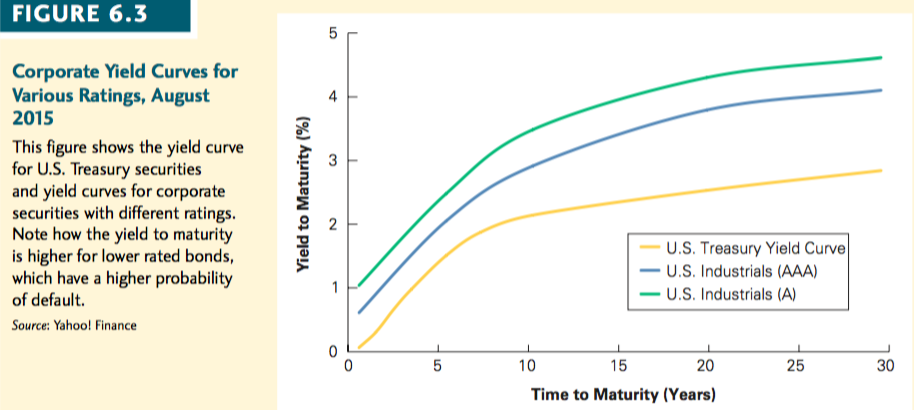
Corporate Yield Curves
Just as we can construct a yield curve from risk-free Treasury securities, we can plot a similar yield curve for corporate bonds.
*Default spread or credit spread= the difference b/w the risk-free interest rate on US Treasury notes and the interest rates on all other loans. The magnitude of the credit spread will depend on investors’ assessment of the likelihood that a particular firm will default.
Credit spread is high for bonds with low ratings and therefore a greater likelihood of default.
🡪![]()
6.5 Sovereign Bonds
*Sovereign bonds= bonds issued by national governments. Ex.: US Treasury securities.
While US Treasuries are generally considered to be default free, the same cannot be said for bonds issued by many other countries. Until recently, sovereign bond default was considered and emerging market phenomenon.
#Global financial crisis: the credit crisis and bond yields
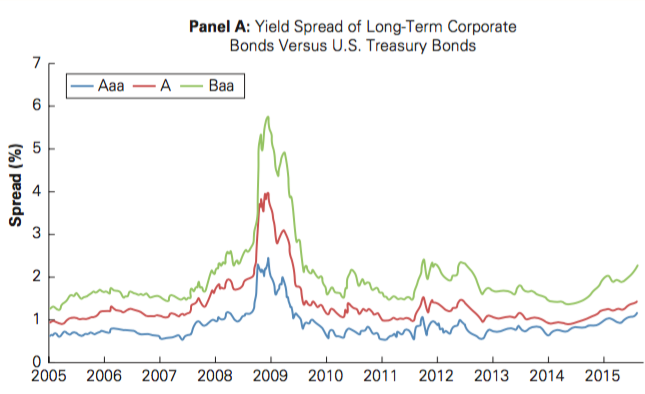
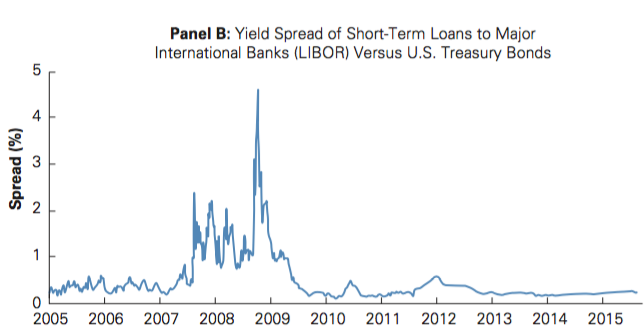
The increase in borrowing costs made it more costly for firms to raise the capital needed for new investments, slowing economic growth. 2012 increase: the wake of the European debt crisis and consequent economic uncertainty.
The experience with Greek government bonds served as a wake-up call to investors that governments in the developed world can also default. *IMF: international monetary funds
Because most sovereign debit is risky, the prices and yields of sovereign debt behave much like corporate debt: the bonds issued by countries with high probabilities of default have high yields and low prices. Key difference b/w sovereign default and corporate default.
Unlike a corporation, a country facing difficulty meeting its financial obligations typically has the option to print additional currency to pay its debts. Of course, doing so is likely to lead to high inflation and a sharp devaluation of the currency. Consequently, debt holders carefully consider inflation expectations when determining the yield they are willing to accept because they understand that they may be repaid in money that is worth less than it was when the bonds were issued.
For most countries, the option to “inflate away” the debt is politically preferable to an outright default. Defaults do occur, either because the necessary inflation/ devaluation would be too extreme, or sometimes because a change in political regime.
Member states of the European Economic and Monetary Union (EMU) all share a common currency, the euro, and so have ceded control of their money supply to the European Central Bank (ECB). As a result, no individual country can simply print money to make debt payments. Furthermore, when the ECB does print money to help pay one country’s debt, the subsequent inflation affects all citizens in the union, effectively forcing citizens in one country to shoulder the debt burden of another country. Because individual countries do not have discretion to inflate away their debt, default is a real possibility within the EMU.
*ceded: cédé
#Global financial crisis: European sovereign debt yields: a puzzle
Monetary union put in place at the end of 1998.
*folly: folie
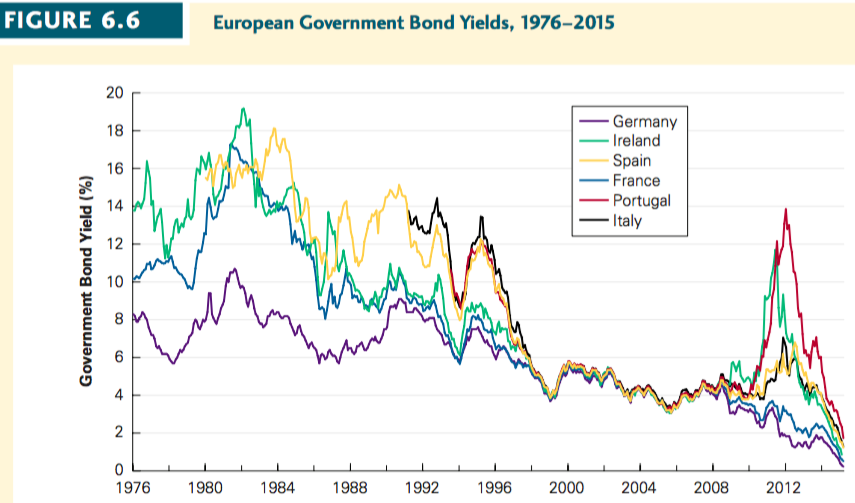
In retrospect, rather than bringing fiscal responsibility, the monetary union allowed the weaker member countries to borrow at dramatically lower rates. In response, these countries reacted by increasing their borrowing––and at least in Greece’s case, borrowed to the point that default became inevitable.
#Interview with Carmen M. Reinhart: Professor
Treasury debt yields are low because of massive official intervention—the Fed and other central banks are buying Treasuries to prevent their currencies from appreciating and to keep their borrowing rates low. This kind of government intervention following a crisis
is common. It is why recovery takes so long.
CONCEPT CHECK
4.2
Bottom of Form
Bottom of Form