Introduction to Economic Evaluation - Key Terms (Week 1)
Course Context & Terminology.
Key concentric relationship diagram shown:
Economics → Health Economics → Economic Evaluation.
Early warning: “Not all decisions are this easy – ‘Right way vs Wrong way’” – stresses complexity of real-world resource allocation.
The Need for Economic Evaluation
Premise: Health-care resources are scarce; budgets are fixed or tightly constrained.
Aim: Maximise total health (or welfare) generated from available resources.
Economic evaluation supplies a systematic & explicit method for comparing costs and benefits of alternative actions.
Used in two broad decision arenas:
Health Technology Appraisal (HTA): case-by-case "yes/no" funding decisions.
Priority setting / league tables: choices across programmes.
Scarcity, Opportunity Cost & Fixed Budgets
Medicare and similar schemes operate under a finite budget – "not an endless pot of money".
Opportunity cost:
Resources spent on X (e.g.
heart transplants) forego benefits of the next-best alternative Y (e.g.
hip replacements).Formal definition: benefits forgone by not allocating resources to the best alternative use.
Goal under a fixed budget: maximise health across all disease areas; interventions must justify their displacement costs.
Evidence on Variability in Value for Money
Tengs et al. (1994): Reviewed 500 life-saving interventions – found orders-of-magnitude variation in cost per life-year saved.
Highlighted potential to save more lives by reallocating funds from poor-value to good-value interventions.
Strategic Review of Australian Health & Medical Research (McKeon Review, 2013) – emphasised that health outcomes depend on productivity & cost-effectiveness of interventions.
Theoretical Foundations of Economic Evaluation
Welfarism (Welfare Economics):
Social welfare = sum of individual utilities (consumer sovereignty).
Prioritise individual preferences; autonomy is key.
Extra-Welfarism:
Supplements utility with socially important outcomes (e.g.
health, equity).Recognises merit goods – the government may supply above market level for social justice.
Key Economic Concepts Introduced
Benefit: What the decision-maker tries to maximise (health, utility, equity, etc.).
Scarcity, Choice, Opportunity Cost.
Allocative vs Technical efficiency (see dedicated heading below).
Incremental & Marginal analysis (distinction emphasised later).
Incremental Analysis & the ICER
Incremental analysis: comparing the costs and outcomes of different interventions to determine the additional benefits provided by one option over another.
Central question: Are incremental benefits worth incremental costs?
Incremental Cost-Effectiveness Ratio (ICER):
ICER = Cost of new treatment – Cost of standard treatment (comparator) / Effect of new treatment – Effect of standard treatment (comparator).
This ratio helps in determining the value of a new intervention relative to existing options.
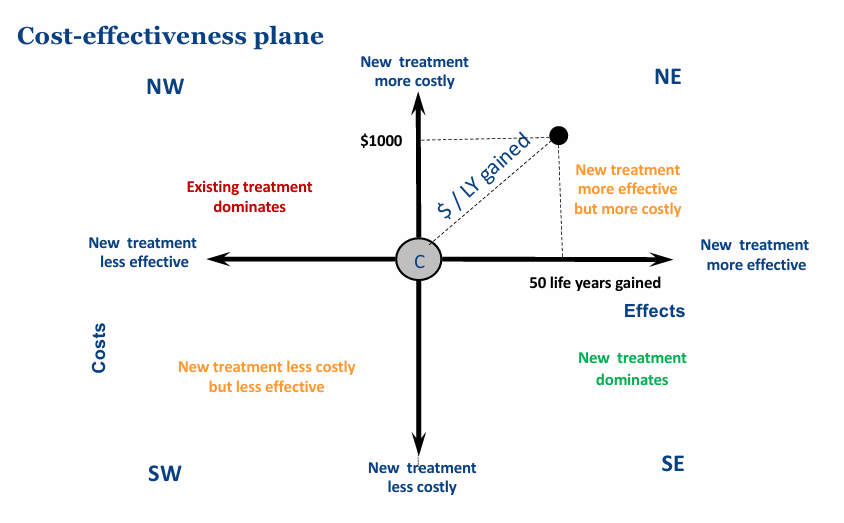
Plotted on the cost-effectiveness plane (NE, NW, SE, SW quadrants):
NE: More effective & more costly.
SE: More effective & less costly – dominant.
NW: Less effective & more costly – dominated.
SW: Less effective & less costly.
Cost-effectiveness analysis: A method to compare the relative costs and outcomes of different interventions, helping to determine the most efficient option.
ICER is a ratio; magnitude alone doesn’t decide: (20/0.001) = (20{,}000/1) = (2{,}000{,}000/100) all equal
\$20{,}000\text{ per life-year} despite huge numerator/denominator differences.
Life year: a measure used to quantify the value of health outcomes, representing one year of life gained through a specific intervention.
Decision Rules for Cost-Effectiveness Analysis
Recommend if new intervention dominates (better outcomes, lower cost).
Reject if dominated.
For NE & SW quadrants:
Compare ICER to a willingness-to-pay (WTP) threshold / ceiling ratio.
Or use league tables ranking interventions by ICER.
willingness-to-pay (WTP) threshold: the maximum amount a decision-maker is willing to pay for an additional unit of health benefit, often expressed as a cost per quality-adjusted life year (QALY).
ceiling ratio: the highest value of ICER that is acceptable for intervention funding, which helps to guide resource allocation decisions in healthcare.
Types of Economic Evaluation
Type | Outcome Metric | Cost Metric | Typical Use |
|---|---|---|---|
Cost-Minimisation Analysis (CMA) | Assumed equal | \$ | Choose cheapest when outcomes proven equivalent |
Cost-Effectiveness Analysis (CEA) | Natural units (e.g. life-years, mmHg ↓ BP) | \ $ | Compare within same clinical domain |
Cost-Utility Analysis (CUA) | Combined utility units (QALYs, DALYs, HYEs) | \$ | Compare across diseases; includes preference weighting |
Cost-Benefit Analysis (CBA) | Monetary () | \$ | Full social appraisal, cross-sector comparisons |
Cost-Consequence Analysis (CCA) | Multiple listed outcomes | \$ | When aggregation inappropriate; decision-maker weighs trade-offs |
Not economic evaluation: Cost (burden) of illness studies – describe economic impact of a disease but do not compare alternatives.
Marginal vs Incremental Analysis
Marginal analysis: Very small change within same programme – compares marginal cost MC with marginal benefit MB.
e.g.
cost per extra mammography in existing screening service.
Incremental analysis: Substituting / adding a different programme.
e.g.
expanding screening to younger age cohort.
Note: Marginal or incremental costs ≠ average cost.
Technical vs Allocative Efficiency
Technical efficiency – "doing things right": Achieving a given objective with minimal resources.
Example questions: Day surgery vs inpatient stay for tonsillectomy; local vs hospital asthma clinics.
Allocative efficiency – "doing the right things": Choosing the mix of programmes that maximises social welfare given opportunity costs.
Example questions: Should government subsidise breastfeeding incentives or expanded tram line vs asthma services?
Selecting Outcome Measures for CEA
Desired properties of a natural unit:
Closely linked to meaningful health outcome (e.g.
life-years, cases detected).Interval scale – equal unit change => equal health change regardless of baseline.
Understandable to decision-makers & allows cross-study comparison.
Examples:
\frac{\$}{LY\;gained} for renal failure therapies.
\frac{\$}{\text{Down’s syndrome foetus detected}} for screening options.
Quality-of-Life (QoL) instruments (Karnofsky, SF-36):
Multi-domain, patient-reported.
Lack interval properties, ambiguous if some domains improve while others worsen.
Advantage: reflect patient experience;
Disadvantage: limited for allocative efficiency.
Cost-Utility Analysis (CUA)
Specialised CEA where outcome = utility-weighted life expectancy.
Common measures:
Quality-Adjusted Life Years (QALYs).
Disability-Adjusted Life Years (DALYs).
Healthy-Year Equivalents (HYEs).
Utility scale: 0 = dead (QALY) or perfect health (DALY); 1 = perfect health (QALY) or dead (DALY); states <0 possible (worse than dead).
Computation example:
No operation: utility 0.5 × 2 years = 1.0 QALY.
Operation: utility 0.9 × 5 years = 4.5 QALYs.
Gain: \Delta QALY = 3.5.
Broad rule: DALYs averted ≈ QALYs gained (opposite orientation of scale).
Why QALYs Are Popular
Combine length & quality of life; include preference weights.
Interval-scaled, so valid arithmetic operations.
Enable comparison across all disease areas → suitable for allocative efficiency.
Convenient for modelling & threshold-based decision rules.
Caveats
May be insensitive to subtle but important changes.
Deriving utilities (e.g.
TTO, SG, EQ-5D mapping) poses methodological challenges.Linking to intermediate public-health outputs (e.g.
reduced smoking prevalence) not always straightforward.
Cost-Benefit Analysis (CBA)
Targets allocative efficiency across health & non-health sectors.
Values all incremental benefits in monetary terms, then computes Net Social Benefit (NSB):
NSB = \Delta Benefits\;-(minus)\;\Delta Costs
If NSB > 0$$ → intervention considered cost-effective.
Monetary valuation approaches:
Human-Capital: future wages / productivity lost or gained.
Revealed Preferences: market behaviour proxies (risk wage premiums, car safety spending).
Stated Preferences: willingness-to-pay (WTP) surveys, contingent valuation.
Challenges
Ethical & equity issues (e.g.
valuing life of lower-income individuals less?).Non-market & unpaid work hard to price.
Gender pay gap example (ABS 2018) shows wage-based valuations can embed systemic inequities.
Budget Impact Analysis (BIA)
Distinct from cost-effectiveness: focuses on affordability for a specific budget holder over 3-6 years; usually no discounting.
Can accompany CEA when an intervention is cost-effective but high-cost (e.g.
hepatitis C drug sofosbuvir).Common modelling elements:
Population size & eligibility.
Uptake speed/market share.
Resource use changes (drug units, monitoring, displaced treatments).
Counterfactual (world without intervention).
PBAC (Australia) requires 6-year BIA with epidemiological or market-share approaches; includes uncertainty & Quality Use of Medicines plans.
Multidisciplinary Expertise Needed
Economics, epidemiology, disease modelling, biostatistics, systematic review & meta-analysis, clinical sciences (medicine, pharmacy), medical technology, implementation science, patient-level outcome research.
Session Aims & Learning Objectives Recap
Describe main techniques & foundations of economic evaluation.
Define key terms: CEA, CUA, QALY, DALY, CBA, CMA, CCA, ICER, HTA, Budget Impact, etc.
Distinguish allocative vs technical efficiency; apply incremental reasoning.
Understand the scope of economic evaluation in guiding public-health & health-care decisions.
Week 1 Take-Home Messages
Economic evaluation = comparative analysis of costs & consequences to aid policy choice.
Scarcity implies opportunity cost; efficiency requires weighing marginal/incremental trade-offs.
Different evaluation types suit different questions; CEA/CUA dominate clinical technology decisions, CBA more for broad public-health or cross-sector choices.
ICER & thresholds underpin many HTA bodies’ decisions (e.g.
PBAC, MSAC).Affordability concerns captured by Budget Impact Analysis.
Methodological rigour matters, but the economic way of thinking—explicit comparison, transparency, opportunity cost—remains the essential contribution to decision-making.