chapter 2: methods
research methods
the tendency of hearing about research findings and thinking that they knew it all along is called hindsight bias
applied research is applying a solution or an experiment on a group of people for your own research
basic research has less application in the real world but has more studies involved
hypotheses and variables
most psychological research is guided by hypotheses
hypothesis - expresses a relationship between two variables
variables - things that can vary among the participants during the research
the dependent variable depends on the independent variable
a change in the independent variable will create a change in the dependent variable
researchers often alter the independent variable and measure/record the dependent variable to test the hypothesis
theory - allows researchers to create hypotheses in hopes of collecting data to support the theory
researchers need to name the variables they will study and the operational definitions for each of them
operationalizing a variable means explaining how you will measure it
example: if you’re doing research for a hypothesis on how television affects the behavior of children, what programs will be considered violent and what is considered non-violent?
validity and reliability
good research is both valid and reliable
it’s valid when the research is accurate, or it’s what the research set out to measure
it’s reliable if the research is consistent. if this was researched in the same way, you would get the same results (or similar results)
sampling
before investigating a hypothesis, you need to know who or what to study
the people who are being conducted are called the participants
the process of how participants are chosen is called sampling
sample - the group of participants
population - anyone or anything that could be selected to be in the sample
when selecting a sample, it should be representative of the larger population
for this to occur, many use random selection
you would use the larger population and randomly pick out a small group
the point of random selection is that your findings have a better chance of being more general and that it represents the general/larger population
“random” is used differently in psychology
to find your sample, you can’t choose someone to find people or do it yourself because you could unconsciously be choosing people of the same caliber
this instead is best done on a computer or just something you “can’t control”
the larger the samp,e the more likely it is to represent the population
the problem with large samples is that consume time and money
stratified sampling allows the sample to represent the large population in terms of numbers
experimental method
experiments can be divided into laboratory experiments and field experiments
laboratory experiments - these are conducted in a lab which is a highly controlled environment
field experiments - these are conducted out in the world
the advantage of lab experiments is that they can be more controlled
the advantage of field experiments is that they can be more realistic
psychologists prefer the experiment as their method of research
experiment - allows the researcher to manipulate the independent variable and control for confounding variables
confounding variables - any difference between the experimental and control conditions that affect the dependent variable (except the independent variable)
an experiment needs to rule out any other possible causes. to do this, an experiment should randomly assign participants to conditions and by using various methods of control to eliminate confounding variables
assignment - the process of participants being put into the experimental group of the control group
random assignment - each participant has an equal chance of being put into either group
random assignment limits the chance of having participant-relevant confounding variables
if the participants could choose which group they wanted to be in, it could affect the result of the experiment and lead to confounding variables
if someone wanted to ensure that the groups were equivalent, they could use group matching, which divides people based on race, age, gender, etc.
during the experiment, the experimental and the control group should be placed in incredibly similar situations, even the exact same if possible
only differences in the situations could create situation-relevant confounding variables, making it slightly inaccurate
experimenter bias - is a type of situation-relevant confounding variable where researchers unconsciously treat members of the experimental and control group differently, wanting to confirm their hypothesis
experimenter bias can be eliminated by using a double-blind procedure, which is when both the participants and researcher are able to affect the outcome of the research
you could achieve this in many ways, but the most common is having someone non-related to the participants interact with them, instead of the researcher
a single-blind procedure is when only the participants don’t know which group they’ve been assigned to, which minimizes the effect of demand characteristics and response or participant bias
demand characteristics - indications that show the purpose of the study
response/participant bias - the tendency for subjects to behave in certain ways
social desirability - a type of response bias that is the tendency to try to give answers that reflect well upon them
experiments usually involve at least one experimental group and one control group
experimental group - the group that gets treatment focused on the independent variable
control group - the control group is mainly for comparison and does not get the independent variable
Hawthorne effect - a finding where just selecting a group to experiment on will affect the performance of that group, regardless of what treatment they’ve been given
one important method of control is the placebo method
placebo method - whenever participants have to ingest a drug, the control group is given a substance that is slightly different than the experimental group
this method allows researchers to differentiate the physical effects of the actual drug from the psychological effects of people thinking they took the same drug
counterbalancing - a procedure when you’re using participants as their own control group
order effects - participant’s responses are altered based on the order they do certain conditions/events
correlational method
correlation - expresses a relationship between two variables
correlations can be positive or negative
positive correlation - a positive correlation between two things means that the presence of one thing predicts the presence of another
negative correlation - the presence of one thing predicts the absence of another
sometimes, psychologists would not use the experimental method, since testing a hypothesis with an experiment could be impossible
example: I want to test the hypothesis that boys are more likely to call out in class than girls. what the independent variable has to do has already been predetermined.
result: you cannot isolate the cause of the calling-out behavior
if I wanted to control all aspects of the research process, I would’ve conducted an ex post facto study
survey method - an even more popular research method that involves asking people to fill out surveys
contrasting the survey method with the experimental method, if you had a hypothesis, you could only use an experiment to find out the cause-effect relationship. a survey would not be much help.
you would use the survey method to investigate if there is a relationship between two variables.
none of the variables are manipulated when using the survey method. there are two variables, but no ‘independent variable’ or ‘dependent variable’ is assigned.
if you use the survey method, you cannot control participant-past confounding variables
the survey method does not allow the researcher to determine which differences cause a difference in whatever they are researching
controlling situation-relevant confounding variables is possible when conducting a survey, but it’s rarely done.
one of the advantages of the survey method is that they have convenience
however, with surveys will naturally come confounding variables, since people are taking the survey at different times of the day, taking different amounts of time, etc.
naturalistic observation
sometimes, researchers want to observe participants in their natural habitat without interacting with them
this is called naturalistic observation.
the goal of naturalistic observation is to get a realistic picture of participants’ behavior. also, control isn’t needed.
case study methods
case study method - is used to get a full, detailed picture of one participant or a small group of participants
example: clinical psychologists usually use case studies to present information about a person suffering from a disorder
because case studies only focus on one person or a small group of people, the result will not be generalized to the larger population
descriptive statistics
descriptive statistics - describes a set of data
example: if you were interested in seeing what pets your classmates have, you can summarize that data using a frequency distribution which would tell you the number of students that had certain animals
frequency distribution - visual displays that organize and present amounts so that the information can be interpreted more easily
frequency distributions can be turned into line graphs which are called frequency polygons or bar graphs called histograms
whenever you are graphing, the y-axis will represent frequency, while the x-axis represents whatever you are graphing
central tendency - attempt to mark the center of a distribution
the three common measures of central tendency are the mean, median, and mode.
mean - the average of all scores in a distribution. you would add up all the scores in the distribution and divide by the number of scores
median - you would write the scores down in ascending or descending order. if there is an odd number of scores, find the middle one. if the distribution contains an even number of scores, the median is the average of the middle two scores. (ex: 1 2 3, 1 2 3 4)
mode - the number that appears most frequently. a distribution can have more than one mode. this could occur if there are numbers that appear equally as frequently and more frequently than the other numbers.
mean is the most commonly used measure of central tendency, but it can be inaccurate through extreme scores or outliers
example: if 19 out of 20 people drive cars priced at $12,000, the other friend has a more expensive car priced at $120,000, and the mean value of the cars is $17,400, this value probably would not be the best measure of central tendency, because it is exceeding everyone’s car value except for one person
when a distribution has outliers, the median is often used as a backup
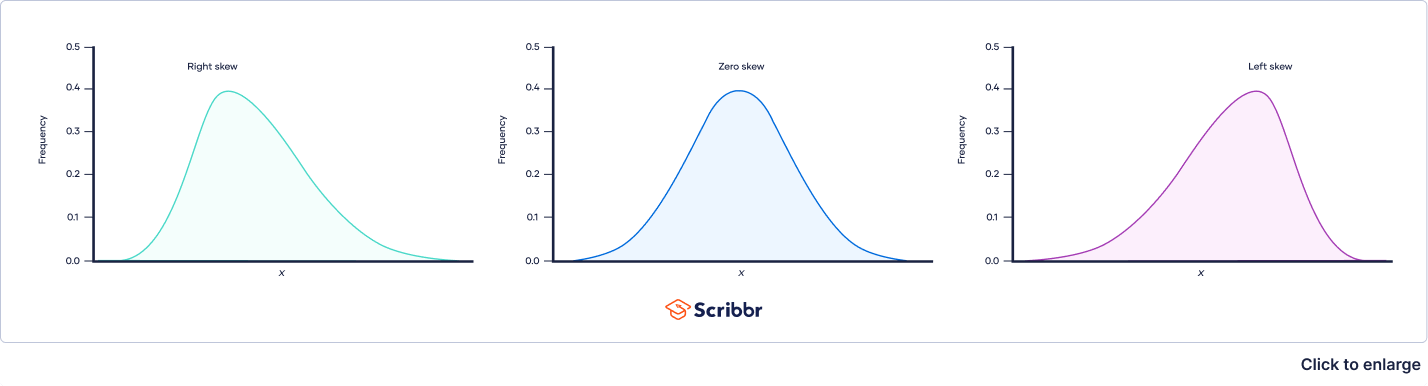
unless a distribution is symmetrical, it is skewed, and outliers skew distributions
positively skewed - when a distribution includes an extreme score that is very high
negatively skewed - when the skew is caused by a particularly low score
in a positively skewed distribution, more low scores would be existent than high scores; the skew is caused by incredibly high scores than low scores
in a negatively skewed distribution, there would be more high sores than low scores
in a positively skewed distribution, the mean would be higher than the median since the outliers. usually have more of an effect on the mean than the median
in a negatively skewed distribution, the median would be higher than the mean
measures of variability - attempts to depict the diversity of the distribution, measures include range, variance, and standard deviation.
range - the distance between the highest and lowest score in a distribution
variance - the quantity equal to the square of the standard deviation.
standard deviation - the square root of the variance
both the variance and standard deviation relate in terms of the average distance
the higher the variance and standard deviation, the more spread out the distribution
to compare scores from different distributions, you need to convert scores into measures called z scores.
z scores - measure the distance of a score from the mean in units of standard deviation
normal curve - theoretical bell-shaped curve for which the area under the curve lying between any two z scores has been predetermined
68 percent of scores in a normal distribution fall under one standard deviation of the mean
95 percent of scores fall within two standard deviations of the mean
99 percent of scores fall within three standard deviations of the mean
known g that the normal curve is symmetrical, and knowing the three numbers given above, you can calculate the percentage of scores falling between any given z scores
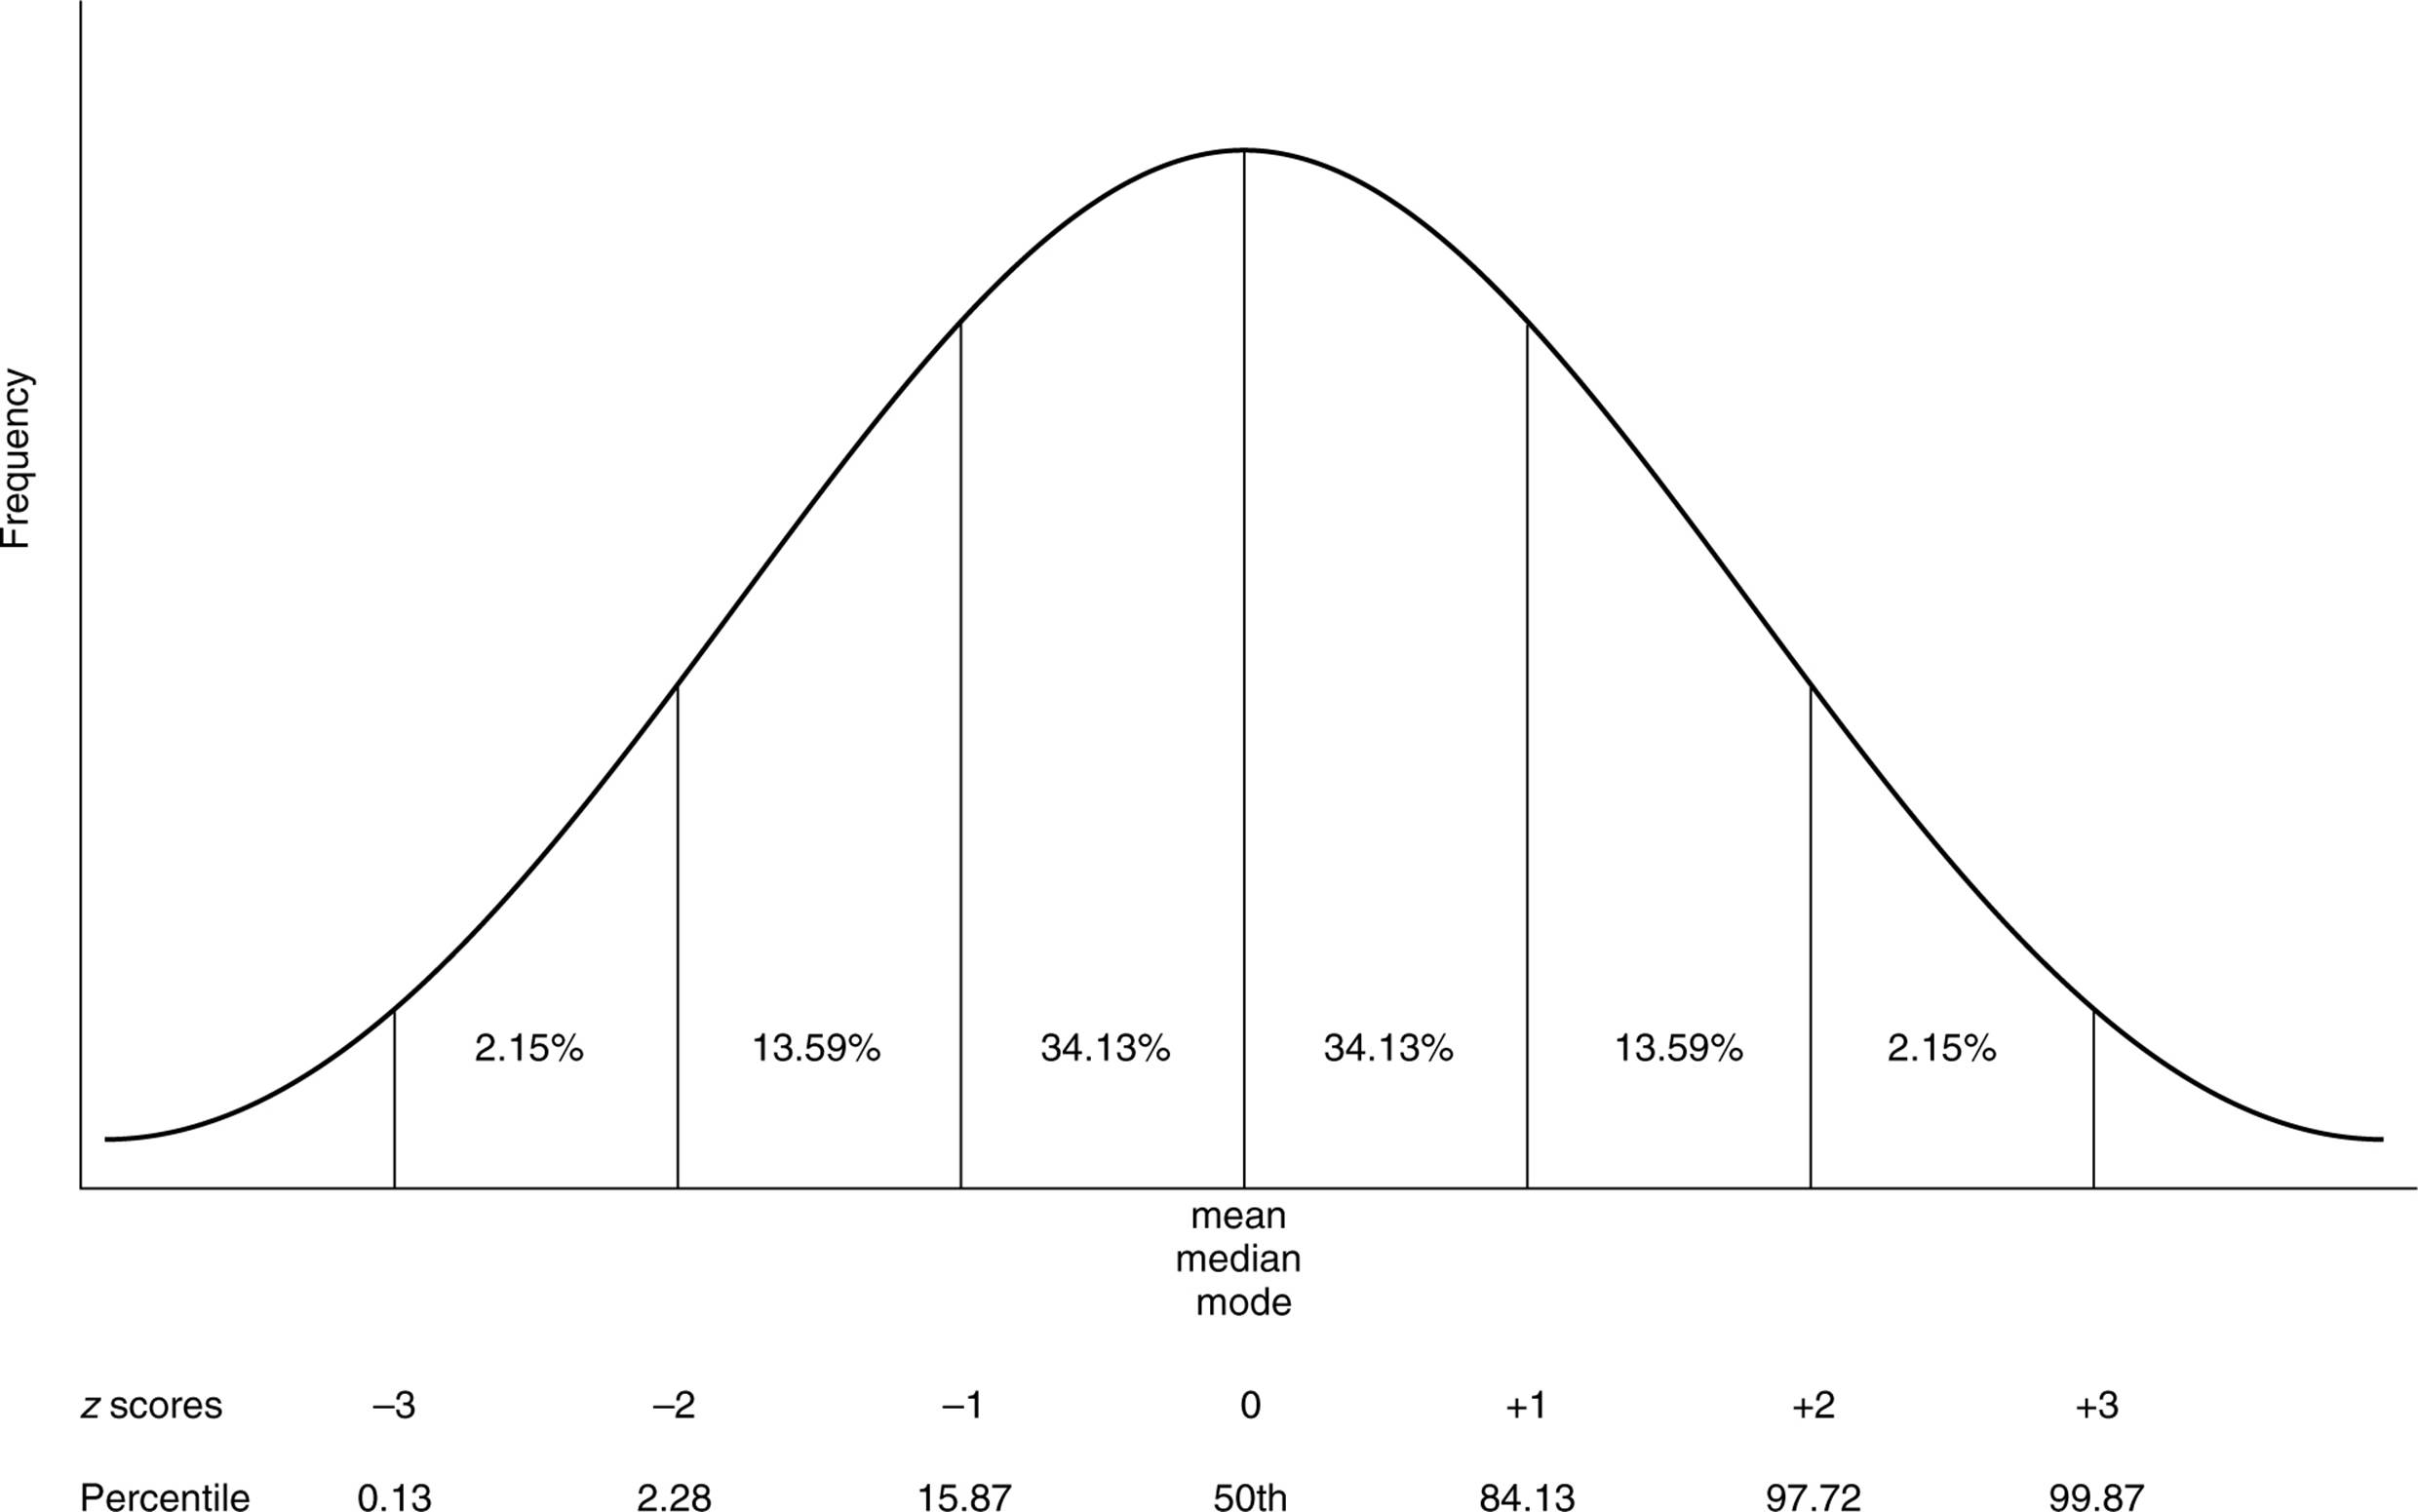
percentiles - indicates the distance of a score from 0
example: someone who scores in the 90th percentile scored better than 90 percent of the people who took the test, meanwhile, someone who scores in the 38th percentile scored better than 38 percent of the people who took the test
there is a relationship between z scores and percentiles
someone who scored the 50th percentile has a z score of 0, and someone who scored the 98th percentile has a z score of 2.
correlations
as a reminder, a correlation measures the relationship between two variables and can be either positive or negative
when there is no relationship between variables, no correlation exists
example: a positive correlation would be studying and getting good grades, a negative correlation would be cutting class and getting good grades, and no correlation would be stuffed animals someone owns and getting good grades
correlations can be either strong or weak
the strength of a correlation is computed through the correlation coefficient
correlation coefficients range from -1 and +1, where -1 is a perfectly negative correlation and +1 is a perfectly positive correlation. overall, they both represent strong correlations.
0 represents the weakest possible correlation, which is no correlation
a correlation can be graphed using a scatter plot
scatter plot - graphs pairs of values, one on the y-axis and one on the x-axis
example: the x-axis could be the number of hours a group of people study per week while the y-axis could be their GPAs
the closer the points are to forming a straight line, the stronger the correlation is
the line of best fit, or the regression line, is the line drawn through the scatter plot that minimizes the distance of all the points from the line
when the line slopes upward, it indicates a positive correlation, while a downward slope indicates a negative correlation
inferential statistics
inferential statistics - the purpose is to determine whether or not findings can be applied to the larger population from which the sample was selected
if a sample does not represent the larger population, one cannot infer anything about the larger population from the sample
sampling error - the extent to which the sample differs from the population
there are many inferential statistical tests, such as t-tests, chi square tests, and ANOVAs
all of these tests yield a p-value.
p-value - gives the probability that the difference between the groups is due to chance.
the smaller the p-value, the more significant the results
the cutoff for statistically significant results is .05, which means that a 5 percent chance exists that the results occurred by chance
a p-value can never be 0 since we are never 100 percent sure that results did not happen due to chance
the stronger the correlation and the larger the sample, the more likely the relationship will be statistically significant
APA ethical guidelines
ethical considerations are important and you should understand the guidelines established by the APA for human and animal research
any type of academic research must first propose the study to the ethics board or the institutional review board
animal research
they must have a clear scientific purpose
the research must answer a specific, important scientific question
animals chosen must be best suited to answer the question at hand
they must care for and house animals in a human way
they must acquire animal subjects legally. animals must be purchased from accredited companies. if wild animals must be used, they need to be trapped in a humane manner.
they must design experimental procedures that employ the least amount of suffering feasible.
human research
no coercion - participation should be voluntary
informed consent - participants must know that they are involved in the research and give their consent
anonymity or confidentiality - participant’s privacy must be protected
risk - participants cannot be placed at significant mental or physical risk
debriefing - after the study, participants should be told the purpose of the study and provided with ways to contact the research about the results
\