Chapter 1: Limits, Alternatives, and Choices – Introductory Economics
The Discipline of Economics and the Problem of Scarcity
Economics is introduced as a social science that studies how individuals, firms and societies make optimal choices when confronted with scarcity. Scarcity means that economic wants – the desire for goods, services and resources – always exceed the productive capacity available to satisfy them. Consequently, every decision maker (households, businesses, governments) must confront limits, alternatives and choices, and must do so rationally to maximise some objective such as utility, profit or social welfare.
The Economic Perspective: Core Intellectual Tools
Economists are trained to “think like an economist,” an approach that rests on three inter-related pillars:
Scarcity and Choice – because resources are limited, any choice implies a trade-off and the forfeiture of opportunity cost, defined as the value of the best foregone alternative.
Rational Self-Interest – households seek to maximise utility, firms strive to maximise profit, and society aims for the best attainable combination of social objectives; in each case purposeful behaviour predominates.
Marginal Analysis – decisions are made at the margin by comparing the marginal benefit (MB) of an additional unit with its marginal cost (MC). The rational rule is to choose an activity level where MB = MC , expanding the activity whenever MB>MC and reducing it if MB<MC.
No decision is truly “free.” Even a so-called “free lunch” has an associated opportunity cost—the resources used to provide it could have produced something else.
Economic Methodology: Theories, Principles and Models
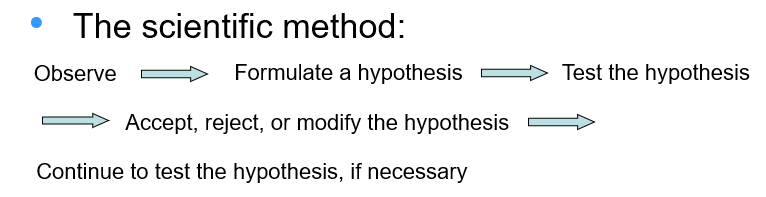
Economists use the scientific method to understand economic behavior and outcomes. This involves moving through four key stages:
Observation – Identifying real-world economic phenomena.
Hypothesis Formation – Creating testable explanations.
Empirical Testing – Gathering data to test predictions.
Continuous Revision – Accepting, modifying, or rejecting ideas based on evidence.
📌 Results of the Scientific Method: Economic Principles
Economic principles are the outcomes of this rigorous process. They are expressed as:
🔹 1. Generalizations
Concise statements that describe or predict the behavior of economic agents — individuals, businesses, organizations, and societies — based on patterns observed in production, consumption, and exchange.
Example: “When the price of a good rises, quantity demanded falls.”
🔹 2. Models
Simplified, stylized representations of the real economy that focus on essential variables while omitting irrelevant details.
Types: Graphs, equations, tables.
Purpose: Help economists explain and predict outcomes (e.g., supply and demand curves, circular flow diagrams).
🔹 3. Ceteris Paribus (Other Things Equal)
An assumption used in model-building and analysis to isolate the impact of one variable by holding all other influencing factors constant.
Example: When studying the effect of price on demand, ceteris paribus assumes income, preferences, and other goods’ prices stay unchanged.
📈 Graphical Models
Graphical tools help translate abstract economic ideas into visual form, providing deeper insight into:
Slopes (e.g., marginal cost, elasticity)
Intercepts (e.g., fixed costs, base utility)
Areas (e.g., consumer surplus, deadweight loss)
Equilibrium (where demand = supply)
These visuals support logical reasoning, aid communication, and make abstract principles more intuitive.
Microeconomics vs. Macroeconomics
Microeconomics focuses on decision-making by individual units—consumers, workers, firms and resource owners. Macroeconomics studies the economy-wide outcomes formed by the aggregation of all those micro decisions: national income, unemployment, price levels and growth. While both branches share the same methodological core, they ask distinct questions and employ different data sets.
Positive versus Normative Analysis
Positive economics describes “what is”; normative economics prescribes “what ought to be.” A positive statement might be, “If gasoline prices rise, quantity demanded falls.” A normative counterpart would add a value judgement, e.g., “The government should tax gasoline to curb emissions.” Normative claims cannot be validated by facts alone, but they are inseparable from policy debates.
The Individual’s Economising Problem and the Budget Line
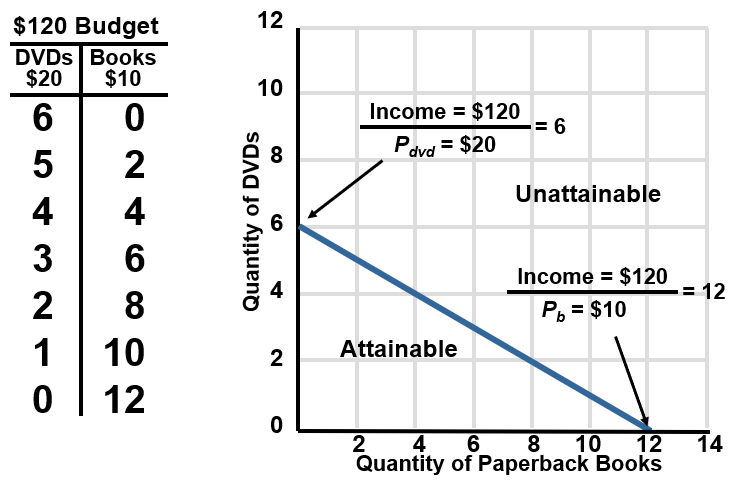
Every consumer faces limited income but virtually unlimited wants. The budget line (or budget constraint) depicts all combinations of two goods that exhaust the consumer’s income. For the specific example in the transcript the line is:
10Qb x 20Qd = 120
where Qb is the quantity of paperback books (price $10) and Qd is the quantity of DVDs (price $20). Points on or inside the line are attainable; points outside are unattainable given income. A rise in income shifts the line outward in a parallel fashion, expanding attainable choices. Movements along the line illustrate trade-offs and opportunity costs—for instance, moving from 6 DVDs to 5 DVDs requires giving up 2 books because each DVD costs the same as two books.
Global Perspective: Vast Income Differences
Per-capita income varies dramatically across countries, ranging (in 2008 USD) from \$65{,}330 in Switzerland to \$170 in Liberia. These disparities reveal the extent to which societies differ in resource endowments, human capital, technology and institutions, linking back to macro questions about growth and development.
Society’s Economising Problem: The Four Resource Categories
Society also faces scarcity, expressed in four broad resource classes:
Land – all natural resources.
Labour – human physical and mental talents.
Capital – manufactured aids to production such as machinery, buildings and infrastructure.
Entrepreneurial Ability – the special human resource that organises the other three, makes strategic decisions, innovates and bears risk.
Because these inputs are limited, society must decide which goods to produce and how to allocate the output among competing ends.
The Production Possibilities Model
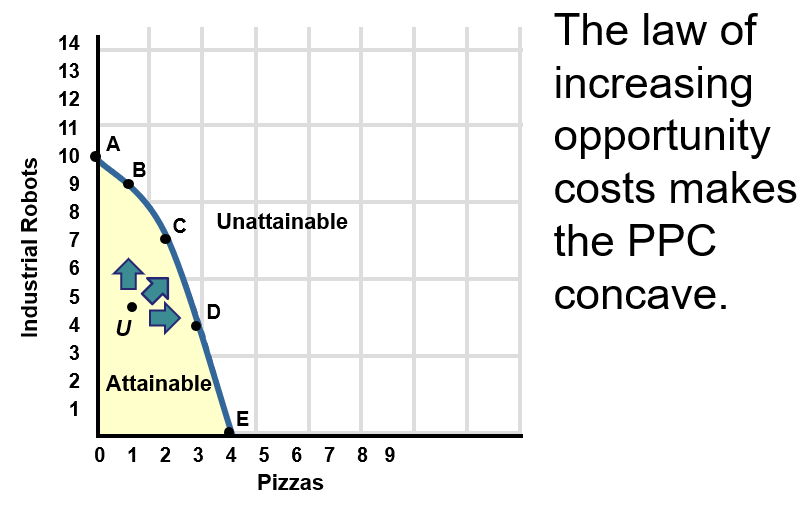
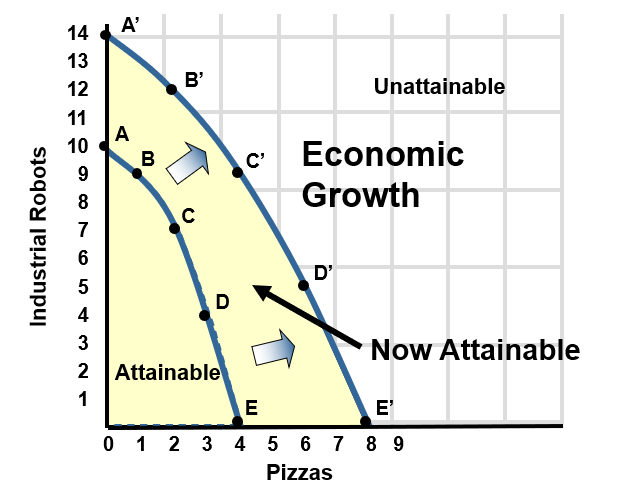
To visualise social trade-offs, economists employ the Production Possibilities Table (PPT) and its graphical counterpart, the Production Possibilities Curve (PPC). Under the assumptions of full employment, fixed resources, fixed technology and only two goods (pizzas and industrial robots), a sample PPT is:
Alternative | Pizzas (hundred thousands) | Robots (thousands) |
|---|---|---|
A | 10 | 0 |
B | 9 | 1 |
C | 7 | 2 |
D | 4 | 3 |
E | 0 | 4 |
Plotting these combinations yields a concave PPC. Its curvature illustrates the Law of Increasing Opportunity Costs: reallocating resources toward one good raises the marginal opportunity cost because resources are specialised. Mathematically, the opportunity cost of one more unit of robots rises as society moves rightward along the PPC.
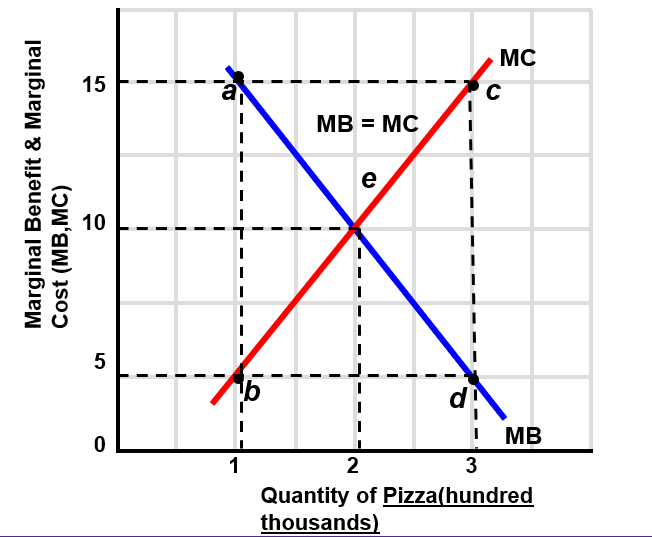
Optimal Allocation via Marginal Analysis
By attaching marginal-benefit and marginal-cost schedules to successive pizza quantities—say MB = {15,10,5,0} and MC = {0,5,10,15}—society locates the optimal point where MB = MC. Deviating from this point either leaves attainable net benefits unexploited or incurs costs larger than benefits.
Economic Growth: Shifting the PPC Outward
Growth occurs when the constraints of the PPC relax, caused by (i) more resources, (ii) higher-quality resources, or (iii) technological progress. The new PPT (A’, B’, C’, D’, E’) contains more pizzas and robots at every alternative—for example, Alternative C’ delivers 9 hundred-thousand pizzas and 4 thousand robots instead of 7 and 2. Graphically, the PPC shifts outward to a new frontier, making previously unattainable bundles feasible.
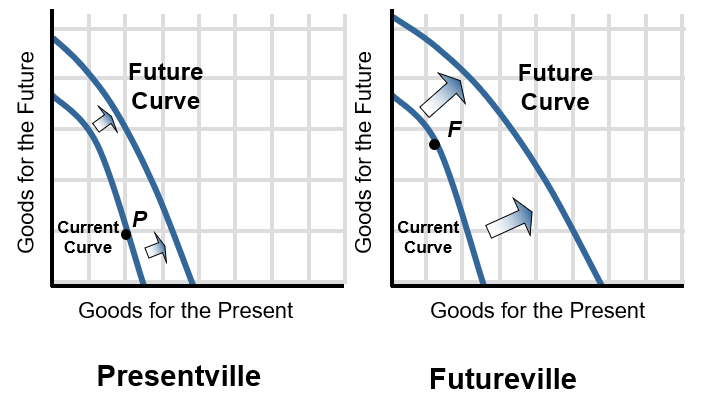
Present Choices, Future Possibilities
When societies allocate more resources to capital goods (“goods for the future”) today, they sacrifice some current consumption but accelerate future growth. Two hypothetical economies illustrate the trade-off: Presentville prioritises present consumption and hence grows slowly; Futureville invests heavily in capital formation and consequently enjoys a much larger PPC in the future.
International Trade and Specialisation
Trade lets each nation specialise in the goods for which it has a comparative advantage, and import the rest. The combined world PPC therefore lies beyond any single country’s domestic PPC, replicating the effect of growth through more efficient resource allocation.
Note: INTERNATIONAL TRADE DOES NOT SHIFT PPF CURVE
Summary and Broader Connections
Scarcity forces individuals and societies into an economising problem: they must choose among competing goals, striving for allocative efficiency (producing the right mix of goods), productive efficiency (producing at lowest cost) and sometimes equity (fair distribution). Options for coping with scarcity include:
• Economic Growth – expand or improve resources and technology.
• Better Use of Existing Resources – reach full employment and productive efficiency.
• Curtailing Wants – a social or ethical adjustment that, while seldom discussed in positive economics, permeates normative debates over consumption, sustainability and welfare.
Microeconomics provides the analytical building blocks—opportunity cost, marginal reasoning, supply and demand—while macroeconomics assembles them to diagnose unemployment, inflation and growth. Positive analysis describes these mechanisms; normative analysis guides policy grounded in values such as efficiency, equity and stability. Ultimately, economics equips decision makers at every level to confront limits, evaluate trade-offs and strive for the best attainable outcomes under scarcity.