Conservation Genetics
1/27/2025
Darwins postulates
Individuals in a population vary in traits
Some trait variation is inherited
There is competition for resources
Successful survival and reproduction is dependent on fitness and is not random
For evolution to occur, natural selection must act upon genes/alleles
Acts upon variation that already exists
New variants can arise by mutation, and selection can act upon these novel variants
Natural selection: Differential survival and reproduction
Natural selection acts on individuals most of the time
Evolution occurs in populations
12/29/2025
Mismatch: changes in our environment, traits we evolved to match the previous environment are now no longer pertinent or helpful
Connection between bacteria and allergies/certain inflammatory diseases
Our microbiome is no longer the same as it used to be
We get antibiotics in our food
Ancestors didn’t experience the same stresses as we do
We are not evolutionarily meant to handle this kind of stress
Mismatched with our environment, and now we experience chronic stress
Cline: populations that are near each other and genetically similar (more accurate term for cline)
Evidence: all human genomes are about 95% similar
Our differences are more of a gradient, our differences are
The differences that we do find among races are no greater than the differences we find between people of the same race
What have we learned from studies on ancient DNA
The average person has about 2% Neanderthal DNA
Cheddar man
The cheddar man is a 7000-year-old skeleton in the Britons
Actually had dark skin
2/3/2025
Importance of taking an evolutionary and genetic approach in conservation
Diversity in genotypes
Phylogenetic approach
How do we conserve species
Root of the problem
Why conserve genetic diversity
susceptibility to genetic disease
Inability to adapt
Genetic diversity is the ultimate source of biodiversity
Raw material for evolution
Categories of topics in conservative genetics
management and reintroduction of captive breeding programs and restorations of biological communities
Detecting and predicting the effects of habitat loss
Description and identification of individuals, genetic population structure, etc
Detection and prediction of effects of hybridization and introgression
Understanding the relationships between the fitness of individuals or local adaptation of populations and environmental factors
Problems with small populations
<1000 two-humped camels in 4 disjunct populations
Song sparrows of mandate island
Small islands population — very unstable with severe crashes
their survival was correlated with inbreeding coefficient
Glanville fritillary butterfly
Metapopulations: groups of smaller populations that interact
Management of inbreeding
florida panther
populations inbreed because habitat disappeared
Captive breeding programs require genetic management
Effective population size
Not full number of individuals in the population
Using genetic data from representative sample to estimate effective population size
Population structure and management units
are all individuals in an area interacting?
Adaptation
Geographically distinct panda populations differ in the amount of bitter taste receptor genes
Ones with more bitter receptors eat more leaves
Genetics vs genomics
Genetics = things we can understand from a single gene/set of genes with known locations on the chromosomes
Genomics = sequencing the whole genome, all the genes in all the chromosomes in a cell
What do we conserve?
How do we assign value to a species
Keystone species — species with more important niches
Genetic diversity within the population — save species with the potential to evolve more
Where the species are geographically
Populations vs species
Evolution happens at a population level
2/10/2025
Genetic variation
Can be adaptive → coding DNA
Influenced by selection
Can be neutral → noncoding DNA
Influenced by drift and gene flow
WE study genetic variation using
Microsatellites
SNPs
Mitochondrial
How do we generate genetic data?
Polymerase chain reaction (PCR)
Revolutionized molecular genetics
Amplifies specific fragments of DNA
Uses primers specific to genetic markers
You can use gel electrophoresis to analyze it — this is just the amplification
Examples:
Looking at microsatellites — use a primer for specific regions
Looking for specific genes in the mitochondrial genome
How to quantify genetic variation
Heterozygosity within an individual: Proportion of loci that are heterozygous
Heterozygosity within populations: proportion of heterozygous (polymorphic) loci
2/12/2025
Genomics
Use genetic data from the whole genome
More data than with traditional genetic markers
next-generation DNA sequencing
Requires bioinformatics to process data
Better able to infer demographic history
study both selectively neutral and adaptive genetic variation
However — analytical, computational, and big data challenges
DNA sequencing
Method 1: Sanger Sequencing
Denature dsDNA
Make multiple copies of a segment
Attach a primer
Add to four polymerase solutions
Grow complementary chains until termination dye
Denature the grown chains
Electrophorese the four solutions
Result: a single fragment amplified - usually >1000 bp
Method 2: Next generation
Whole genome from the cell
Chop DNA up into pieces
Build DNA libraries
Sequence strands, end up with short reads that you have to use to generate contigs
What to do with this information
create a reference genome (entire sequence of DNA form an organism)
Genome annotation — you need a transcriptome (full RNA sequence)
Assembled genome = most or all DNA assembled into contiguous sequence, ideally scaffolded onto chromosomes
Annotated genome = associates DNA sequence regions with genes
How do you get the SNP
Whole genome resequencing
Tons of info
Data storage issues
Reduced representation sequencing
A subset of the genome
Can be random or targeted
RAD seq (restriction site associated sequencing)
Barcodes to identify individual sequences
Targeted sequence capture
Sequence pre-selected regions of the genome
NOT random
Transcriptomics
RNA sequencing and RNA microarrays
Reveals info about gene expression
Meta genomics
sequencing all the DNA in a sample containing multiple species
Example: microbiome- soil or gut
Environmental DNA: water, soil, fecal sample
Epigenetics
Heritable changes that regulate gene expression but do not change DNA sequence
DNA methylation
2/19/2025
Heterozygosity
Observed heterozygosity: proportion of heterozygous loci or individuals at a locus
Expected heterozygosity: Proportion expected from HWE
With 2 alleles at each locus: He=2pq
With >2 alleles at a locus: He=1- (sum #alleles i=1) pi2
Small populations
Small populations violate hardy weinberg
Genetic drift acts on small populations
Genetic drift: random (stochastic) fluctuations in allele frequencies within a population
Primary evolutionary force causing frequency change across the genome over time
Happens in large populations but tends to be subtle
Alleles fluctuate each generation due to random sampling
Changes in allele frequency
Direction of change is less predictable in small populations — but you can predict the amount it will change
deltaq=(q(1-q))/2Ne = amount allele frequency will change per generation
deltaq=variance
Sqrt(variance)=std deviation = actual amount the allele frequency will change in each generation
Example: if q=0.5, what is the change in q for a population of 10 prairie chickens vs a population of 200 prairie chickens
(.5)*(.5)/20=0.0125
sqrt(0.0125)=0.112
(.5)*(.5)/400=.000625
sqrt(.000625)=0.025
Predicting allele frequency rage in next generation
p’=p+-2sqrt[(pq)/(2N)]
p’=allele frequency in next generation
p=allele frequency in current generation
Example: if p=0.5 and N=10, p in the next generation will range
0.5+-2(0.112)= 0.28 — 0.72
0.5 +- 2(0.025)= 0.45 — 0.55
effect of allele frequency on allele loss
more even distribution = less likely to reach fixation
Rate of heterozygosity loss per generation
deltah=-1/(2N)
Ht=H0[1-1/(2N)]^t
H0 = initial heterozygosity
Ht = heterozygosity at time t
t= # of generations
2/24/2025
Problems with small populations
Stochasticity
Demographic — changing sex ratio
Environmental — storms, unpredictable changes in conditions
Genetic — drift, inbreeding, etc.
Genetic drift: results in fluctuations in allele frequencies AND heterozygosity
Both depend on population size
Heterozygosity is maximized with moderate allele frequencies
Loss of heterozygosity is an increase in homozygosity
This can happen solely from genetic drift, without inbreeding
Inbreeding can exacerbate the increase in homozygosity
Measured as a function of population size
delta h is a rate — percentage of the starting heterozygosity lost in each generation
Consequences of genetic diversity loss
Population bottleneck
Specific type of population change — sudden and rapid decline
Stay at low population number for a while — population can either then recover or go extinct
Consequences depend on
How long population stays at low numbers (duration)
How small does the population get
Populations <50 considered severe bottleneck
Genetic effects of bottleneck
Single-generation bottleneck must be severe to have a large effect (Ne<50)
Theoretical predictions
If N=2: decrease in He by 25% in 1 generation
If N=25: 2% decrease
If N-100, 0.5% decrease
Examples
California COndors
Recessive lethal allele causes dwarfism
Consequence of bottleneck/founder effects in captivity
Would have been really rare in a large wild population, but in a small captive breeding population, it is a problem
Loss of heterozygosity as a function of population size
Can calculate future heterozygosity from the initial heterozygosity and N (really Ne)
Ht = H0 [1-(1/2N)]t
H0 = initial heterozygosity
Ht = heterozygosity at time t
t = number of generations
Bottlenecl in Mauritius kestrel
1974: single pair
1997: N=400-500
57% loss of gen diversity
Example:
H0 = 0.23
N=2
t=1
Ht = 0.23[1-(1/2×2)]1 = 0.173
After 3 generations it would be
Ht = 0.23[1-(1/2×2)]3
Ht = 0.097
Founder effects
Lose genetic diversity as just a few individuals found new populations
depends on
How many founders there are
Their genetic diversity
Are they a representative sample of the parent pop
Example: Scandinavian wolves and ISle Royale wolves
Last pair of wolves on Isle Royale — half-siblings and father-daughter
In 2018, people reintroduced wolves from Canada
Patterns
Patterns of allele frequencies can indicate past bottlenecks or founder effects
You have fewer rare alleles in populations that have been bottlenecked
Heterozygosity is lossed slower than allelic diversity
Inbreeding
(Inbreeding: mating between close relatives
Can be measured at the individual level (the extent to which its genome is homozygous due to shared genetic ancestry) or at the population level (level of similarity among individuals due to relatedness and non-random mating)
Inbreeding depression: Affect of inbreeding on fitness
Inbred individuals have higher mortality rates
Identical by descent: 2 copies of the same recessive lethal allele
Autozygous: IBD at a locus, have 2 copies of the same allele that can be traced to a common ancestor
Allozygous: both alleles derive from 2 different ancestors
2/26/2025
Quantifying inbreeding
Inbreeding coefficient (F): many types and definitions
Proportion of the genome that is IBD
Always ranges 0-1
Pedigree inbreeding coefficient (Fp): Measures increase in homozygosity for inbred individuals relative to others in the population
Figure it out by looking at pedigrees
Assume pedigree with A,B,C,D,E and X. Assume ancestor has no inbreeding (Fa=0)
X’s parents (D and E) are half siblings (both have A as mom)
To determine Fp of X, trace path from X back through the common ancestor back to X
There are 3 individuals in that path — N=3
To calculate pedigree inbreeding coefficient
Fp=(1/2)n(1+Fp(ca))
Only is Fp(CA) if you know the F other common ancestor
So if not, Fp=(1/2)n
F=(1/2)3=0.125
Common co-ancestry
Coancestry coefficient = probability that 2 alleles, one from each of 2 individuals, are identical by descent
Not the same as the coefficient of relatedness
Individual heterozygosity: proportion of loci that are heterozygous in each individual
IR: internal relatedness
Multilocus heterozygosity
Runs of Homosygosty (FROH)
From the genome
Demonstrated on manhattan plot
Gaps in the plot = run of homozygosity
Can be used on individual or population level
Inbreeding depression
Reduction in fitness of offspring produced by mating of relatives
2 direct causes
Unmasking of deleterious recessive alleles
Increased homozygosity more generally can reduce fitness, for many loci have heterozygote advantage
Examples
Lower fecundity
Lower fertility
Higher mortality in young
Decreased population growth rate
Effects of inbreeding are greater in stressful environments
Greater effects in wild vs captivity
Experimental evidence is there that increeding increases extinction risk
80-95% of populations die out in short term in laboratory studies on mice
Lethal equivalents = # of deleterious alleles with fatal consequence
1 lethal equivalent = 1 allele with 100% fatality when homozygous
OR 2 alleles with probability of 0.5 of causing death when homozygous
OR 10 alleles with probability of 0.1 of causing death when homozygous
# of LE relates to the genetic load
Can be estimated from relationship of fitness and F
Is inbreeding ok sometimes
Does inbreeding occur in the wild in healthy populations?
Most animals avoid mating with relatives
Naked mole rats have a queen and she mates with a ton of men — high relatedness
No observes inbreeding depression
Until one type of enteric coronavirus wiped out populations if inbred naked mole rats
Purging: maybe they have purged the deleterious alleles from their genomes over time
influenced by rate of inbreeding, population size, time
Genetic Rescue
Population augmentation via translocation
Used in Adders in Sweden that were isolated for a really long time
And the Florida panthers
Survivorship is a good measure of if genetic rescue worked
Heterosis: offspring of outbred parents, offspring are more fit
Genetic rescue: Decrease in extinction probability of a population due to gene flow
Measured by increase in population growth rate
If you din’t have growth rate data, look at increased fitness
Increase in heterozygosity is good, but doesn’t tell you much about demographic effect
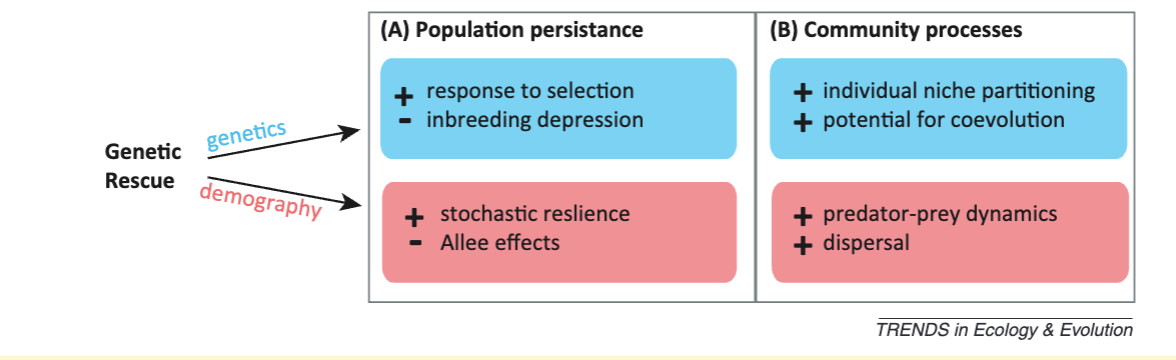
Stochastic resilience: population has better resistance to disease, environmental factors, etc.
2 aspects to why heterozygosity is important
Harmful recessive alleles — remasking these alleles reduces the genetic load
Heterozygote advantage
Adding genetic variation means there is more for selection to act upon → increases adaptive potential
BUT it is important to balance new allelese/adaptive potential with local adaptation
Genetic rescue may also be an important process in the wild, especially for metapopulation
Concerns with genetic rescue
Genetic swamping with new alleles
Solution: only bring in a few immigrants at a time
Outbreeding depression: the introduced individuals reduce the fitness of the population that is being saved
Happens when the two populations are too different
Disrupts local adaptation
Decreased fitness of hybrids
Within your genome, certain genes are coadapted. Disrupting this disrupts adaptation
Solution: seek a genetically similar source population
Current consensus: genetic rescue of small, inbred, recently isolated populations by large source populations should be the default
Heterosis is known to be maximal in the first generation — how effective is genetic rescue over time?
How frequently do populations need to be rescued?
Most studies have been short term
Florida panthers long term results
Big change in heterozygosity that increased over time
Survival was corellated with heterozygosity and genetic ancestry
Positive population growth
Lowered extinction probability
Concluded that management was still needed over long term, but nothing drastic
How can genomics aid implementing genetic rescue
Identifying source populations
Identifying best individuals to translocate
Monitering the outcomes of genetic rescue
Effective population size (Ne)
Size of an idealized population that would act the same (have the same genetic consequences) as the population under consideration
“gene pool”
The actual size of the population overestimates the gene pool
Genetic drift depends on the effective population size, not the census size
The rate of genetic diversity loss (heterozygosity loss) depends on Ne
delta h=-1/2Ne
Why might effective population not be the same as the census population
Unequal ratio of males to females
Nonrandom mating
Not everyone mates
Unequal offspring production
Population sizes fluctuate
What is an ideal population
All individuals contribute equally to the gene pool
Population size stays the same
nonoverlapping generations
Equal sex ratio
Ne VS N
Ne<N (~.1-.5 in most wild populations)
Some examples of ratios as low as 0.001 → marine fish, marine invertebrates
Unequal sex ratio
Ne=(4Nf * Nm)/(Nf+Nm)
If sex ratio is equal (Nf = Nm). Ne=1
Nf = Number of females
Nm = Number of males
Example: skewed sex ratios in hunted ungulate populations
Some suggest that 1 male per 25-100 females is sufficient to maintain population growth in hunted ungulate populations
Effective size is only about 4
In the most extreme case, Ne ~ 4 * the rarer sex
Generally, unequal sex ratio does not have a big effect unless highly skewed
Nonrandom number of offspring
Variation in reproductive success
Vk=(sum(ki-avgk)2 /N
Ne=(4N-2)/(2+Vk)
If every parent produces the same number of offspring, the variance (Vk) = 0
Variance in reproductive success
Same equation as nonrandom number of offspring
Fluctuating population size
Because H is lost at a rate of 1/2 Ne, years with small population sizes will have large effect on H loss
As a result, average population size is not representative of H lost over years with fluctuating population size
Example: effect of fluctuating population size on H
Consider 3 generations with N1=100, N2=2, and N3=100
At what rate will H be lost in each generation?
H is lost at a rateof 1/2N per generation
Averages do not reflect the situation when there is drastic fluctuation
We need harmonic mean
Ne=t/sum(1/Ni)
t=generations
harmonic mean is much lower than the regular average
Overlapping (discrete) generations
Reduces Ne if there is variance in reproductive success and some individuals reproduce over many generations
Heterozygosity loss is calculated over generations
Generation interval = mean age of parents
Estimating Ne from genetic data
Based on genetic drift
Temporal change in heterozygosity
Needs at least 2 time points
Look at changes in allele frequency
Measure linkage disequilibrium (LD)
Genetic linkage: physical association of genes on a chromosome within an individual: distance-based
Linkage disequilibrium: non-random associations between genes of different loci within a population
By chance, genes on different chromosomes can be linked due to genetic drift. Their allele frequencies will be correlated
Rate of linkage disequilibrium increases with decreasing Ne
Ne may not correlate with heterozygosity when there is gene flow (dispersal)
What is a target Ne for conservation
50-500 rule for minimum viable populations
Short term: Ne>50
Based on theoretical predictions of heterozygosity loss and inbreeding risk
To minimize inbreeding depression by keeping delta f <1% per generation
Long term: Ne>500
To maintain adaptive potential and prevent accumulation of deleterious recessive alleles
3/10/2025
Population subdivision
As populations become subdivided, genetic consequences are a result of opposing forces of genetic drift and gene flow
Panmixia: everything is connected completely in a population
Isolation: opposite of panmixia, there are distinct subdivisions with no gene flow
Effective dispersal = gene flow (AKA migration)
Mixing homogenized effects of genetic drift
Population subdivision in red -cockases woodpeckers
Very little gene flow among sites
Small populations have lower heterozygosity than large population
With subdivisions, heterozygosity decreases within subpopulations (increased genetic drift), and differentiation occurs among the subpops (decreased gene flow)
Bigger populations are more similar to each other
Really small populations are more divergent, and the ones that are far from large populations are the most divergent
Relationship of genetic and geographic distance varies among species
As geographic distance increases, so does genetic distance
What are some plausible explanations for this variation?
Could be something blocking dispersal
Why is it important to understand patterns of population divergence?
Important for translocations
Understanding local adaptations
Identifying management units
Identifying if a population needs intervention
How do we quantify subdivision
Using F statistics
Partitioning variance withinand among subpopulations of the whole population
Population-level inbreeding coefficient: individuals within local population will be inbred (have more common ancestry) relative to individuals drawn randomly from larger population as a whole
Measure reduction in heterozygosity relative to HWE
F=1-(H0/He)
He is expected heterozygosity under HWE
H0 is observed heterozygosity
FIS=1-(H0/Hs)
Looks at relationship between individuals and their subpopulation
When FIS is > 0
Excess of homozygotes
Inbreeding within a local population
assortative mating
When FIS is < 0
Typically only occurs in very small populations
Exceess of heterozygotes
Indicates bottleneck - weird
Fst=1-(Hs/Ht)
Inbreeding due to genetic divergence among subpopulations relative to the total populations
Metric of gene flow
Can be taken for an overall population by averaging the Hs for the subpopulations
If there was complete mixing, it would be 0
Ranges more different from other subpopulations
When you have a high Fis, you usually have a high Fst
Population size matters for within population diversity as well as between!
Partitioning heterozygosity
Hs=2pq — where p and q are the alleles in a sub population
Expected heterozygosity within a subpopulation
Ht=2avg(p)avg(q) — calculates heterozygosity in a whole population from p and q in subpopulations
H0= observed heterozygosity within the subpopulation
Gene flow
Gene flow homogenizes effects of drift
Reduces differences between populations
Island model of gene flow
Assumes each population contributes the same number (m) of migrants to the gene pool
With this model:
Fst ~ 1/(4mN + 1)
Tells us how Fst relates to gene flow
When Nm=1, FST = 0.2
“one migrant per generation” rule
it takes very little gene flow to connect populations — you might only need a single individual migrating between populations ber generations
Stepping stone model of gene flow
Assumes that dispersal and gene flow only happens in series — from one stone to the next
This model highlights the importance of intermediate habitats, as they facilitate the movement of individuals and genetic material, ultimately enhancing the genetic diversity of isolated populations.
Gene flow (m) is greater between nearby subpopulations than those farther apart
Takes more migration than the island model to cause the same amount of genetic exchange
Isolation by distance
Correlation of genetic and geographic distance
Results from stepping stone model
Relationship of Fst and geographic distance reveals scale of connectivity