2a. Revenue
Total, average, and marginal revenues
Total revenue (TR) is the total amount of money received from the sale of any given level of output
Average revenue (AR) is the average receipt per unit sold
Marginal revenue (MR) is the receipts from selling an extra unit of output
Total, average, and marginal revenues
Total revenue (TR) = Price x Quantity
Average revenue (AR) = Total revenue/Quantity (which is basically the same as the price)
Marginal revenue (MR) = Change in TR/Change in quantity
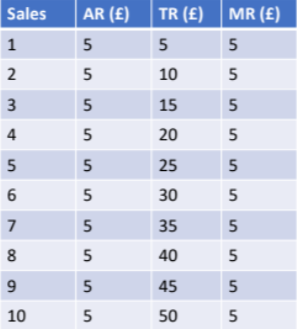
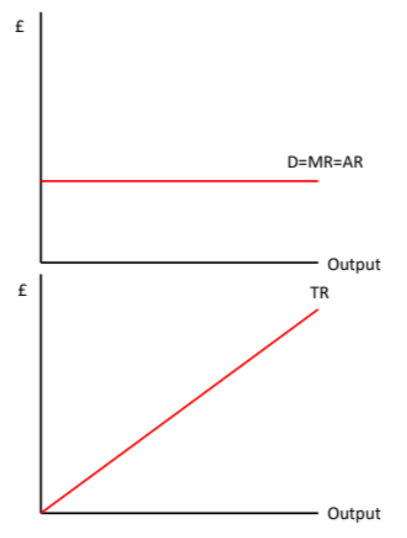
When demand is perfectly elastic there is no diminishing utility and the AR will stay the same per unit our TR will always be rising
However, this doesn’t mean this is a good outcome for firms as they would not be able to change prices ( if they increase market will collapse, and if they decrease they will become the only supplier customers go to)
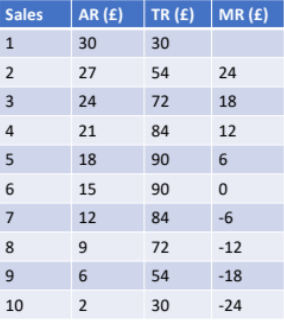
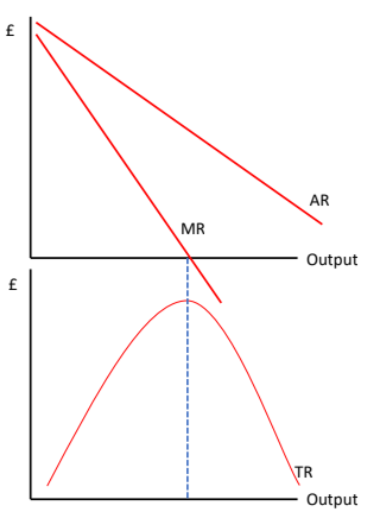
Marginal revenue will mathematically fall twice as steeply as Average revenue and it needs to be reflected on our graphs, It will also always go through 0.
After the 6th sale, the MR is negative - so you lose money by selling that additional good, therefore, you are maximising revenue at 6 units (however firms look to maximise profit)
Why are normal demand curves downward sloping?
The Income Effect: If a good is cheaper the consumer can afford to buy more of it
The Substitution Effect: If a good is cheaper then the consumer will switch to buying this product rather than substitutes
Diminishing Marginal Utility: As consumers consume more of a product they will receive less pleasure (utility) from consuming it and are therefore not willing to pay as much for further items
What is the relationship between price and average revenue?
Total Revenue = Price x Quantity
Average Revenue = Total Revenue/Quantity
We can therefore substitute price x quantity for total revenue
Average Revenue = (Price x Quantity)/Quantity
Quantity divided by Quantity cancels. So, therefore... Average Revenue = Price
The price consumers are willing to pay is shown on their demand curve therefore we can say that AR = D
Revenues and elasticities
If a good has inelastic demand, more revenue will be made by increasing the price
If a good has elastic demand, more revenue will be gained by decreasing the price
You can prove both these statements using one graph
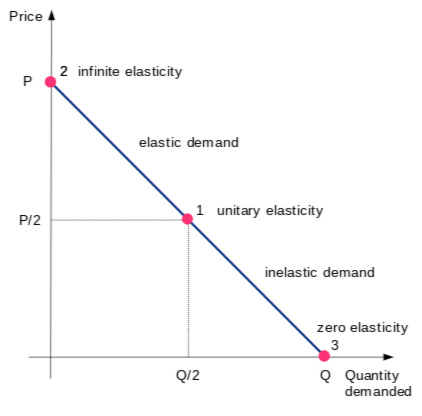
If we put in prices we can see that for the top half as the price decreases the revenue increases therefore it is elastic on the other hand the bottom half is the opposite so is inelastic.
pes ped
demand increases so price increases