GEOM 8 (Feb 24th)
Typed
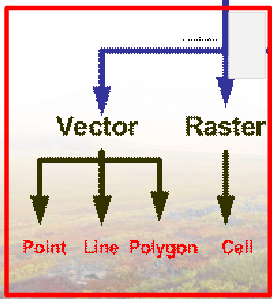
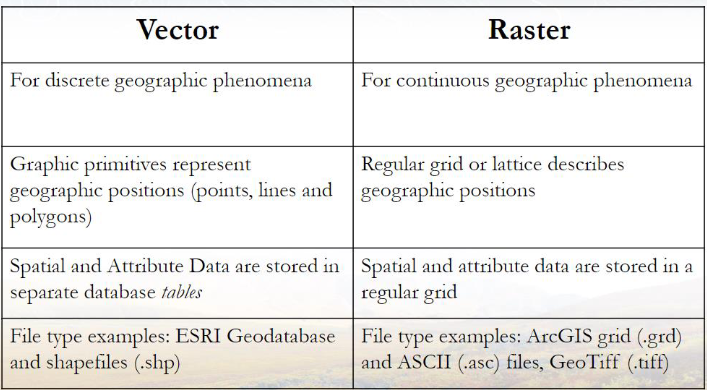
Vector & Raster model
Vector Model: Represents geographic features as points, lines, and polygons, allowing for precise data representation and analysis.
Raster Model: Composed of a grid of cells or pixels, each representing a value, commonly used for continuous data such as elevation or temperature.
Each feature on a visual display is linked to an ‘attribute table’, this take holds the data intended to be displayed and can include information such as names, categories, or measurements associated with each geographic feature, enabling users to perform detailed queries and analyses.
In a rater data model, each pixel is represented by a number, that number is then used to represent a colour which displays some type of image
Vector data
Vector maps represent the most common form of maps
The vector data structure uses:
-Points
-Lines
-Polygons
• Points are addressed using simple x, y coordinates
• Lines consist of connected x, y coordinates called nodes or vertices
• Polygons (areas) are simply enclosed lines where the beginning and ending nodes have the same coordinate value
Vector data: Points
• The most basic vector feature – has location properties (e.g., x, y coordinate values)
• The units the x, y locations are stored based on coordinate system used (Jensen and Jensen, 2013)
Vector data: Lines
• One-dimensional features that have both location and length properties (minimum of two points – referred to as nodes)
• Nodes are also located at the intersection of two or more lines
• Vertices are points in between nodes
Vector data: Polygons
• Two-dimensional objects bounded by a continuous line (areas)
• A single node defines the beginning and ending point for an area
• Areas have both size and perimeter properties
Raster data
• Represented by an array (or grid) of cells:
– All raster layers contain cells arranged in rows and columns.
– Each cell contains a value that describes the phenomena being examined
– Cells in the array are commonly called picture elements (pixels)
Raster data: raster cell value
Every cell in a raster layer has a unique nominal, ordinal, or interval/ratio-scaled value associated with the phenomena being mapped at that particular location
• Integer: typically represent nominal-scale categorical data such as land use or land cover type (uses whole numbers)
• Floating point: represent continuous data (uses decimal places)\
Types of attribute data: 4 kinds
Types of attribute data: 4 kinds
• Nominal: represent different kinds or categories of data (names, no rank – land cover, etc.)
• Ordinal: represent ranked data (ordered – income data)
• Interval: numerical data without an absolute zero value (have known intervals between values – Time of day, calendar years, pH, temperature in Fahrenheit)
Raster data: raster cell size
• Cell size in a raster layer refers to the x and y dimensions of each pixel
• For example:
– A raster cell size of 30 x 30 m means that the cell encompasses a geographic area of 900 m2
– A cell size of 5 x 5 m means that the cell encompasses an area of 25 m2
– The 5 x 5 m cell size is considered to have higher spatial resolution than the 30 x 30 m cell size
– Important to understand that everything in that cell is represented with one value...
KAi
Overview of GIS Concepts
Geographic Information Systems (GIS) involve various essential concepts that enhance spatial data analysis and representation. This includes learning various terms, data models, and methods of engaging with spatial attributes.
Nodes and Vertices
Node: Represents a point on a graph, can be viewed as a specific location in a spatial context.
Vertex: The line (arc) connecting two nodes. It provides directionality in the spatial relationships. For instance, in a stream, nodes enhance the accuracy of depicting changes in flow direction.
Polygon: Defined when an arc connects back to its starting node forming a closed-loop. Polygons encompass areas in geographic mapping.
Data Models in GIS
Vector vs. Raster Data
Vector Data Model: Consists of points, lines, and polygons that represent various geographic features. Each feature can be linked to an attribute table that details the characteristics of each feature in a geographic space.
Raster Data Model: Uses a grid of identical cells to represent spatial information. Each cell holds a specific value which corresponds with an attribute. Raster models are efficient for continuous spatial data which often involves numerical values.
Structure of Raster Data
Composed of rows and columns, known as pixels or cells. Each pixel retains a value that represents the real-world characteristic or spatial parameter. This method suits continuous data such as temperature, salinity, or elevation.
Attributes and Classification in Raster Data
Attribute Representation
Raster values can be attributed in multiple forms:
Nominal: Identifies and categorizes without a numerical value (e.g., colors).
Ordinal: Represents ordered categories.
Interval/Ratio: Numerical representations that can include decimals.
Inputting Values into Raster Models
Attribute values allow characterization of the pixel within the GIS database. For example, colors can be attributed numerically:
Green = 1
Blue = 3
Yellow = 2
Spatial Resolution in Raster Data
The size of individual cells in the raster model directly influences spatial accuracy. Smaller cell sizes increase the accuracy of representation, allowing for finer detail of spatial variations.
Spatial Resolution: Refers to the size of each pixel; smaller pixels yield a higher spatial resolution, enhancing data clarity and granularity.
Utilizing GIS for Real-World Applications
WebGIS and ArcGIS Online
WebGIS: Allows wider access to spatial data and analytics through online platforms. Users can manipulate data without deep technical knowledge of GIS.
ArcGIS Online: Acts as a portal to create and share maps, use applications, and engage with various data sets. Users can build story maps and dashboards to visualize and communicate spatial data effectively.
Engaging with GIS
WebGIS democratizes the use of geospatial data, facilitating access for casual users and mobile workers. It enables the integration of tools for data collection, visualization, and real-time analytics.
Systems of Engagement: Modern GIS tools enable real-time data collection and sharing across various applications.
Conclusion and Future Explorations in GIS
Understanding the multitude of tools available in the GIS environment, including ArcGIS, enhances one’s ability to analyze spatial data effectively. The topics covered lay the foundation for further exploration in spatial analysis, geodesign, and decision-making processes utilizing GIS.
Future trends in GIS include the rise of machine learning and artificial intelligence, which promise to revolutionize how we interpret and utilize spatial data.
Additionally, the continued development of open-source GIS platforms will further democratize access to advanced geospatial tools, fostering innovation and collaboration in the field.