the science of climate change
Topic 3.2 The Future with Climate Change
Can we successfully respond to climate change?
Scientists know that global warming is occurring from evidence such as measurements of rising surface air temperatures and observations of retreating glaciers. They believe that global warming is largely caused by human activities, resulting in climate change. The Intergovernmental Panel on Climate Change (IPCC) warns that climate change can compromise our progress towards sustainable development. Climate change also impacts different aspects of our lives, including economic, environmental and social dimensions.
In this topic, students will learn about contemporary climate change. Students will first study contemporary climate change in relation to past changes in Earth's climate. This will provide students with a better understanding of anthropogenic contributions to contemporary climate change. Students will then examine how contemporary climate change might impact humans, deepening their understanding of human-environment interactions. Students will also explore possible responses to climate change, and the challenges associated with the planning and implementation of these responses.
- The Science of Climate Change
Is climate variability a new phenomenon in Earth's history?
- Evidence of past climate variability derived from proxy indicators through the study of ice and ocean cores
- Episodes of warming and cooling of Earth during the Quaternary period
Climate variability refers to the way in which aspects of the climate (such as those related to temperature and precipitation) differ from an average. Climate variability occurs at all spatial and temporal scales.
Climate variability is influenced by many factors, one of which being climate change. When we observe temperature and precipitation over a course of a few hours or days, it is referred to as weather which is constantly changing. When we look at weather patterns over a course of a few months, we get seasons - e.g., monsoon seasons. When we examine these weather patterns over a course of a few years, we start to notice fluctuations - e.g., the monsoon this year is not the same as the monsoon the year before or there are natural fluctuations like the ENSO. However, when we observe these fluctuations over a course of a few decades or centuries, these fluctuations may be better appreciated as climate change.
- The Quaternary period
The earth's history can be dated via the geologic time scale. Geologic time can be split into eons, eras, periods and epochs, in decreasing order. The onset of the Quaternary period marked a change in the Earth's climate from a period of very slow-B9oling over 50 million years to a period of great instability. The Quaternary can be further divided into two epochs, the Pleistocene and the Holocene. The Pleistocene, as seen from Figure f, is the first epoch of the Quaternary Period. We are currently in the Holocene Epoch of the Quaternary Period which began 0.01million years ago. (The Anthropocene Epoch is an unofficial unit of geologic time, used to describe the most recent period in Earth's history when human activity started to have a significant impact on the planet's climate and ecosystems.)
There were episodes of warming and cooling of Earth. On a longer time scale, the earth may experience ice ages. Within an ice age, there might be colder and warmer periods corresponding to glaciations and deglaciations. In the past few centuries, there were also times that the temperature is higher or lower than present day.
z
Epoch
0
..
0
0
..,
,: i--
/
.
Tertiary
B®n<laty
01t0f(M•l
o.on
2.6
$_,
2.\.0
(.)
,I
-
.1.\,9
ss
6(i
c.>
.0.N.,
0
1-16
::E
200
251
Phanerozoic
m
31K
:\.SY
416
,I.I
.is,
ProterozoiC
Edlacaran
5-12
-6..'
2500
..............
Hadcan
Archean
•••••• Noko<>ff«-·;;;:,;;,;,...•••.•• - 4000
ORIGIN Of EARTH - - 4:6t.0ll0ll -
...
• • •
,._,,,_
,.
Neo-
Cambrian
Ordovician
Silurian
jMinl111pplan
Devonian
/ IPCftntyfvt.nhm
Permian
0
N
0
;;
Q.
0 /
..
Triassic
Jurassic
cretaceous
r3 oocana
01,uoconc
Eocono
Mlocono
Pliocene
..nolQ. Gno
Plolstocono
Qu1tcrn ry
Period
Era
Eon
<(
ir
IX)
<(
0w 0:
D..
frki4.-•t Yffl.,c of .ryu.tH:,SIMH«.-.n • K..;..
=Z,= =. := =.:::.. t
=::r: Su
HOW'4, Jn.lOflhtJ.1A♦ouicM"<lt' ok.,.lo+ \O,M/ .
Figure 1: Geologic Time Scale
- Ice Ages
Looking at a broad span of the earth's history, the present climate is highly unusual. Most of the time our planet has been considerably warmer than it is today and it has been largely free of permanent (year-round) ice. In the mid-Cretaceous period for example, global average temperature is thought to have been anywhere from 5°C-15°C warmer than now.
Our warm planet was therefore only punctuated by some relatively brief ice ages. There is no evidence of ice ages during the first 2 billion of Earth's 4.5 billion years and the earliest ice age dates to about 2.3 billion years ago. Of the last 2.3 billion years, only 10% - 20% have been ice ages, according to one estimate. Though varying, the warm times persist for hundreds of millions of years to billions of years, whereas the ice_ages last on the order of
tens of millions of years_toper aps a hundred million years.
f\tvmvlettf)(\ ; ,ctlP efA9J?,
orit 1.0
l
00
1 0

20
3.0
/7/tiSfocBl'e
;ce
- J
4.0 '------ ----- ------'-------'------ -----.....L '
70 60 50 40 30 20 10 0
millions of years ago
Figure 2: Cooling of the global temperature (Ice Cover) since 55 MYA.
The Pleistocene
The Pleistocene is the geological epoch that lasted from 2.58 million to 11,700 years ago, spanning the Earth's most recent period of repeated glaciations. Within the Pleistocene, there was the Last Glacial Period (LGP) or the Last Ice Age, encompassing the period 115,000 to 11,700 years ago (occurred from the end of the Eemian to the end of
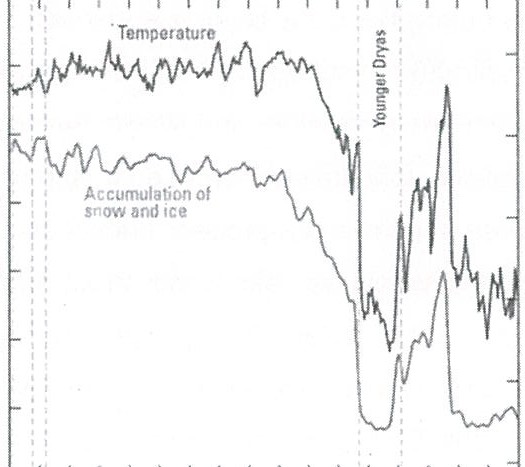
the Younger Dryas). Within an ice age, the climate is not uniform but oscillates. Figure 3 shows these oscillations in ice cover that give rise to glacial and interglacial cycles in the last 800,000 years:
 ·2
·2
.,
800 700 600 500 400 300
thoosonds of years ogo
2CO 100 0
l11i ;ce
Figure 3: Glacials and interglacials in the last 800,000 years
- The period of growth and outward spreading of great ice sheets is known as a
glaciation.
We can safely assume that glaciation is associated with a general cooling of average air temperatures over the regions where the ice sheets originated.
At the same time, ample snowfall must have persisted over the growth areas to allow the ice masses to grow in volume.
- The opposite kind of change is called a deglaciation.
CLUSTER 31 SUSTAINABLE FUTURE AND CLIMATE CHANGE
TOPIC 3.2 THE FUTURE WITH CLIMATE CHANGE
This involves shrinkage of ice sheets in depth and volume which would in turn result in the receding of the ice margins toward the central highland areas and eventual disappearance of the ice sheets.
As can be seen in figure 3, the planet is now in a warm interglacial, rivaled only a few times in the Pleistocene. One of these times was the last interglacial, which reached its peak
about 125,000 years ago and might have set the record for Pleistocene warmth. Global sea level was about 6 m higher than now, and the mid-latitude continental areas were 1°C - 3°C warmer. Between these two warm periods sits the most recent glacial period which is the Last Glacial Maximum, an event that reached its maximum about 20,000 years ago.
The Last Glacial Maximum (LGM)
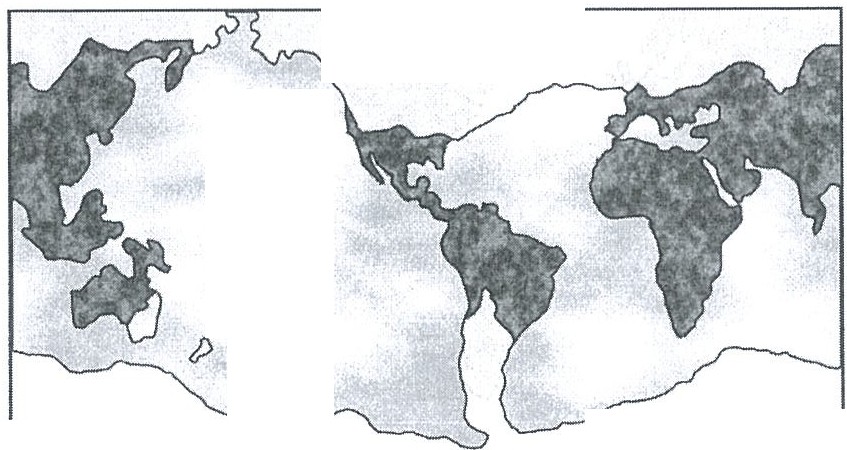
The Last Glacial Maximum (LGM) refers to the time when ice sheets were at their greatest extent 26,000 and 20,000 years ago. The maximum known spread of the last advance of the ice during this period is shown in figure 4:
- Ice covered a large percentage of North America, Europe and South America.
- The South Island of New Zealand, which today has a high spine of alpine mountains with small relict glaciers, developed a massive ice cap in late Pleistocene time.
- All high mountain areas of the world underwent greatly intensified alpine glaciation at the time of maximum ice-sheet advance.
o
Figure 4: Ice Coverage during the LGM
The main changes in the tropics were drier conditions and cooler temperatures. This is due to the larger volume of water that is stored in ice sheets during a glacial, meaning that less water is available for movement within the global hydrological cycle. Rainforest cover in West Africa was reduced and replaced by tropical grasslands because of a lack of rain. At the same time, most of the world's deserts expanded due to the lack of precipitation. The
CLUSTER 3 I SUSTAINABLE FUTURE AND CLIMATE CHANGE
TOPIC 3.2 THE FUTURE WITH CLIMATE CHANGE
rainfall pattern was also very much different then so that the coverage and location of the deserts have changed since the LGM.
- The Younger Dryas
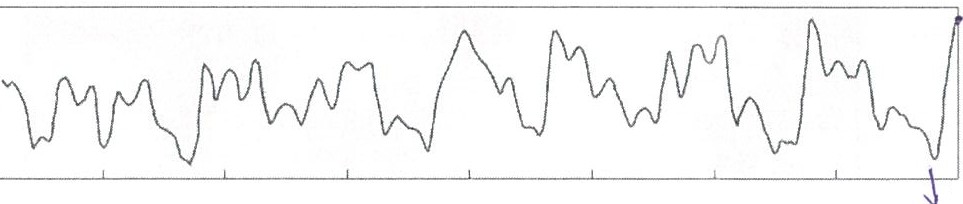
The other less significant period of cooling is the Younger Dryas which is characterised by near full glacial conditions (fig. 5) which began and ended suddenly about 11,700 years ago, forests quickly regained the ground that they had lost to cold and aridity. Ice sheets again began melting, though because of their size, they took about two thousand more years to disappear completely.
'- Uule Ice A e I lolo:cn< : Pki>t1>«1
I
rMod,ovolwa,mponod poch -;- I ro<h
·25 ..!-!.-,--,,.....,--.--,---r-.--r-r-r--'-r-,-,-,--,--,
.30
0.30
.35
025
·40
0.20
.45
0.15
.50
0.10
.55
-60 I I I I I I I I I I I I I I I I I I O 05
:::,
"'
.;;
;.:
u
l:l
a:
ffi
0
!,
u.J
§
i
0..
<C
a:
►
aff.i
"aw:'
tu
:::
z
0
:::,
:::::.,
u
<
0 10 15 17
THOUSANDSOFYEARS BEFOREPRESENT
Figure 5: Air Temperature for the Past 17 000 Years
- The Holocene
The Holocene is the geological epoch that began after the Pleistocene. As mentioned, it can be considered an interglacial in the current ice age. Although the Holocene has been warm, there have been fluctuations in climate on a millennial timescale. However, the temperature difference between glacials and interglacials is the least at the equator, compared to the poles. This often means that ecosystem change during glacial-interglacial transitions is limited in tropical areas.
Overall, the Holocene can be split into two periods. The Early Holocene was not just warmer than before, it was also generally wetter. Warmer air is able to hold more moisture, so higher temperatures leads to more evaporation, condensation and precipitation. This led to changes in vegetation cover as well as expansion pluvial lakes as described below.
- The Early Holocene
Expansion of savannas
CLUSTER 3 I SUSTAINABLE FUTURE AND CLIMATE CHANGE
TOPIC 3.2 THE FUTURE WITH CLIMATE CHANGE
Intense heating of the land during summer led to a strengthening of the monsoon systems which brought rainfall to the subtropics. Thus, for many parts of the subtropics, the early Holocene was considerably wetter than today. Much of the area now occupied by the central and eastern Sahara desert was able to support savanna ecosystems. This enhanced wetness extended into tropical West Africa in what is known as the "African Humid Period" and peaked around 9400 years before present. This explains the presence of human settlements in caves in the Sahara desert we see today. Since then, the weakening of the
monsoon has caused the Sahara to become a desert, leading to the more arid climate we see in West Africa today. "7More Aw diMaKc ZOl\e (.fro(YI BJ!,, .f Bw )
Expansion of lakes
Warmer and wetter conditions during the Early Holocene also led to the development of four mega pluvial lakes. The term pluvial describes any extended period of wet conditions.
Pluvial lakes refer to lakes which are landlocked and fill with water during periods with more precipitation. During pluvial periods, lake levels increased in arid regions. During dryer interpluvial periods, the reverse occurred in a process known as desiccation, which is the removal of moisture. One example would be Lake Chad, West Africa. Desiccation was not a constant process but occurred in a few cycles. During dryer interpluvial periods, higher evaporation and lower precipitation would have lowered lake levels. Thus, the lake split into 3 smaller lakes from approximately 5000 years ago. Only 2 lakes remain today and are at risk from continued climatic change and high agricultural usage.
- The Late Holocene
The post-glacial warming trend culminated in the so-called Climatic Optimum about 7,000 to 5,000 years ago, a time when the mean global temperature was somewhat higher (perhaps 1°C) than at present. However, there has been an increase in aridity since approximately 7000 years ago, characterised by reduced vegetation cover and the desiccation of pluvial lakes.
The Medieval Warm Period and the Little Ice Age
When looking at historic times, the global temperature also experienced much fluctuation in the last few centuries:
- The period A.o. 900-1200 is called the Medieval Warm Period whereby temperatures were warmer in the North Atlantic. However, there is also much physical and historical information indicating that this was not a global event of any significance.
CLUSTER 31 SUSTAINABLE FUTURE AND CLIMATE CHANGE
TOPIC 3.2 THE FUTURE WITH CLIMATE CHANGE
- Less ambiguous is the Little Ice Age spanning from 1450-1850, a cold period for western Europe. During these years, alpine glaciers advanced as temperatures fell by about 0.5-1°C.
In contrast to the Medieval Warm Period, the Little Ice Age is expressed in mountain records from around the world and represents the largest temperature change during historical times and is considered a global event.
1.3.4 Climate Since 1800s
The warming trend started around 1850s and continued till now. There are both natural and anthropogenic causes of climate change. It is now widely considered that the recent global warming may be the result of increasing greenhouse gas concentrations due to anthropogenic activities.
- Evidence of Past Climate Variability
Information about ancient climates must be obtained using a variety of evidence that has been influenced in some way by past climates. This information is also known as proxy
indicators which are evidence derived from, for example, the study of ice cores and ocean sediment.\Mn)rq,.\ recordr of climol£ varia M'1
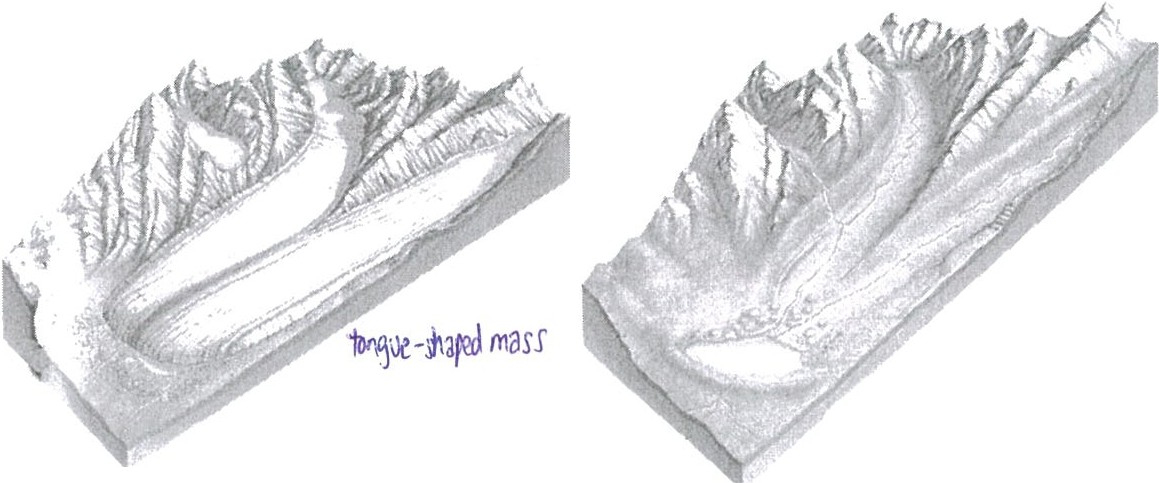
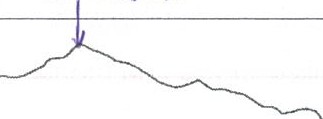
Figure 6: Advancement and retreat of glacier due to climatic
- 1 Glacier Evidence
The advance or retreat of glaciers (figure 6) is a clear response to variations in climate. Advancement of glaciers took place when there is a Jp,c se /.fAll in temperature while retreat of glaciers happened when temperature r',ses . Distinct signatures left on
the landforms by glacier erosion and deposition thus constitute evidence for climatic changes in the past:
CLUSTER 31 SUSTAINABLE FUTURE AND CLIMATE CHANGE
TOPIC 3.2 THE FUTURE WITH CLIMATE CHANGE
Features associated with glacier erosion.
As alpine glaciers expand down preexisting valleys, they widen out the lower reaches of the valleys and transform typical V-shaped valleys (associated with erosion by running water) to U-shaped ones.
Glaciers also often leave scratch marks, or striae, on solid rocks walls and valley floors, or polish exposed rocks to a very smooth finish.
Features associated with glacier deposition.
Unlike running water, flowing ice sheets are capable of moving very large sized sediment as effectively as small particles of sand, silt, and clay.
When the ice sheet melts away, its deposits, called tillites, can contain a very wide assortment of sediment sizes, from microscopically small clays to very large boulders.
Thus, poorly sorted deposits often exist along the past margin of an ice sheet and indicate the extent of past glaciation.
It has been found that most glaciers in the northern hemisphere have shown a decrease in size in the 20th century. In fact, many glaciers in the European Alps have decreased by as much as a third. Perhaps this reflects a general rise in temperatures.
However, there are exceptions, like the Hubbard Glacier in Alaska that surged in 1986 advancing at a rate of 12 m a day. This suggests that glaciers also respond to local climatic conditions as well as reflecting wider spatial changes.
2 Ocean Sediment Evidence
Ever since the late 1960s, the National Science Foundation has been involved in a major international ocean-drilling program. The Deep Sea Drilling Project and its successor, the Ocean Drilling Program, have used specially designed research vessels capable of drilling into the ocean floor and collecting cores of deep-sea sediments. The sediment cores proved to be excellent sources of useful data that have greatly expanded our understanding of past climates:
- Although seafloor sediments are of many types, most contain the remains of organisms, like the bones and shells of plankton and other animal life (made largely of calcium carbonate), that once lived near the sea surface.
- When such near-surface organisms die, their shells slowly settle to the floor of the ocean, where they become part of the sedimentary record. The more recent material will thus constantly bury the older material previously laid down.
CLUSTER 3 I SUSTAlNABLE FUTURE AND CLIMATE CHANGE
TOPIC-3.2 THE FUTURE WITH CLIMATE CHANGE
- One reason why seafloor sediments are useful recorders of worldwide climatic change is that the numbers and types of organisms living near the sea surface change as the climate changes.
- Thus, in seeking to understand climatic change, as well as other environmental transformations, scientists have become increasingly interested in the huge reservoir of data in seafloor sediments.
The information contained in the oxygen in the calcium carbonate is also most important for determining past climates because it allows oxygen isotope analysis to be carried out:
- Most oxygen atoms have an a1Q:micwe1ght of 16 (160), but a small percentage of oxygen atoms contain 1WQ.additIonalneutro-ns,peratom, making their atomic weight 18 (180).
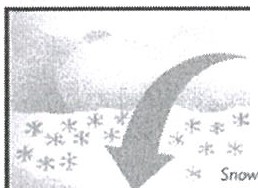
Icesheet ,_..,
tnric: Ino:cyiffi-16
u,wsenlevel
O<,an depleted"' oxyeer>-16
(0"/0'• rotio incJ'eaud/
lrtii\ io
- Both isotopes exist in ocean water, and both get incorporated into the shells and bones of marine animals.
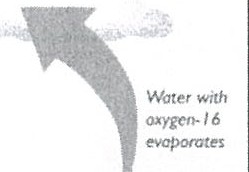
- If the ratio of 180 to 160 in the water is relatively high, it will also be high in the sea life
Hrgh
'"" /,:ve/
Ocean enr,d,ed in /6
/0' 101 nwo_d«, •
i 1 ·a1PmoJ
Figure 7: The ratio of the oxygen isotopes varies during glacials and interglacials.
living in that water.
 Because 160 is lighter than 180, water containing
ta..ier 11taining·18O.
1,0'.i>_JUUL'CJ .-eadily,than
- Thus, according to figure 7, when ffl§.ciers are expanding, the oceans (and the oxygen-containing calcium carbonate in shells and bones) will have@latWel-y'tligh fi"o/16O ratiosJ as more of the 160 water is removed from the ocean and deposited as snow onto the growing ice sheets.
- When the organisms die, they sink to the ocean bottom where their calcium carbonate is deposited.
- The ocean bottom thereby maintains a record of climate through the varying ratios of
180/160 in its layers.
CLUSTER 3 I SUSTAlNABLE FUTURE AND CLIMATE CHANGE
TOPIC 3.2 THE FUTURE WITH CLIMATE CHANGE
- This enables scientists to extract cores of the ocean-bottom material, note the isotope ratios, and infer past changes in global ice volume.
2.3 Ice Core Evidence
A second use of the oxygen isotope technique is applied to the study of ice cores taken from ice sheets:
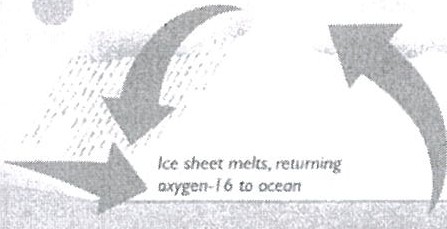
- When snow is deposited onto existing glaciers, the oxygen in the H20 may be either
180 or 160, and the ratio is influenced by temperature.
- More 180 is evaporated from the oceans when temperatures are high and less is evaporated when temperatures are low.
- As a result the heavy isotope is more abundant in the precipitation of warm eras and less abundant during colder periods.
 Thus on the ice caps, scientists from Europe and the United States have been drilling through the ice and extracting
cores nearly 3 km deep to infer past temperature patterns.
They have for instance determined 180/160 ratios for deep ice cores obtained from the Greenland and Antarctic ice sheets through the 1993 US
Greenland Ice Sheet Fi ure 8: Bubbles of air trapped in ice.
Project II (GISP2) which
was carried out in parallel with a European project, GRIP (Greenland Ice Core Project).
These efforts represent the latest of a number of attempts to date accurately the
shifts from glacial to interglacial periods.
CLUSTER 31 SUSTAINABLE FUTURE AND CLIMATE CHANGE
TOPIC 3.2 THE FUTURE WITH CLIMATE CHANGE
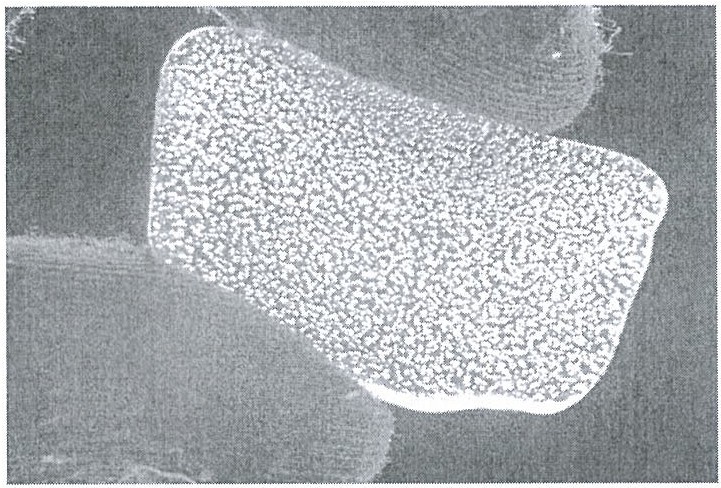
In addition to the temperature data obtained from isotope ratios, ice cores provide information on the past chemistry of the atmosphere
- As new snow falls onto a glacier. microscopic !:>_l!bbles onhe ambient air become P.fflJ!lanently trapped in the ice (figure 8).
- The concentration of carbon dioxide and other trace gases in these bubbles yields a lo ng-term record of their varying levels in the air.
- Among the more interesting results from chemical analyses at the cores is the sJrong correlation between past temperatures and carbon dioxide concentrations.
Past periods of high temperature coincided with high concentrations, whereas glacial periods coincided with reduced concentrations.
For some scientists, this result supports the notion that there may be future climate warming as a result of the emission of greenhouse gases.
Ice sheets also provide valuable information about major volcanic eruptions:
- When such eruptions occur, some of the dust ejected into the atmosphere settles on the tops of glaciers and researchers can determine when heavy volcanic activity occurred by noting the depth of the dust layers within the cores.
- The chemical composition of aerosols deposited in glacial ice also provides information on past events, with high acidities implying increased volcanic activity.
- This information may prove to be valuable in determining the importance of volcanic activity as a causal factor for climatic change.
fl ciu.l ]Jl IPCio.)
Mire 180 Lm 'o
ow n colt
Ice cort
l!is 160 Ntxe "o
lei'.!' l{o Mdrt tD
rlore "o l,esr 160
- The Science of Climate Change
Can natural factors fully account for contemporary climate change?
- Natural factors influencing temperature variability in the Quaternary period: changes in solar output
changes in thermohaline circulation
changes in ice sheets
- Influence of these natural factors on temperatures through feedback mechanisms
Changes in global climate occur on wide variety of time and spatial scales. This recent rise in temperature therefore may be part of the natural variability in climate, or it may mark the onset of human-induced warming from the emission of greenhouse gases into the atmosphere. This section will explore the natural factors and temperature variability in the Quaternary period.


Changes in Solar Output
Among the most persistent hypotheses of climatic change have been those based on the idea that the sun is a variable star and that its output of energy varies through time. The effect of such changes would seem direct and easily understood-increases in solar output would cause the atmosphere to warm and reductions would result in cooling. Still, there is at least one major drawback- no major long-term variations in the total intensity of solar radiation have yet been measured outside the atmosphere. Such measurements were not possible until satellite technology became available. Now that it is possible, records will be necessary for many years before we begin to get a feeling of how variable energy from the sun really is.
Sunspots Cycle
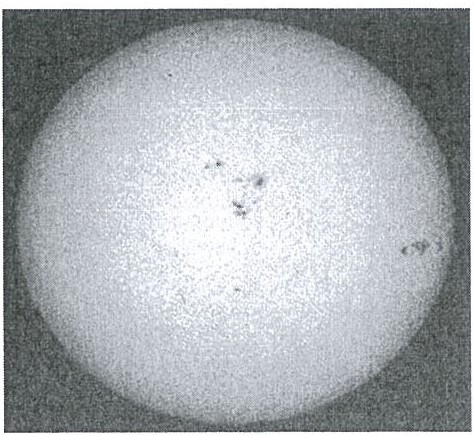 Several proposals for climatic change, based on a variable sun, relate to sunspot cycles. The most conspicuous and best-known features on the surface of the sun are the dark blemishes called sunspots (fig. 1a), that appear to be related to some changes in the solar output on the order of 0.1% - 0.2%.
- Although their origin is uncertain, it has been established that sunspots are huge magnetic storms that extend from the sun's surface deep into the interior.
- Along with other solar activity, the number of sunspots Fi!=!ure 1a: Sunspots.
increases and decreases on a regular basis, creating a cycle of about 11 years.
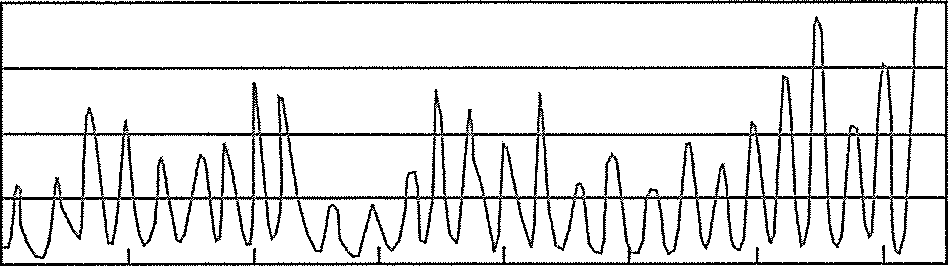
- A curve of the annual number of sunspots, beginning in the early 1700s, appears to be very regular (fig. 1b).
m C::,
m
0
200
 150
150
<ii 100
D
E::, 50
C
0::,
0
C
C 1700
0
1740 1780 1820 1860 1900 1940 1980
Figure 1b: Mean annual sunspot numbers.
Studies indicated that there have been prolonged periods when sunspots were absent or nearly so. Moreover, it was found that these events corresponded closely with cold periods in Europe and North America. For example, a period of minimal sunspot activity between about 1645-1715 coincided with one of the coldest periods of the Little Ice Age. Conversely, periods characterized by plentiful sunspots were found to correlate well with warmer times in these regions. 15
G1obal Surface Temperature

um. 1 0
"e'n
0
05
E
*
"fJ'
O"
0.0
13GB
1367
<b 1366
a.
B
:'.:>
1365
19--1-:IU 19---85 1·9-9--0 1995 2000 2005
Figure 2: Correlation between solar energy and temperature.
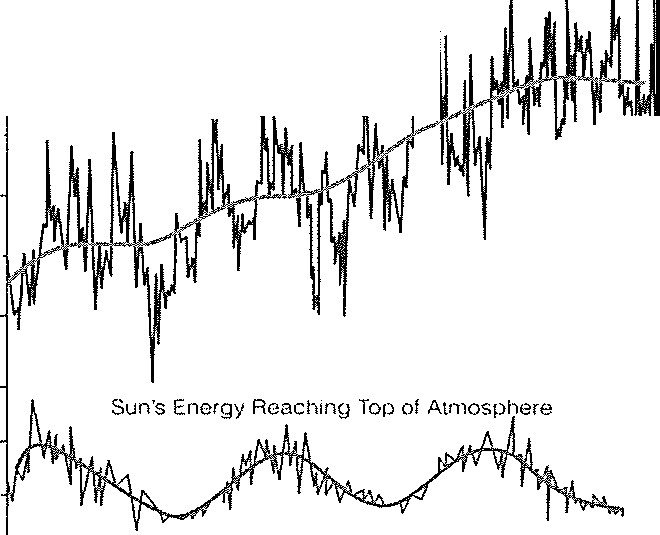
However, some scientists seriously questioned this conclusion:
- Subsequent investigations using different climate records from around the world that failed to find a significant correlation between variations in solar activity and climate.
- A comparison of levels of solar energy to surface temperatures shows that the surface temperature continues to rise even during a drop in the sun's energy (fig.2). The correlation between inso\ation amount and temperature is thus not always positive.
The Astronomical Theory


Not related to changes in output from the sun per se, the Astronomical Theory is based on the idea that variations in the earth's orbit influence climate by changing the seasonal and latitudinal distribution of incoming solar radiation (orbital forcing). Milutin Milankovitch, a Yugoslavian astronomer, formulated a comprehensive mathematical model based on the following elements:
- Variations in eccentricity (the shape of the earth's orbit about the sun)
- Changes in obliquity (the tilt of the Earth's axis)
- Precession of the equinoxes (the wobbling of the earth's axis)
Using these factors, Milankovitch calculated variations in insolation and the corresponding surface temperature of the earth back into time in an attempt to correlate these changes with the climatic fluctuations of the Quaternary period.
Variation in Eccentricity
Although variations in the distance between the earth and sun are of minor significance in understanding current seasonal temperature fluctuation, they may play an important role in producing global climatic changes on a time scale of thousands of years. Currently, the earth's orbit is slightly elliptical instead of circular. As a result the planet is about 3% closer to the Sun on January 4 (i.e. during perihelion when our planet is closest to the sun) than on July 4 (i.e. during aphelion when the earth is farthest from the sun)-a distance of 147 million km during the former as compared to 152 million km during the latter (fig. 3b).
This small difference in distance means that the earth receives about 6% more solar energy at the top of the atmosphere in January than in July. Such is not always the case, however. The shape of the earth's orbit changes during a cycle that astronomers say takes between 90,000 and 100,000 years. It stretches into a longer ellipse and then returns to a more circular shape (fig. 3a). When the orbit is very eccentric, the amount of radiation received at closest approach (perihelion) would be on the order of 23% to 30% greater than at aphelion. This would most certainly result in a substantially different climate from what we now have.


a)
circular orbit


b)
northern hemisphere summer
northern hemisphere winter
aphelion
perihelion
\
Figure 3: Changes in the eccentricity of the earth's orbit.
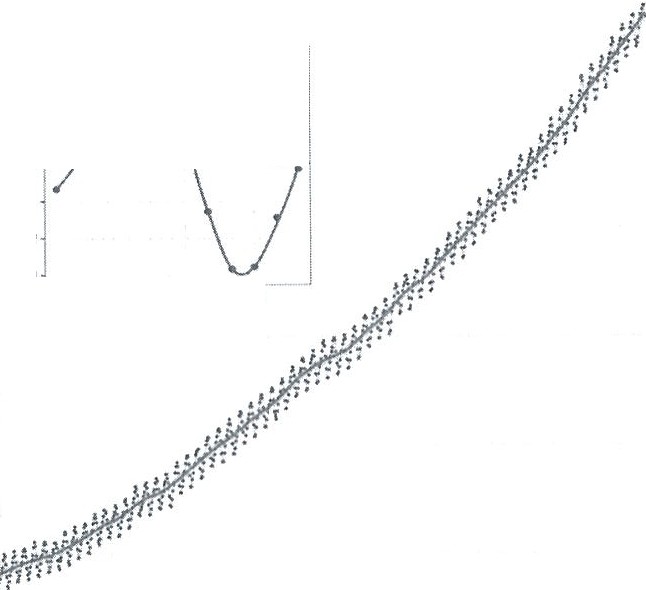
Changes in Obliquity
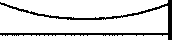
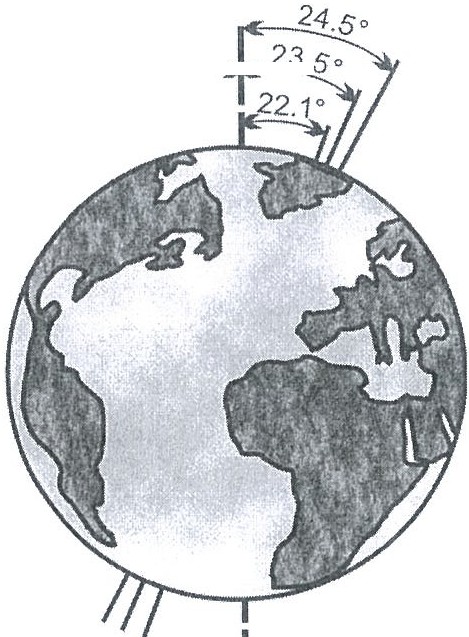
We have seen that the inclination of the earth's axis to the plane of the ecliptic was shown to be the most significant cause for seasonal temperature changes. At present, the angle that the earth's axis makes with the plane of its orbit is about 23.5°.


However, this angle changes.
During a cycle that averages about 41,000 years, the tilt of the axis varies between 22.1° and 24.5° (fig. 4). Because this angle varies, the severity of the seasons must also change-the smaller the tilt, the smaller is the temperature difference between winter and summer.
It is believed that such a reduced seasonal contrast could promote the growth of ice sheets. Because summer temperatures would be cooler, meaning that less snow would melt. As ice and snow has a high albedo, more insolation will be reflected back to space and
Fig 4: Changes in obliquity.
present tilt M. ':'...:.:
less absorbed. This means cooler temperatures and more area will be covered with snow
and ice. The result could be the growth of ice sheets to promote glaciation. Large glaciers, such as those currently occupying most of Greenland and Antarctica, are therefore most likely to expand when seasonality is low.
Variation in Precession of Equinoxes
The earth is wobbling (fig. 5) as it spins on its axis. At present, the axis points toward the Star Polaris (often called thEl North Star).
However, about the year A.o. 14,000, the axis will point
toward the bright star Vega, which will then be the North Star. Because the period of precession is about 26,000 years, Polaris will once again be the North Star by the year 27,000.
As a result of this cyclical wobble of the axis, a climatically significant change must take place. When the axis is tilted toward Vega in about 12,000 years, the orb.iill!...Qositions at which the wintef and summer solstices occur will be reversed. Consequently, the northern hemisphere will experience winter near aphelion and
Vega
Fig 5: Precession of equinoxes.
precession
North Ste
summer will occur near perihelion. Thus, seasonal contrasts will be greater because winters
will be colder and summers will be warmer than at present.
CLUSTER 31 SUSTAINABLE FUTURE AND CLIMATE CHANGE
TOPIC 3.2 THE FUTURE WITH CLIMATE CHANGE
 In explaining climatic changes that result from these three variables, it should be pointed out that they cause little or no variation in the total annual amount of solar energy reaching the ground. Instead, their impact is felt because they change the degree of contrast between the seasons.
However, the expected changes in temperature caused by changes in insolation via orbital forcing are too small to explain the large temperature changes required for the vast ice expansions and retreat recorded. In fact, there appears to be a 4-6°C shortfall. Also, positive feedback mechanisms on earth are responsible for magnifying the initial changes in insolation received.
- Changes in Thermohaline Circulation
- What is thermohaline circulation?
The thermohaline circulation in Earth's oceans describes theia>otinuous large-scale movement of ocean currents due to differences in temperature and salinity in different bodies of water. These differences result in a change in density of water as the density of seawater is determined by its salinity and temperature. This circulation is key as it is a deep ocean system that transports heat away from the equator towards the poles, allowing for an overall equilibrium in the Earth's oceans to be achieved.
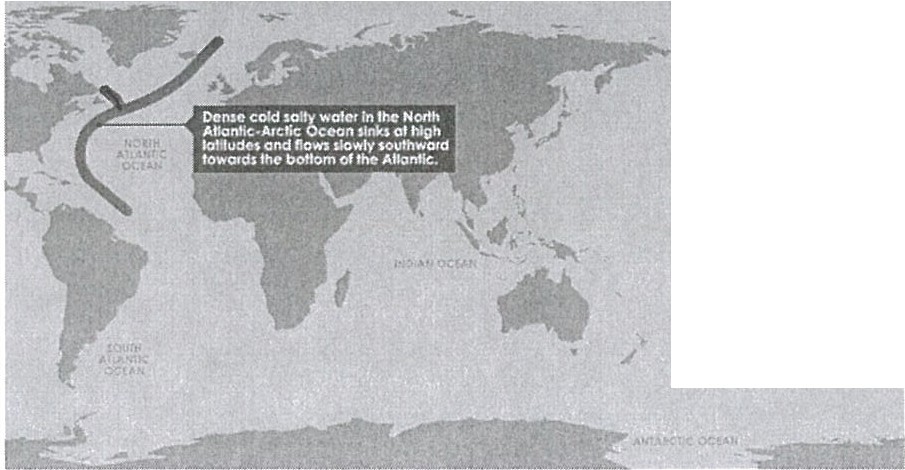
Cold water is usually denser than warmer water. As such, when a body of water which is denser meets surrounding less dense water, it sinks. This sinking motion forces water at the bottom of the oceans up in a large circulation system. Across the world, regions in oceans where.,.cold, salty water sinks are termed as 'downwelling zones'. At the moment, the two most important regions where these downwelling zones can be found are the North Atlantic Arctic Ocean and the Antarctic Ocean. It is at these two locations where we see the 'beginning' of the thermohaline circulation. (Fig. 6)
&PtW t u-.
'!-'
•
CLUSTER 3 J SUSTAINABLE FUTURE AND CLIMATE CHANGE
TOPIC 3.2 THE FUTURE WITH CLIMATE CHANGE

CLUSTER 3 I SUSTAINABLE FUTURE AND CLIMATE CHANGE
TOPIC 3.2 THE FUTURE WITH CLIMATE CHANGE
utc,c ::.'-tA
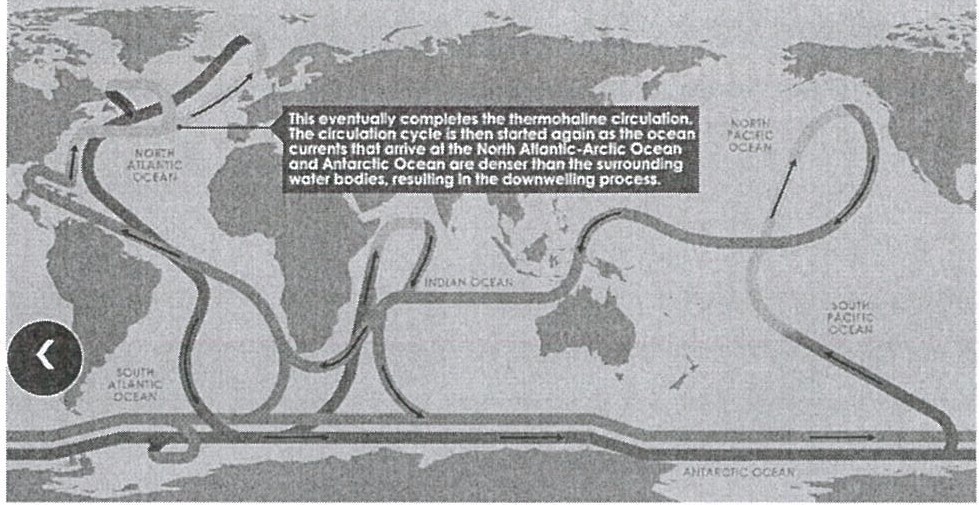
Figure 6: Thermohaline Circulation
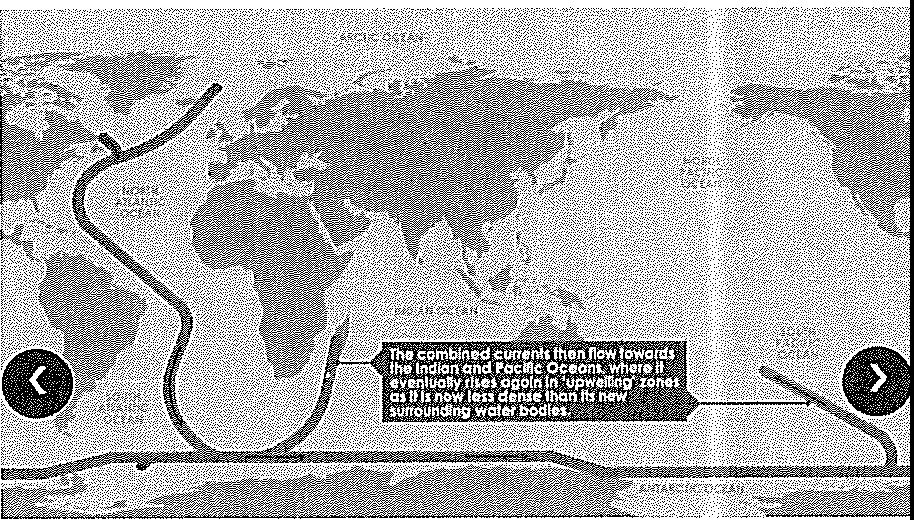
As we can see from the different stages in Fig. 6, the dense cold salty water in the North Atlantic-Arctic Ocean sinks at high latitudes and flows slowly southward towards the bottom of the Atlantic Ocean as a deep-water ocean current. When it eventually reaches the edge of the Antarctic continent, this current merges with another cold, salty deep-water ocean current that is flowing northwards from the Antarctic Ocean.
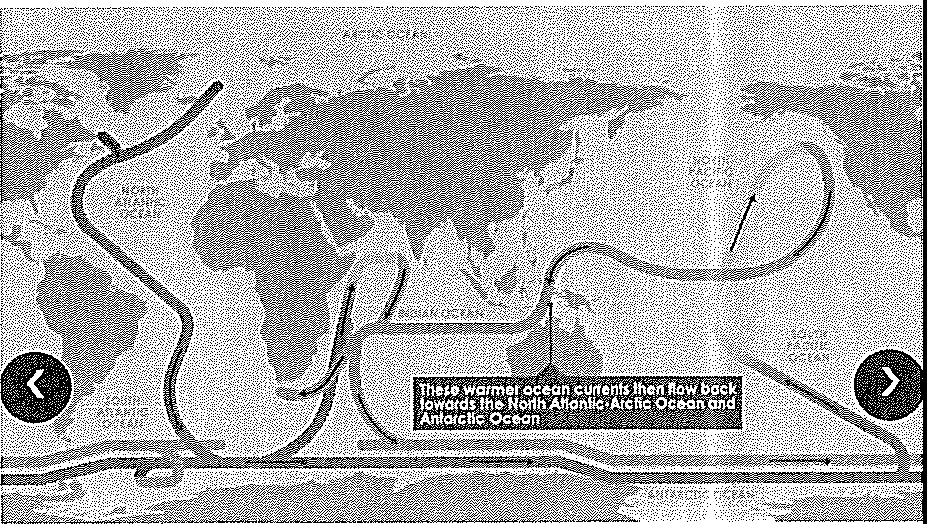
The combined currents result in a large mass of deep cold water which then flows towards the Indian and Pacific Oceans, where it eventually rises again in 'upwelling zones' as it is now less dense than its new surrounding water bodies. These warmer ocean currents then flow back towards the North Atlantic-Arctic Ocean and Antarctic Ocean completing the thermohaline circulation. The circulation cycle is then started again as the ocean currents that arrive at the North Atlantic-Arctic Ocean and Antarctic Ocean are denser than the surrounding water bodies, resulting in the downwelling process.
Aside from transporting heat away from the equator towards the poles, the thermohaline circulation system also acts as a pump that transfers carbon dioxide and nutrients from the surface of the oceans to the deeper waters and then back to the surface again. This contributes to the sustenance of life in the ocean. Finally, changes in sea surface temperature can also affect precipitation.
However, the relationship between thermohaline circulation and climate change is still an active area of research, fglAf'tic l-if"Wlah'ul) A"f Jld down 30'/. le 1157 C, 1001. &H
Aitt .mows ff "fPiAiir'll core, tion het coo, fe<igJr Arr) ol /ftfA11t;c clW/t:fi!YI,
1 ,fl, m not 6e due to te111rtm1tre1ooi
- Changes in Ice Sheets
CLUSTER 3 I SUSTAINABLE FUTURE AND CLIMATE CHANGE
TOPIC 3.2 THE FUTURE WITH CLIMATE CHANGE
As mentioned on p.3, the period of growth and outward spreading of greatice sheets is known as a glaciation. The opposite kind of change is called a deglaciation. The changes in ice sheets and its influence on temperature can be explained in the next section under feedback mechanisms.
Feedback Mechanisms
Because climate is a very complex interactive physical system, scientists must consider many possible outcomes when one of the system's elements is altered. These various possibilities, called climatic feedback mechanisms, not only affect temperature but also add greater uncertainty to climatic predictions.
In the context of the Earth's climate system, feedback mechanisms occur when a change in one climate variable results in a change in a second variable with this change ultimately leading to an additional change in the first variable. Simply put, the first variable is receiving feedback from the response of the second variable resulting in further change in the first.
Positive Feedback Mechanism-Changes in Ice Sheets
A positive feedback mechanism produces results that amplify the initial change. Change in ice sheets is related to the change in the earth's albedo with temperature changes:
- Because ice has a higher albedo than most other natural surfaces, the melting of large continental ice sheets and floating sea ice due to the higher temperature would replace a highly reflective surface with a relatively dark surface.
- The result would be a substantial increase in the amount of solar energy absorbed at the surface.
- This, in turn, would feed back to the atmosphere and amplify the initial temperature increase created by higher levels of greenhouse gases.
- It is largely for this reason that middle and high latitudes might show larger changes in temperatures than low latitudes (where the absence of much ice means that this positive feedback does not work) due to the enhanced greenhouse effect.
Changes in Cloud Cover
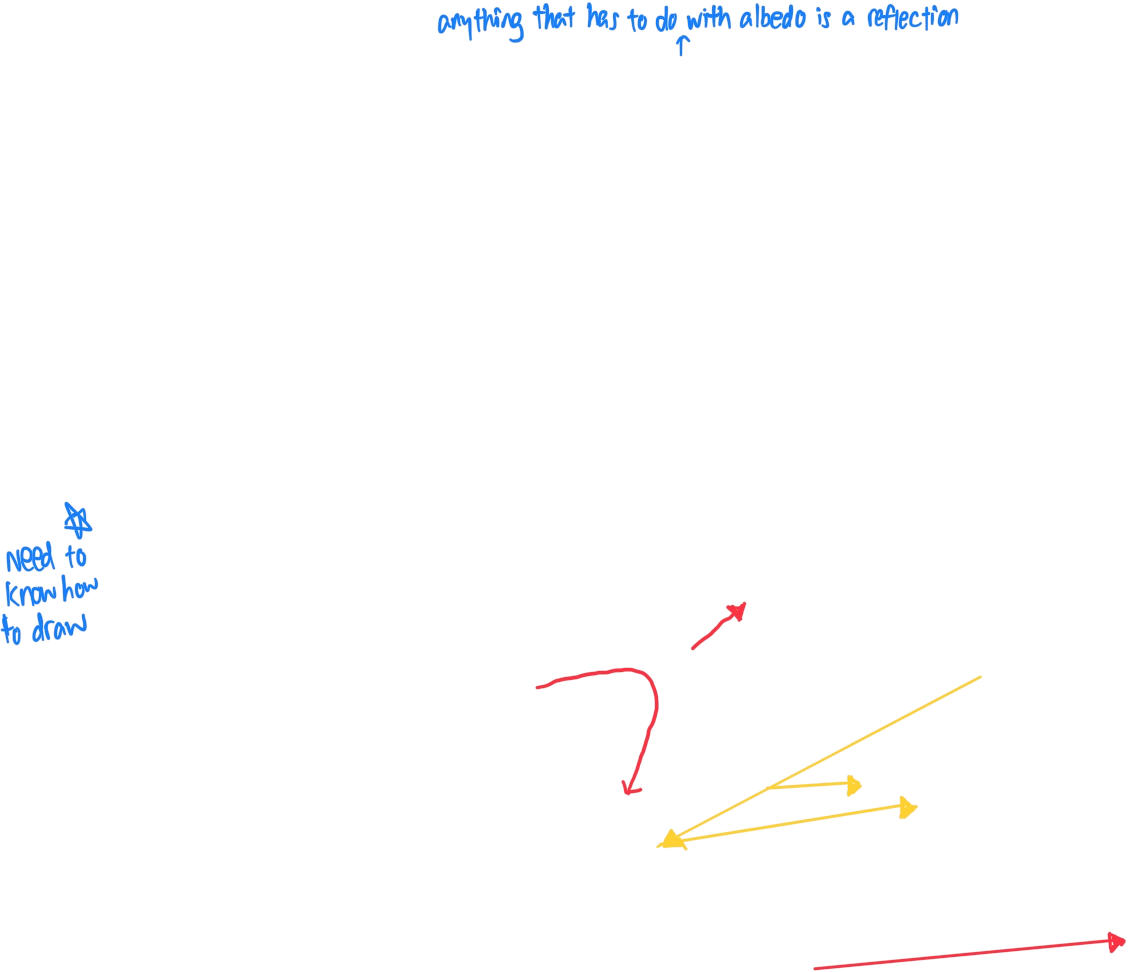
Negative feedback mechanisms produce results that are just the opposite of the initial change and tend to stabilize or offset it. For example, one probable result of rise in sea surface temperatures would be an accompanying increase in cloud cover due more evaporation and higher moisture content of the atmosphere:
- Most clouds are good reflectors of solar radiation.
CLUSTER 31 SUSTAINABLE FUTURE AND CLIMATE CHANGE
TOPIC 3.2 THE FUTURE WITH CLIMATE CHANGE
- At the same time, however, they are also good absorbers and emitters of terrestrial radiation.
- Consequently, clouds produce two opposite effects.
They act as a negative-feedback mechanism because they increase albedo and thus diminish the amount of solar energy available to heat the atmosphere (fig. 7).
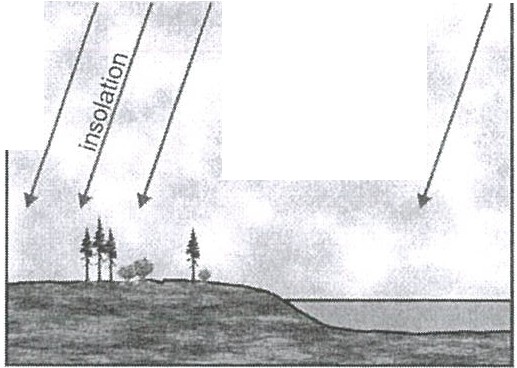
faJ
insvolativon reflected
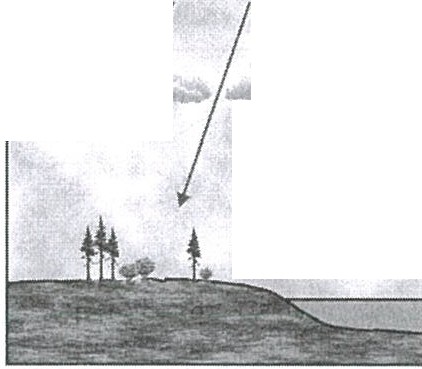

b)\j \J
more clouds
insvolativon revflected
increased evaporation due to
higher temperature
Figure 7: More insolation reflected due to increased cloud cover and albedo.
On the other hand, clouds act as a positive-feedback mechanism by absorbing and emitting terrestrial radiation that would otherwise be lost from the troposphere.
- Atmospheric modeling shows that the negative effect of a higher albedo is more dominant. Therefore, the net result of an increase in cloudiness should be a decrease in air temperature.
However, the magnitude of negative feedback of clouds is believed to be less great than the positive feedbacks caused by added moisture and decreased sea ice. Thus, although increase in cloud cover may partly offset a global temperature increase, climatic models show that the ultimate effect of the projected increase in carbon dioxide and trace gases due to human activities will still be a temperature rise.


- The Science of Climate Change
How significant is the influence of human activities on Earth's climate compared to natural factors?
- Consensus within the scientific community, represented by the Intergovernmental Panel for Climate Change (IPCC), that climate change in the last two centuries is unequivocal and it is very likely caused by human activities
- Influence of human activities on the global carbon cycle: activities that increase carbon emissions
activities that reduce carbon sinks
- Enhanced greenhouse effect due to the increased concentration of greenhouse gases by human activities
- Role of human activities in:
accelerating warming through positive feedbacks suppressing warming through negative feedbacks
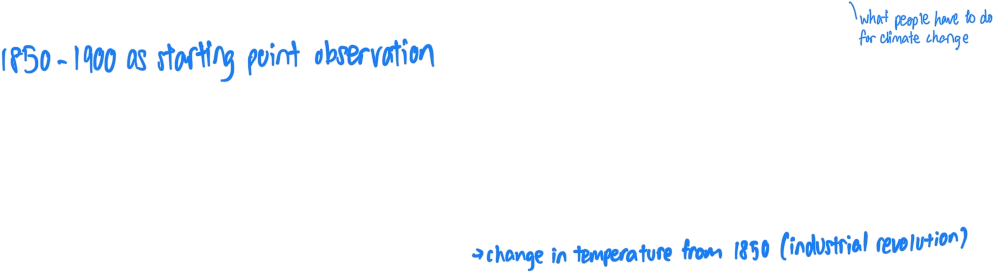
Contemporary Climate Change refers to the change in the state of the climate that persists for an extended period of time, typically decades or longer, in more recent times. The Intergovernmental Panel on Climate Change (IPCC) uses the reference period of 1850-1900 as a starting point of observation.
Intergovernmental Panel on Climate Change (IPCC)
The Intergovernmental Panel on Climate Change (IPCC) was established in 1988 by two United Nations organizations, the World Meteorological Organization (WMO) and the United Nations Environment Programme (UNEP), to evaluate the risk of climate change brought on by humans. The IPCC does not carry out research, nor does it monitor climate or related phenomena. One of the main activities of the IPCC is to publish special reports on topics relevant to the implementation of the UN Framework Convention on Climate Change (UNFCCC). The UNFCCC is an international treaty that acknowledges the possibility of harmful climate change; implementation of the UNFCCC led eventually to the Kyoto Protocol.
IPCC's Assessment Reports (AR) are widely cited in almost any debate related to climate change. National and international responses to climate change generally regard the UN climate panel as authoritative. The stated aims of the IPCC are to assess scientific information relevant to:
- human-induced climate change,
- the impacts of human-induced climate change,
- options for adaptation and mitigation
Climate Change in the Last 2 Centuries
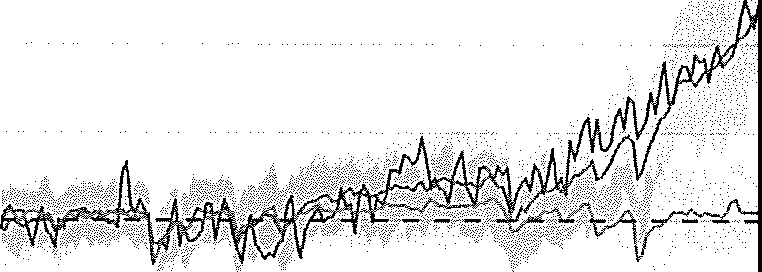
From Fig. 8, the red line denotes a significant increase in global mean surface temperatures from 1900 onwards. However, Fig. 8 further reveals to us the stark difference when we compare the simulation of the role of natural factors against human factors. For example, by paying attention to the line in green, there was only a small increase of about 0.05°C over the span of 170 years. Comparatively, when we factor in the role of human factors and focus on the line in purple, we see that the inclusion of human factors has resulted in a significant increase of almost 1.2°c.


Human influence has warmed the climate
Change in average global temperature relative to 1850-1900, showing observed temperatures and computer simulations 2.0C
1.SC
 1.0C
1.0C
Observed Simulated human & natural factors
0.5C
o.oc
-0.SC --- --- --- -
Simulated natural factors only
1850 1900 1950 20002020
Note: Shaded areas show possible range for simulated scenarios
Source: IPCC, 2021: Summary for Policymakers [;][;)[!I
Figure 8: change in average global mean surface temperatures relative to 1850-1900 showing observed temperatures and computer simulations
Undeniably, this reveals to us that contemporary climate change is most likely caused by humans and it is occurring much faster than natural geologic climate change. A key contributing factor is the high emission of greenhouse gases that arise from human activities.
Predicted Future Temperature Changes
Although no models yet incorporate the full range of potential influences and feedback mechanisms, it appears that the consensus in the scientific community is that the increasing levels of atmospheric carbon dioxide and trace gases will lead to a warmer planet with a different distribution of climatic regimes:
- Sophisticated computer models of the atmosphere, known as General Circulation Models (GCM), show that the warming of the lower atmosphere triggered by carbon dioxide and trace gases will not be the same everywhere (fig. 9).


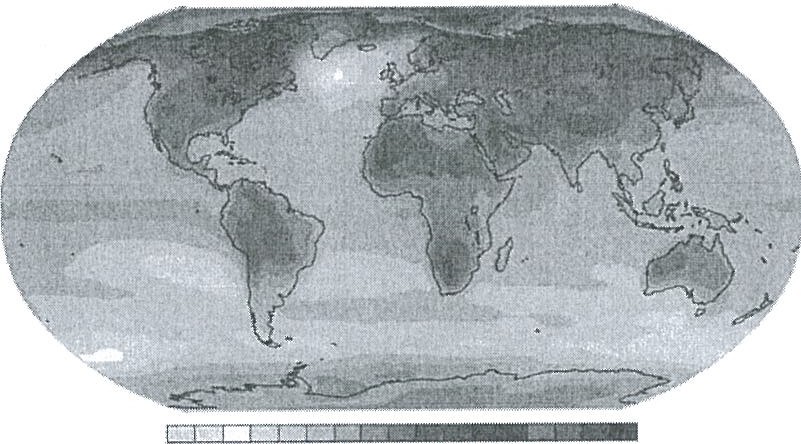
-o- ojf 1 1.5 2 2.s 3 3.5 4 4.s s 5.5 6 6.s 1 1.s
(OC)
Figure 9: Predicted temperature changes by 2100
- Rather, the temperature response in the polar regions could be as much as two to three times greater than the global average.
- Part of the reason for such a response is the fact that the polar troposphere is very stable.
- This stability suppresses vertical mixing and thus limits the amount of surface heat that
is transferred upward.
- In addition, as explained above, an expected reduction in sea ice would also contribute to the greater temperature increase.
In 2001, the IPCC used the results of recent GCM runs to predict the range of possible outcomes from elevated atmospheric carbon dioxide concentrations. Their models indicated a 'worst-case' outcome resulting in an increase in global average temperature of as much as a 5.8°C in the year 2100, relative to the 1990 value.
In its previous report issued in 1995, the panel predicted a worst-case increase of 3.5°C. The difference in the two forecasts arose because the new estimate incorporated the reduction in sulfuric particulates in the atmosphere due to environmental regulations. These particulates have suppressed global warming by reducing the amount of insolation reaching the surface (global dimming) and the reduction of these aerosols may reduce the degree to which they suppress further warming.
In 2007, the IPCC again estimated that Earth's average surface temperature will likely rise by
1.6°C - 3.4°C over the next century and possible more than 5°C in some places. This global warming, a significant part of climate change, compares with a rise of 4°C since the last glacial maximum 20,000 years ago.
In its 2023 AR6, the IPCC highlighted the following key points
- Global surface temperature was 1.1°C higher in the decade between 2011-2020 than between 1850-1900.


- Vulnerable communities who have historically contributed the least to current climate change are disproportionately affected.
- The rate at which temperatures continue to rise depends on how much carbon dioxide humans emit in future years. This could be affected by economic conditions, population growth, and greater use of alternative energy, among other things.
- Even if no additional greenhouse gases were added to the atmosphere after the year 2023, temperatures would continue to increase because of heat slowly released from the warmed oceans.
- There is now certainty that the increase in mean global mean surface temperatures will exceed 1.5°C by 2040 at its latest, if greenhouse gas emissions are not significantly reduced.
Long Term Carbon Dioxide and Temperature Variations
Many believe excess carbon dioxide released by human activities is partially responsible for the trend outlined above. Since carbon dioxide is an important absorber of outgoing longwave terrestrial radiation, it follows logically that any change in the atmosphere's carbon dioxide content could alter temperatures in the lower troposphere.
This believe was strengthened when it was found that 10
there is a close relationship between the carbon 2:
dioxide content in the atmosphere and the earth's m
a
temperature since hundreds of thousands of years
1=
.i:i
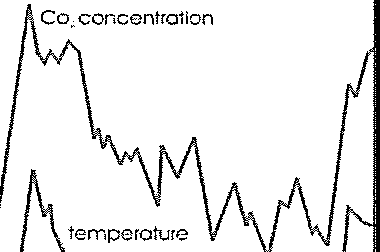
300
200
ago: ; 0
u!!'
!!J
1,
1l.
160 120 80 40
100
Presen1
u
uo'
time before present (1housonds of years)
Figure 10: Correlation between temperature and CO2 conte
as suggested by ice core evidence
CLUSTER 3 I SUSTAINABLE FUTURE AND CLIMATE CHANGE
TOPIC 3.2 THE FUTURE WITH CLIMATE CHANGE
- Figure 10 shows the fluctuations in both the carbon dioxide content and the temperature over the last 160,000 years.
- This graph, deduced from ice cores taken at Vostock in Antarctica, shows that periods
of higher temperature coincide with higher carbon dioxide content and vice versa.
- One possible explanation for this correlation is the carbon dioxide induced greenhouse.
Recent Measurement of Carbon Dioxide Content
Since 1958, continuous measurements of carbon dioxide concentrations have been made at Mauna Loa Observatory in Hawaii (fig.11). This is known as the Keeling Curve.


Monthly mean CO2 concentration
Mouna Loa 1958 • 2022
--
•••••••.. •.. •••--• -••..•·••••••--•••••••.. •
·••h•-••"'"' •
·7
l
-
I
.5
-
c:-
-"
.g
8N
,.
""'

Seasonal variation
t ?
J
; ,
i
>- 0
E_g ,
i '
;
0,
0 3
'""
....................... _ .. ·-· 1
Arft ,lu1 Oct
Month
400
I
E
:)80
- -=
c:-
I
".!;
360
0
0
3'0
$
1 D JOilO 2020
Year
Cl<,a.ktcs"':=.,-=;. ;,: . ic ,::; :J J.
1,rsa.;..,.."'"°'••ZW
Figure 11: The Keeling Curve
- These measurements and data from other sites clearly show an upward trend from about 315 parts per million (ppm) to nearly 370 ppm today.
- This increase closely matches the growth in carbon dioxide emissions.
Many believe that this growth in the atmospheric carbon dioxide content is partially responsible for the recent global warming.
The Enhanced Greenhouse Effect
Although some scientists believe that natural causes are behind the trend of global warming, others assume that the root of the problem is anthropogenic-Le. it is the result of the emission of greenhouses gases by humans.
CLUSTER 31 SUSTAINABLE FUTURE AND CLIMATE CHANGE

TOPIC 3.2 THE FUTURE WITH CLIMATE CHANGE
- The Phenomenon
The greenhouse effect occurs naturally and is produced by certain gases in the atmosphere. The process is shown in figure 12 and is illustrated below:
- The sun emits short-wave insolation that passes readily through the earth's atmosphere.
- Some of this radiation are absorbed, reflected or scattered, while the rest reaches the surface and warms the land and the oceans.
- Because the earth's surface is cooler than the sun, the earth emits long-wave, largely infra-red, terrestrial radiation back to the atmosphere where much is absorbed by greenhouse gases since these gases are more efficient in trapping longwave radiation.
- When these gases in the atmosphere absorb long-wave terrestrial radiation, they warm, but eventually they radiate this energy away.
- Some of this longwave terrestrial radiation travels upward, where it may be reabsorbed by other gas molecules.
- The remainder travels downward and is again absorbed by the earth.
- Thus, the earth's surface is being continually supplied with heat from the atmosphere as well as from the sun.
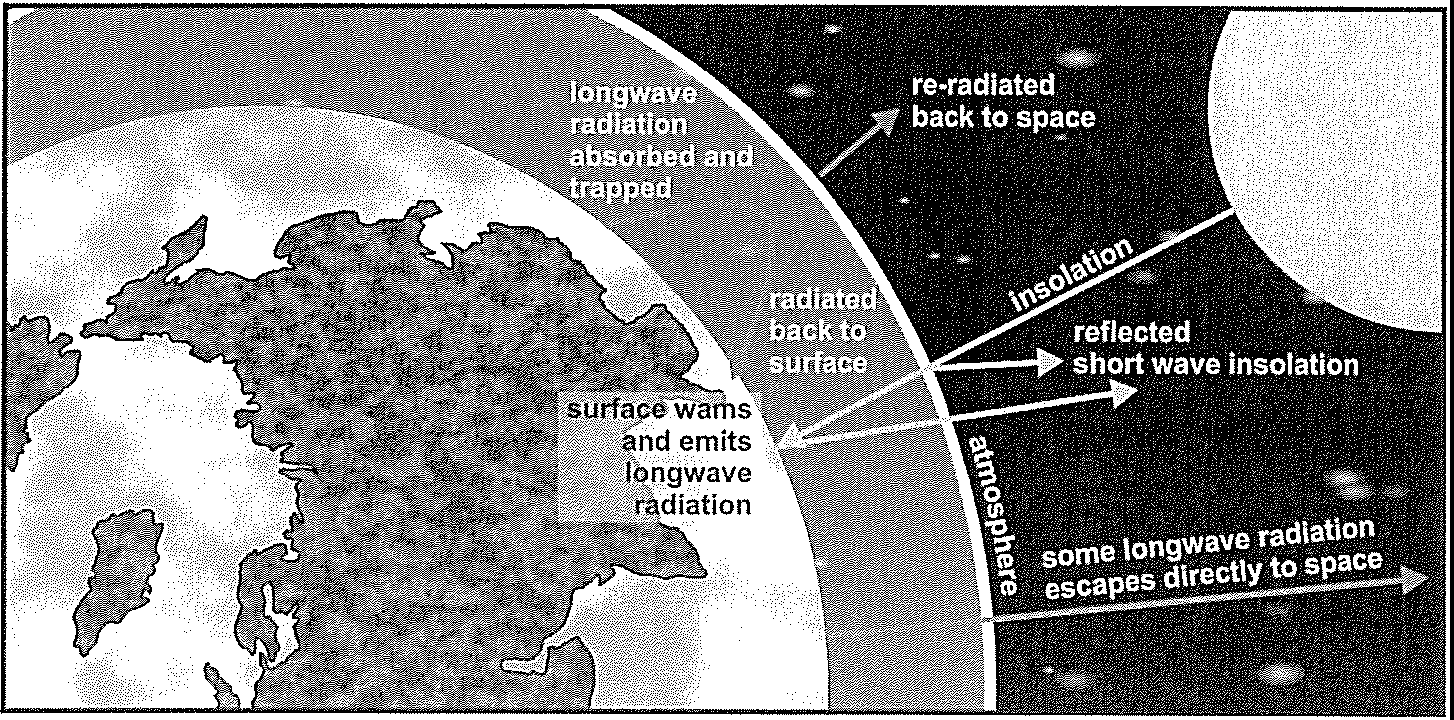
Figure 12: The greenhouse effect.
- This energy will again be emitted by the earth's surface, and some will be returned to the atmosphere, which will, in turn, radiate some earthward, and so forth.
\

CLUSTER 31 SUSTAINABLE FUTURE AND CLIMATE CHANGE
TOPIC 3.2 THE FUTURE WITH CLIMATE CHANGE
- These processes that take place between the earth's surface and the greenhouse gases in the atmosphere keeps the earth's average temperature 35°C warmer than it would otherwise be. Thus without these absorptive gases in our atmosphere, the earth, like the moon, would not provide a suitable habitat for humans and other life forms (at the moon, temperatures rise to over 100°C when lit by the sun and drop to minus 150°C at night). The average temperature near the surface of the earth would be about -18°C instead of a comfortable 15°C.
Human Activities and Greenhouse Gases
Table 1: The greenhouse gases
Greenhouse gas | Where it comes from | . ,;., , • , : r • | Function | .-.- :, | ||
water vapour | Surface water e.g. lakes, rivers, oceans. Moisture loss form plants and other organisms. Largely constant in amount and not significantly affected by human activities. | Water droplets absorb wave length not absorbed by gases/vapour and radiate this heat back to the ground. | ||||
carbon dioxide (CO2) | Released by animals during respiration. Burning of fossil fuels. Clearing of forests and burning of the cleared vegetation. | Absorbs long-wave radiation from the earth. | ||||
methane (CH4) | Released as bacterial break down organic matter. Marshes, swamps, tundra, wetlands (used for rice-growing}, disposal of organic waste, waste from digestion in mammals. | Absorbs long-wave radiation from the earth. | ||||
nitrous oxide (N2O) | Combustion of fossil fuels in power stations and transport. From denitrifying bacteria which break down nitrate and nitrites (increasing due to use of nitrate fertilizers). | Absorbs long-wave radiation from the earth. | ||||
Chlorofluoro- carbons | Released from aerosol sprays, 1970s. Used in refrigeration. | 1960s | - | |||
Ozone (03) | Formed naturally from 3 oxygen atoms due to UV radiation. Tropospheric ozone is human-made resulting from complex chemical reactions between pollutants and sunlight. Sources of these pollutants are nitrogen oxides from power stations and hydrocarbons from cars and other types of transport. | Ozone is vital to life on earth- it filters harmful short-wave UV radiation from the sun. | ||||
As illustrated above, greenhouse gases are responsible for the natural greenhouse effect. Human activities however can lead to the enhanced greenhouse effect by the emission of more of these gases into the atmosphere. A brief overview of some of the more common greenhouse gases and their sources is given in Table 1.
CLUSTER 3 I SUSTAINABLE FUTURE AND CLIMATE CHANGE
TOPIC 3.2 THE FUTURE WITH CLIMATE CHANGE
These gases are collectively important as they often absorb radiant energy in different parts of the energy spectrum:
- For example, water vapour absorbs infra-red energy in the wave band 4-7 µm.
- For carbon dioxide the range is 13-19 µm.
- Between 7 and 13 µm there is a window through which 70% of the long-wave energy from the earth's surface are not absorbed by these two gases.
- The presence of other greenhouse gases however helps to absorb part of this energy to further warm up the earth.


- Burning of Fossil Fuels
Although carbon dioxide represents only about 0.036% of the gases that make up clean, dry air, it is nevertheless a meteorologically significant component and together with water vapour, the gas is largely responsible for the greenhouse effect of the atmosphere.
It has been suggested that the emission of carbon dioxide through the burning of fossil fuels for industries and household uses is largely responsible for the rise in the global temperature. Human activities have disturbed the balance in the carbon cycle by adding huge quantities of carbon dioxide to the atmosphere. This is done mostly by the burning of fossil fuels:
- Since the middle of the 19th century, there has been an exponential increase in the input of carbon dioxide to the atmosphere by fossil fuel consumption.
- By the early 1980s an estimated 20 thousand million tones of carbon dioxide was added to the atmosphere annually from the burning of fossil fuels.
- Not surprisingly, most emissions have come from the developed nations, with 90% originating in the northern hemisphere.
Burning of fossil fuels will increase carbon emissions.
4.2. Deforestation
Increasingly in the 20th century, deforestation has contributed to quantities of carbon dioxide being released. This occurs in two ways.
- Through the destruction of huge areas of forest and vegetation around the world, there is a consequent decline in photosynthesis, so carbon dioxide that would otherwise be absorbed remains in the atmosphere. Any process that absorbs carbon from the atmosphere is known as a carbon sink. Deforestation reduces carbon sinks.
- Vegetation is burnt the combustion releases additional carbon dioxide.
Scientists estimate that deforestation accounts for about 20% of the carbon dioxide added to the atmosphere each year from human activities.
.\


CLUSTER 31 SUSTAINABLE FUTURE AND CLIMATE CHANGE
TOPIC 3.2 THE FUTURE WITH CLIMATE CHANGE
4.3 Agriculture
Another important greenhouse gas is methane (CH4). Although less publicized, the increase in methane, a trace gas, is causing concern, as it is a by-product of both energy consumption and agricultural activity. It is believed that a large portion of the methane increase may be the result of anaerobic decomposition of organic matter associated with rice paddy cultivation and the digestive processes of ruminants such as cattle. As both rice area and ruminant numbers have increased with the rising human population over the last two centuries, the present annual increase is about 1% per year for methane compared with 0.48% for carbon dioxide.
4.4 Other Industrial Activities and Vehicles Emissions
In recent years, atmospheric scientists have come to realize that the industrial, transportation and agricultural activities of people are causing a buildup of other trace gases that may also play a significant role in global warming:
- These substances are called trace gases because their concentrations are so much
smaller than that of carbon dioxide.
- The trace gases that appear to be most important are (other than methane) nitrous oxide (N2O), and certain types of chlorofluorocarbons (CFCs).
- These gases absorb wavelengths of outgoing terrestrial radiation that would otherwise escape into space.
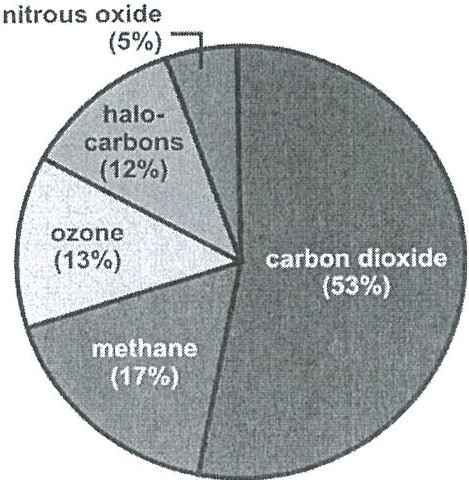
Although individually their impact is modest, taken together the effects of all the trace gases
may be as great as carbon dioxide in warming the earth. In fact, only little more than half of the increase in net radiation accounted for by greenhouse gases is due to carbon dioxide (Fig. 13).
The Global Carbon Cycle
 Fossil fuels release carbon dioxide, the most common gaseous form of carbon when they burn. Carbon is also found in methane. The rest of the carbon is mostly buried in the Earth's
Figure 13: Contribution of different
gases to radiative forcing since the Industrial Revolution.
CLUSTER 31 SUSTAINABLE FUTURE AND CLIMATE CHANGE
TOPIC 3.2 THE FUTURE WITH CLIMATE CHANGE
crust and locked up in sedimentary rocks. Of the three fossil fuels, for a given amount of energy released, coal produces the most carbon dioxide and natural gas produces the least. Carbon dioxide is constantly circulated into life forms and also recaptured in oceans and atmosphere. Plants via the process of photosynthesis use the sun's energy to convert carbon dioxide to form their tissues. Thus, plants draw carbon from soil and atmosphere as they grow but emit carbon back into the air and put carbon back into the soil when they decay. Similarly, the weathering of rocks also formed soluble bicarbonates which will return to the sea. Figure 14 sums up the atmosphere and biosphere exchange of carbon while Figure 15 shows atmosphere-geosphere exchange.
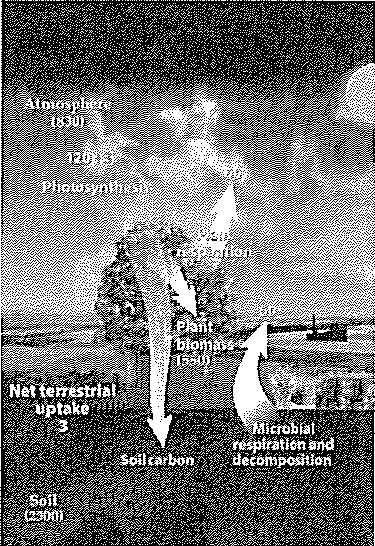
 Figure 14 Atmosphere Biosphere Exchange
Atmosphere
(830)

Leakage through
weathering !
C01 taken
out by rock
plants to burial
j
Figure 15 Atmosphere Geosphere Exchange
CO2 from volcanoes
<0.1 GtonC/yr l
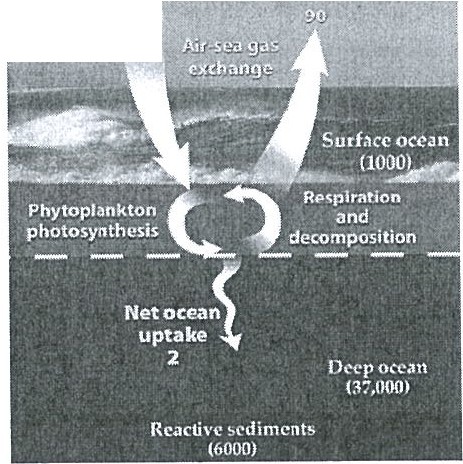
The system through which carbon circulates through the Earth's geosphere, atmosphere and biosphere, specifically including the exchanges between carbon in the earth and the atmosphere through combustion and back again through sequestration or sinks is known as the carbon cycle. A small portion of carbon escapes the carbon cycle and drops from the ocean floor (fig 16) and deep soils back into the Earth's crust. While the numbers in Figs 14, 15 and 16 are not crucial for your purpose. You must know that the exchange of carbon is faster in the atmosphere-biosphere and on the surface of the ocean BUT the processes of carbon returning back to the earth's crust via atmosphere-geosphere and deep ocean happens very very slowly.
-
(i.'l,t2
Figure 16 Atmosphere-Ocean Exchange
Human Activities and Acceleration of Warming
- Deforestation as Positive Feedback Mechanism
 Positive-feedback mechanisms amplify the original temperature rise caused by the buildup of carbon dioxide and reinforce or the initial change:
- The most important and obvious of the positive feedback effects related to
deforestation is burning of forests increases in carbon dioxide and other greenhouse gases. This results in higher surface temperatures which produce greater evaporation rates.
- This factor, in turn, increases the amount of water vapour in the atmosphere (warm air
can also hold more moisture than cold air).
- Water vapour, a greenhouse gas that is even more effective at absorbing longwave radiation than the anthropogenic trace gases, will lead then to an even higher temperature. Therefore, the temperature increase caused by carbon dioxide and the trace gases is reinforced.
In fact, computer models tells us that water vapour feedback contributes about half of the warming associated with increasing carbon dioxide, methane, nitrous oxide, and chlorofluorocarbons.
Extraction of Fossil Fuel as Positive Feedback Mechanism
The extraction of fossil fuels such as coal and oil and the burning of fossil fuels mean that large quantities of carbon are being released into the atmosphere at a rate much faster than they are naturally returned to the Earth's crust. This increased in carbon dioxide may also
 mean increased in temperature and droughts in some areas. As more carbon is released to the atmosphere with more forest fires the effect can be amplifying.
In addition, increase in temperature due to both burning of fossil fuels and deforestation will also result in the melting of ice sheets at the poles which we have already learnt on pg. 20 and this is a very powerful positive feedback mechanism. (which you must learn!)
5.1.6 Oceans as Negative and Positive Feedback Mechanisms
At the current rate, humans are adding enough carbon dioxide to increase its atmospheric content by 3.5 ppm per year over the current value of 370 ppm. The actual rate of increase however is only about half as large since a lot of the excess carbon dioxide enters the ocean. There is thus a constant exchange of the gas between the ocean and the atmosphere as gas molecules cross back and forth across the ocean surface. Overall, the atmospheric carbon dioxide pressure is higher than the ocean values, so there is a net transfer into the ocean, making the oceans a net sink for the gas. The way the oceans react to an increase in the carbon dioxide level gives rise to another negative-feedback mechanism:
A rise in temperatures may cause the bloom of marine life.
Photosynthesis by phytoplankton and other marine plants may then lead to the removal of large quantities of carbon which enters the marine food chain.
As the eventual settling of plant and animal remains transfer carbon downward, more atmospheric carbon dioxide can enter the ocean sink.
As a result, climate will cool due to the loss of the warming influence of this excess atmospheric carbon.
Although ocean may act as a vital carbon sink, in the long term, though, this may be offset by the fact that warm water absorbs less carbon dioxide than cold. More of the gas will therefore be left in the atmosphere to encourage warming.
Human Activities and Suppression of Warming
- Carbon Capture
Since it takes a long time for carbon dioxide to go back to the carbon sinks, one way is to not let it enter the atmosphere. Carbon capture and storage (CCS) is the process of capturing waste carbon dioxide from large point sources, such as fossil fuel power plants, transporting it to a storage site, and depositing it where it will not enter the atmosphere, normally an underground geological formation. The aim is to prevent the release of large quantities of carbon dioxide into the atmosphere. However, this technology is very new. Another solution
is to look into alternative sources of energy (eg Hydropower, Solar Power and Nuclear Energy) to reduce carbon emissions and positive feedbacks.
Protecting the Karsts Landscapes
As mentioned earlier, the dampening or stabilizing effect due to some negative feedbacks can be very slow (for example silicate weathering in fig. 17). Hence, the carbon dioxide emitted via the extraction and burning of fossil fuels will take a long time to work its way back to the carbon sinks. It is thus very important for us to conserve the karst landscapes due to their ability to provide regulating ecosystem services.
0
 CO2+ H20
I (slightly acidic rain)
I I tI J 11 I
I I II I 11 I
lt·

I I I 11
CaSi03 +CO2 CaC03 + Si02
Rocks on
I
land
Atmos,eric Calci CO2 carbonate
/'°
(e.g. marine Silica (also, shells) e.g. marine
shells)
Protecting the Wetlands
Figure 17: Silicate Weathering
In a wetland, more carbon dioxide is removed from the atmosphere and incorporated into vegetation and soil than in either a forest or an upland prairie. A study by The Conservation Fund found that wetlands store 81 to 216 metric tons of carbon per acre, depending on their type and location. Thus, it is important to protect the delta environments.
Reforestation and Afforestation
Plants need carbon dioxide for photosynthesis (fig.18), justifying the importance of reforestation and afforestation.

Decreased CO2
STABILIZING
Increased plant
growth
Moreoutflow ofCO2 fromthe atmosphere
to plants
Figure 18: Plants as Negative Feedback
- Human Activities and Climatic Changes
At present, it is impossible to conclude one way or the other with any certainty. But most atmospheric scientists believe that this warming may be largely the result of increases in greenhouse gases, and others are now fully convinced (fig 19).
Radiali,.-e Influences Cooling Warming
long-lived{
greenhouse gases
co,
.w,
""
·,;
'D
al
i
E
;"r:
CH4 + N20+
Halocarbon:.
Ozone Stratospheric Tropospheric
(-0.05)
I
Stratosphoric water vapour-
Surface alb-0do Land USO Black carhon
oo snow
Direct effect Aerosols Cloud albodo
{ offecl
PJrcrafl contrails 1(0.01)
[.3!w$1
z"'e1l
Q. '
Solar radiation
Total net
human activities
-1 0 1 2
Radiative Forcing (watmlm2)
Figure 19: Causes of Warming Since 1800s