1.2 opportunity cost
What is the production possibilities curve?
production possibilities curve: a model that shows alternative ways that an economy can use its scarce resources
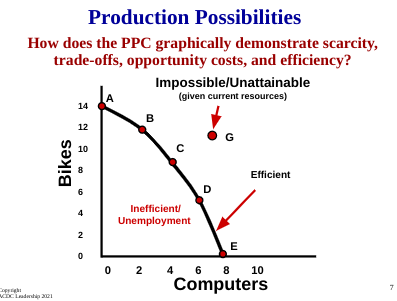
this model graphically demonstrates scarcity, trade-offs, opportunity costs, and efficient
4 key assumptions
only two goods can be produced
full employment of resources
fixed resources (ceteris paribus)
fixed technology
production “possibilities” table
A | B | C | D | E | |
14 | 12 | 9 | 5 | 0 | bikes |
0 | 2 | 4 | 6 | 8 | computers |
Each point represents a specific combination of goods that can be produced given full employment of resources
The production possibilities curve (or frontier)
constant vs. Increasing opportunity cost
shifting the production possibilities curve
3 shifters of the ppc
change in resource quantity or quality
change in technology
change in trade (allows more consumption)
if you produce more capital goods you will be able to also produce more consumer goods, because, capital goods produce consumer goods
if the ability to produce not change there is no new line on the graph, but, what the people produce will change to the other thing