Unit 4: AP Stats 🌿
Sampling: 💚
Convenience sample:
are based on choosing individuals who are easy to reach.
tend to produce data highly unrepresentative of the entire population.
→ how does it lead to bias?
it selects participants based on their availability rather than a random selection
Voluntary Response Sample
individuals who choose to participate
gives too much emphasis to people with strong opinions
undersamples people who don’t care much about a topic
→ how does it lead to bias?
leads to bias as only people w strong opinions (usually negative) will respond
Simple Random Sample
every possible sample of the desired size has an equal chance of being selected
→ how does it lead to bias?
if the sampling frame (the list of potential participants) does not accurately represent the whole population
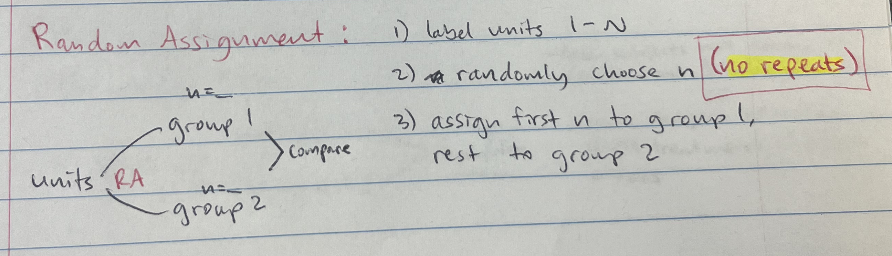
Process:
label individuals 1-#
use a random number generator to select a # of them
select and survey respondents (no repeats)
"randomization reduces bias"
Stratified Random Sample
dividing the population into homogeneous groups called strata
homogenous: very same or similar
then pick random samples from each of the strata
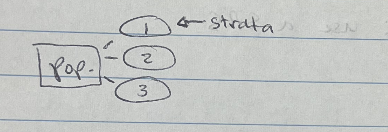
finally combining these individual samples into a stratified random sample
For example, we can stratify by age, gender, income level, or race; pick a sample of people from each stratum; and combine to form the final sample.)
low variability
low bias
→ how does it lead to bias?
if the sampling frame (the list of potential participants) does not accurately represent the whole population
Cluster Sample
involves dividing the population into heterogeneous groups called clusters and then picking everyone or everything in a random selection of one or more of the clusters.
For example, to survey high school seniors, we could randomly pick several senior class homerooms in which to conduct our study and sample all students in those selected homerooms.
→ how does it lead to bias?
when the selected clusters are not representative of the overall population, leading to an over- or under-representation of certain subgroups within the sample
Systematic Random Sample
listing the population in some order (for example, alphabetically), choosing a random point to start, and then picking every tenth (or hundredth, or thousandth, or kth) person from the list.
→ how does it lead to bias?
if the population list is ordered in a way that creates a repeating pattern, leading to the over-representation of certain subgroups within the sample
Bias: 🥶
Undercoverage bias - happens when there is inadequate representation, and thus some groups in the population are left out of the process of choosing the sample.
Response bias - describing situations where people do not answer questions truthfully for some reason. people don’t want to be perceived as having unpopular or unsavory views or don’t want to admit to having committed crimes.
Nonresponse bias - when individuals selected to be in the sample who do not respond to the survey have different opinions from those who do.
Nonresponse bias has no volunteers, its just selects people who don’t respond
Convenience Sample Bias - As the sample is based on people who are willing at the time and place that the researcher is present, you won't be gaining a range of people each time you're collecting data.
Voluntary Response Bias - occurs when a sample of people is chosen to participate in a survey by their own choice, rather than being randomly selected. This can lead to biased results that are not representative of the entire population.
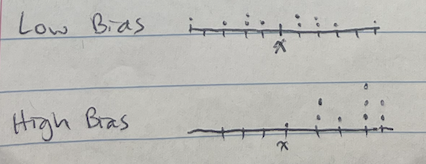
What does low vs high bias look like on a dot plot??
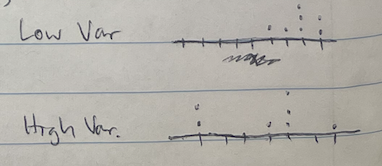
What does low vs high variability look like on a dot plot??
Calculator Functions: 😚
randint( 1, 10, 2)
(Domain,How many random #’s)
Example:
label the seats 1-50
use randint(1,50,10)
ignore & replace repeats
select & survey people in corresponding seats
Study Types + Treatments: 😌
Census : Collecting data from every individual in a population. Downfalls of this method: expensive, time consuming.
Observational Study: No treatment is imposed; observational studies aim to gather information about a population without disturbing the population.
Observational studies NEVER establish cause & effect!!!!!!
Experiment: Treatment is imposed
Prospective Study: individuals are followed over time and data about them is collected as their characteristics or circumstances change.
Retrospective Study: involves analyzing data that has already been collected to answer a scientific question. observational studies by necessity because they assess past events and it is impossible to perform a randomized, controlled experiment with them.
Statistically Significant: the difference between the two is large enough that you can say it wasn’t by chance
The Language of Experiments: 🤑
Experimental units - An experiment is performed on objects.
Subjects - If the units are people.
Experiments involve explanatory variables, called factors, that are believed to have an effect on response variables. A group is intentionally treated with some level of the explanatory variable, and the outcome of the response variable is measured.
Elements of a Well-Designed Experiment:
Comparison (2+ treatment groups)
Random assignment
Replication (more than 1 unit in each treatment group)
Control (Keep other variables constant)
Placebo Effect - It is a fact that many people respond to any kind of perceived treatment. (For example, when given a sugar pill after surgery but told that it is a strong pain reliever, many people feel immediate relief from their pain.)
Placebos are used primarily for blinding
A treatment that has no active ingredients
Blinding - occurs when the subjects don’t know which of the different treatments (such as placebos) they are receiving.
Double-blinding - is when neither the subjects nor the response evaluators know who is receiving which treatment.
Experiment: Treatment is imposed, allows causation
Treatments: What is done/not done to experimental units
Replication of the treatments on many units reduces the role of chance variation.
by repeating an experiment on a large number of different units (individuals, samples, etc.) under the same treatment conditions, the influence of random, unpredictable variations ("chance variation") on the results is minimized, allowing for a more accurate assessment of the true effect of the treatment itself.
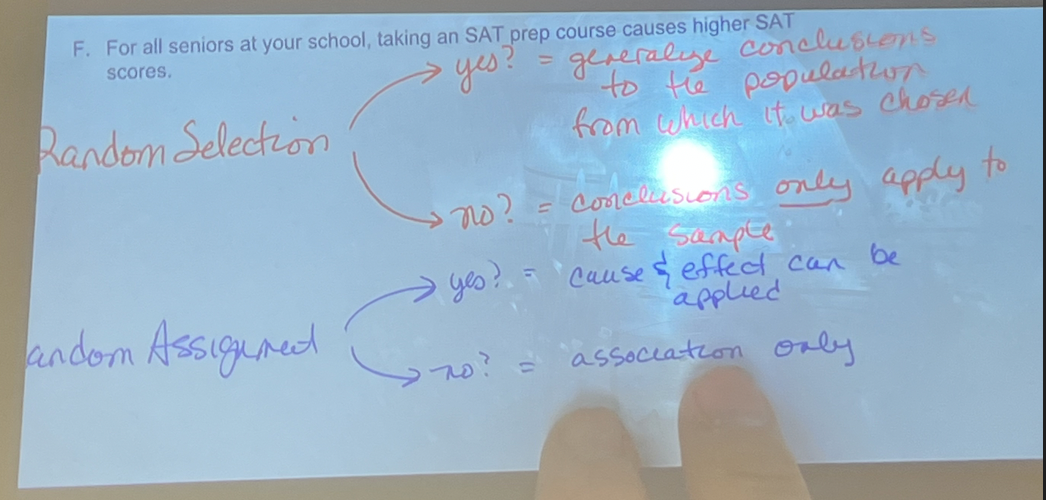
Randomization: 🥰
Random selection: generalize conclusion to the population (BIG)
IF NOT USED, generalize conclusion to the sample (smol)
Random Assignment: Cause (MENTION CAUSED!!!) & effect can be applied
IF NOT USED, association can be applied
Ex. Random selection (Yes), Random Assignment (No)
For those at Wisconsin, there is an association between volunteering and decreased mortality rates
Random Assignment:
Random Selection & Random Assignment:
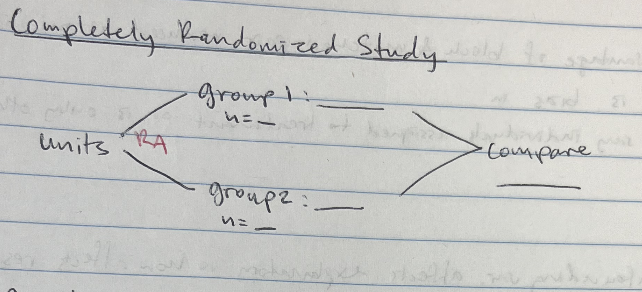
Design: 💝
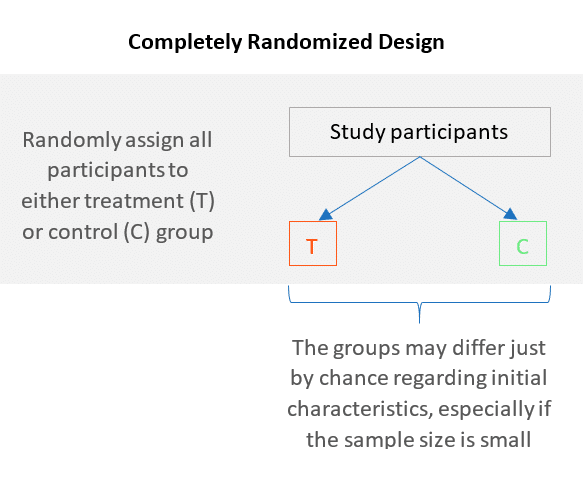
Completely Randomized Design/Study: Randomly assign all participants to either treatment or control group
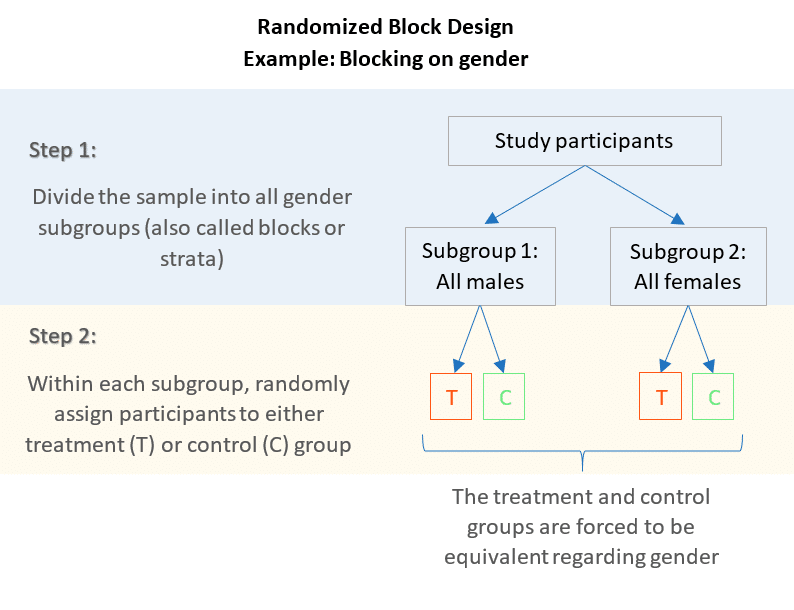
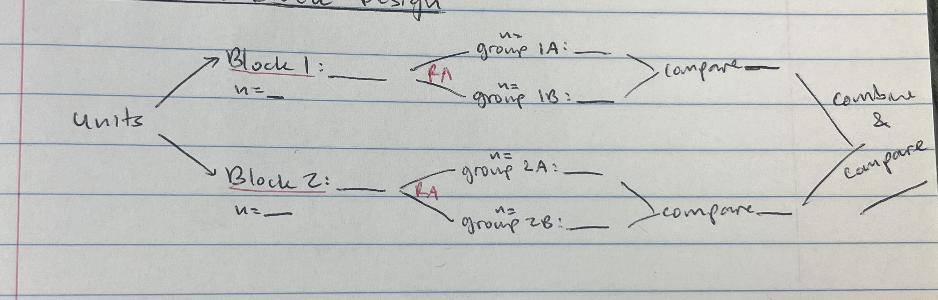
Randomized Block Design: Groups similar subjects together and randomly assigns treatments to each group:
Blocking is a technique that can control the response variable in an experiment
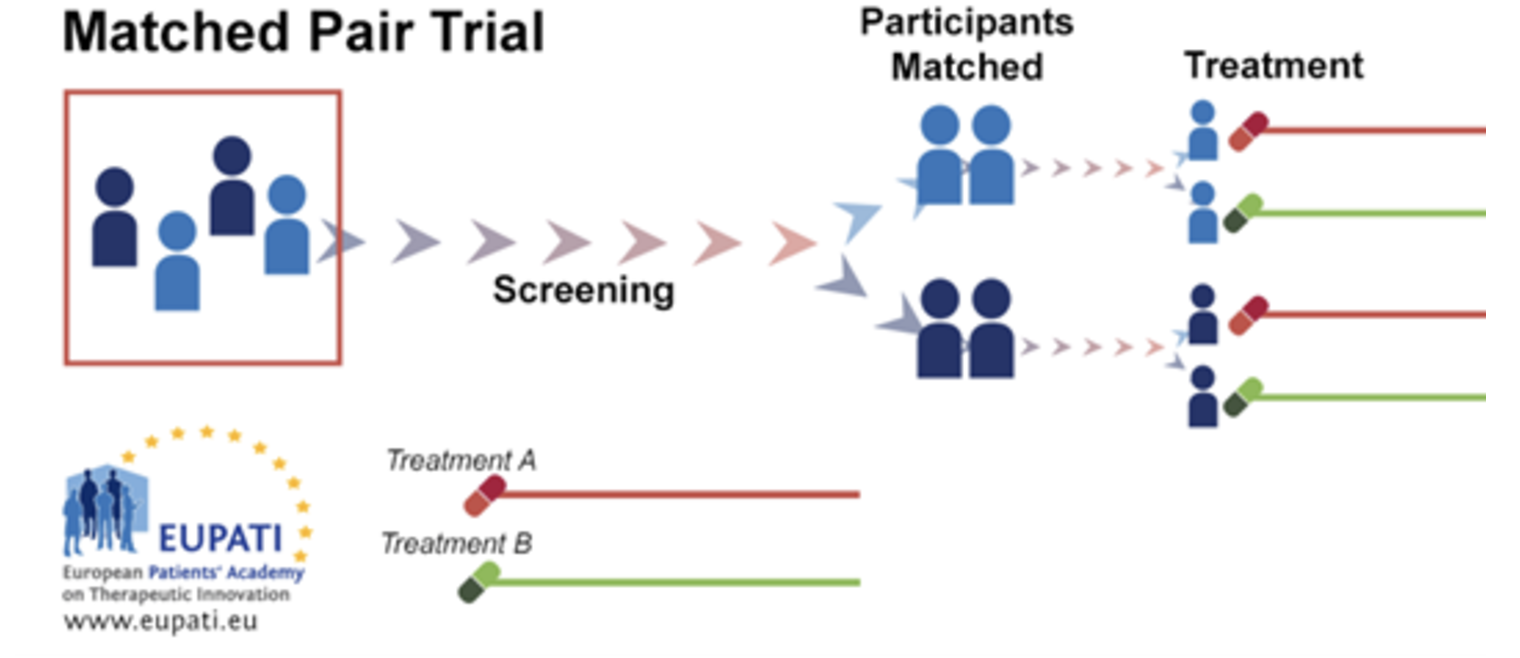
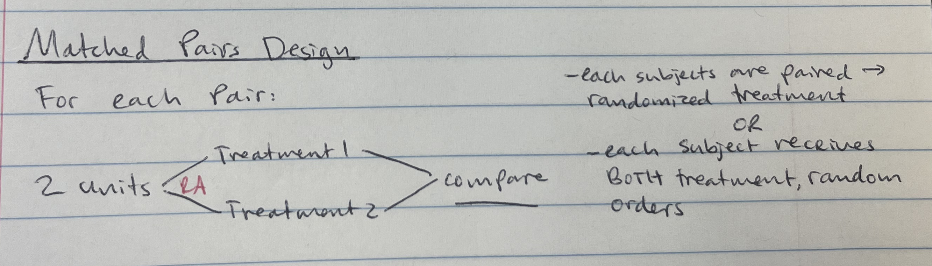
Matched Pairs Design: one in which each subject is matched with another subject with similar variables. One of the paired subjects is randomly assigned to one study group, while the other is then assigned to the other study group.
Details: Random assignment of subjects to treatment groups DOES NOT eliminate bias in response variable.
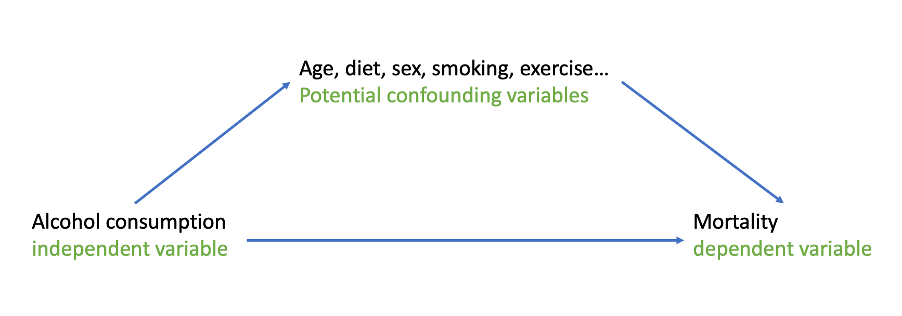
Variables: 🤗 💖
Explanatory Variable: the variable that is used to explain or predict changes in another variable
Response Variable: the variable that is being measured or observed to determine the effect of another variable
Confounding Variable: related to the explanatory & effects the response
two variables are confounded if their effects on response variable cannot be distinguished.
ex.