Exam 1
1.1 Basic Climatology
1. Climate Definition
Overview: Climate refers to the average state of the atmosphere observed over a defined period, such as a season, spanning multiple years. It encompasses long-term weather conditions, including temperature, precipitation, wind, and other atmospheric factors.
Average Time Period: Climatological studies typically analyze a 30-year period to determine climate norms, known as a "climate normal."
Example: The global average temperature increase between 1880 and 2020 was approximately 1.2°C, indicating a warming trend over more than a century.
2. Climate System Components
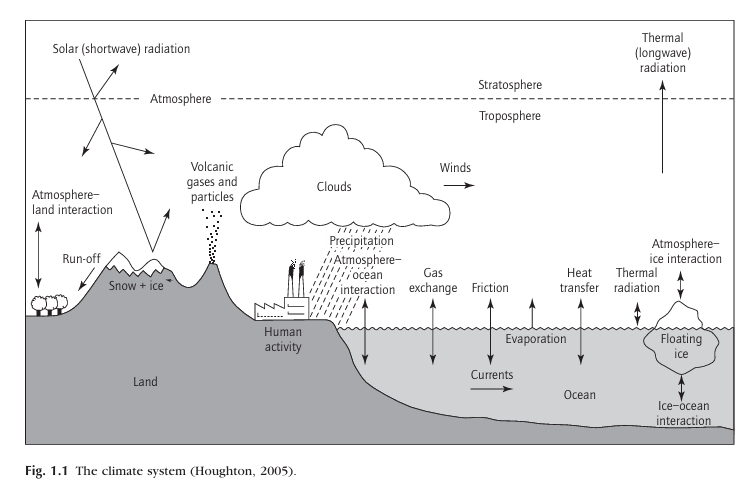
Composite Climate System: The climate system consists of five major interactive components:
Atmosphere:
Composition: The atmosphere is composed of 78% nitrogen, 21% oxygen, and 1% other gases, including greenhouse gases like CO2, methane, and water vapor.
Data Point: The current concentration of CO2 in the atmosphere is approximately 420 parts per million (ppm), up from 280 ppm in pre-industrial times.
Hydrosphere:
Ocean Coverage: Oceans cover about 71% of Earth's surface and hold 97% of Earth's water.
Heat Storage: Oceans have absorbed over 90% of the excess heat generated by global warming, influencing climate patterns like El Niño and La Niña.
Cryosphere:
Ice Coverage: The cryosphere includes all frozen water on Earth, covering about 10% of Earth's surface.
Data Point: The Arctic sea ice extent has been declining by about 13% per decade since the late 1970s.
Lithosphere:
Geological Activity: Volcanic eruptions can inject large amounts of aerosols into the atmosphere, temporarily cooling the planet by reflecting solar radiation.
Example: The eruption of Mount Pinatubo in 1991 led to a global temperature decrease of about 0.5°C for several years.
Biosphere:
Carbon Sequestration: Forests, grasslands, and other ecosystems absorb about 2.6 billion metric tons of CO2 annually, helping to mitigate climate change.
Open and Non-Isolated Systems: All components are open systems, exchanging energy and matter with each other, interconnected through complex feedback mechanisms that drive the climate.
Electromagnetic Waves:
Wavelength: Distance between the crest of one wave and the crest of the next wave
Laws Governing electromagnetic radiation
All objects emit radiant energy
Warmer objects radiate more total energy
Warmer objects radiate more energy as short wavelengths
Objects that are good absorbers of energy are also good emitters of energy.
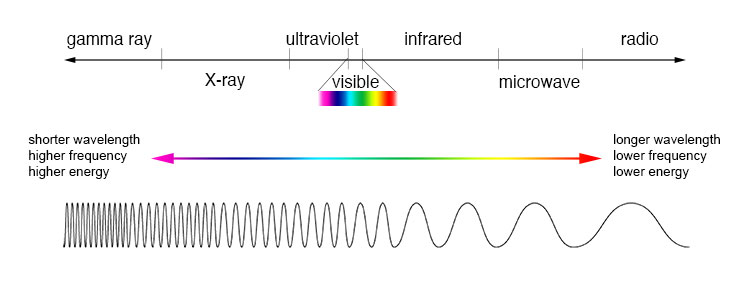
Stefan-Boltzmann Law: The total amount of energy per unit area emitted is proportional to the area under the emission curve
3. External Forcings on Climate
Primary Forcing Mechanisms: The climate system is primarily driven by two external forcings:
Solar Radiation: The Sun provides nearly all the energy driving the climate system, making it the primary forcing mechanism.
Solar Constant: The average solar energy received at the top of Earth's atmosphere is about 1361 watts per square meter (W/m²).
Solar Variability: Solar output varies slightly (about 0.1%) over an 11-year sunspot cycle, influencing short-term climate variations.
Earth’s Rotation: Influences the day-night cycle and the distribution of solar energy, contributing to weather patterns.
Day Length: Earth's rotation period is 24 hours but is gradually slowing due to tidal friction, affecting long-term climate patterns.
Solar Radiation as the Primary Driver: The distribution of solar energy is uneven due to Earth's spherical shape and axial tilt, leading to variations in climate.
4. Distribution of Climates Across Earth
Factors Influencing Climate Distribution:
Spherical Shape of Earth: Causes sharp north-south temperature gradients due to varying solar angles.
Temperature Gradients: The equator receives about 2.5 times more solar energy than the poles, driving atmospheric and oceanic circulation.
Example: Average annual temperatures range from about 27°C near the equator to -50°C in Antarctica.
Earth’s Rotation: Creates daily cycles of heating and cooling, influencing wind patterns and ocean currents.
Axial Tilt: The tilt of Earth’s axis (currently about 23.44°) causes seasonal variations in solar radiation, resulting in distinct seasons.
Daylight Variation: The axial tilt causes seasonal changes in daylight, ranging from 0 hours at the poles during winter to 24 hours during summer.
Solar Insolation: At the summer solstice, the Arctic Circle receives up to 480 W/m² of solar energy, while the Antarctic Circle is in complete darkness.
Orbital Eccentricity: Earth’s elliptical orbit around the Sun leads to seasonal variations in solar radiation intensity.
Perihelion and Aphelion: Earth is closest to the Sun (perihelion) at about 147 million kilometers and farthest (aphelion) at about 152 million kilometers, causing a 3.5% variation in solar radiation.
Greenhouse Gas Content: The concentration of greenhouse gases in the atmosphere affects the planet’s temperature by trapping heat.
Nature of the Underlying Surface: Surface types (e.g., forests, deserts, oceans) affect how much solar energy is absorbed or reflected.
5. Earth's Orbital Characteristics and Climate
Elliptical Orbit: Earth's orbit is slightly elliptical, with the Sun located at one focus of the ellipse.
Seasonal Variations: The Earth is closest to the Sun in January (perihelion) and farthest in July (aphelion), leading to a 3.5% variation in the solar radiation received.
Long-Term Orbital Changes: Over thousands of years, Earth’s orbit varies due to gravitational forces from the Sun, Moon, and other planets, affecting the distribution of solar radiation.
Data Point: The current eccentricity of Earth's orbit is about 0.0167, which contributes to seasonal temperature variations.
6. Milankovitch Cycles
Three Orbital Mechanisms: The Milankovitch cycles describe the impact of Earth's orbital variations on long-term climate changes:
Orbital Eccentricity: The shape of Earth’s orbit changes from nearly circular to more elliptical over a cycle of 90,000 to 100,000 years.
Impact: During more elliptical phases, the seasonal variation in solar radiation can be as much as 30%.
Axial Precession: The wobble in Earth’s rotation axis, known as precession, causes the timing of the closest approach to the Sun to vary within the orbit.
Cycle Length: This precession cycle takes about 21,000 years.
Axial Tilt: The tilt of Earth’s axis changes between 21.8° and 24.4° over approximately 40,000 years.
Current Tilt: The current tilt is about 23.44°, and it is gradually decreasing.
Effect: Greater axial tilt results in more pronounced seasonal contrasts between winter and summer.
7. Theoretical Atmospheric Circulation on a Non-Rotating Earth
Stationary Earth Hypothetical: If Earth did not rotate, the atmospheric circulation would likely involve extreme temperature contrasts between the hot day side and cold night side.
Wind Patterns: Surface winds would flow from the cold night side toward the hot day side, with reverse patterns at higher altitudes.
Rotating Earth Impact: As Earth rotates, the atmospheric circulation evolves into the patterns observed today:
Meridional Overturning Cells: Separate zones of rising and sinking air at different latitudes, forming cells such as the Hadley, Ferrel, and polar cells.
Zonal Climate Zones: Resulting in distinct climate zones like tropical, temperate, and polar regions, shaped by these circulation patterns.
1.2 General Atmospheric Circulation
1. Meridional Circulation and Hadley Cell
Hadley Cell (0°-30° Latitude):
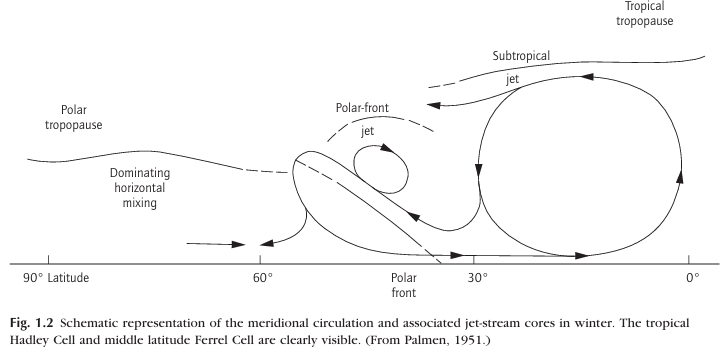
Overview: The Hadley cell is a simple, direct circulation pattern between the equator and 30° latitude. Warm air rises at the equator, moves poleward at high altitudes, cools and sinks at subtropical latitudes, and returns equatorward at the surface.
Momentum Transport: Eastward angular momentum is transported from equatorial latitudes to mid-latitudes by large horizontal eddies (about 1000 km across) in the upper troposphere and lower stratosphere.
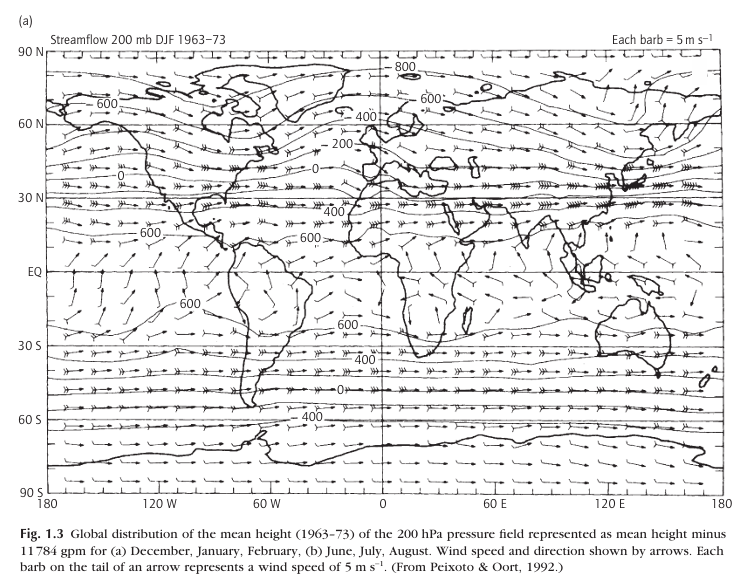
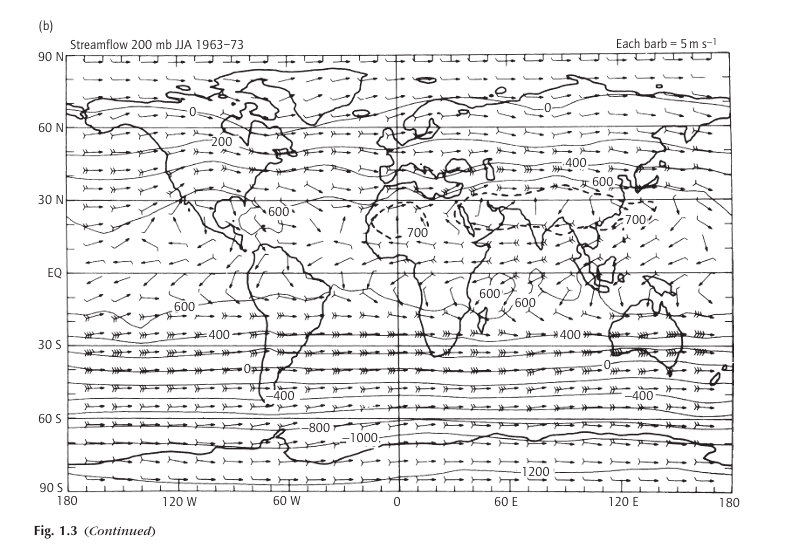
Subtropical Westerly Jet Streams: The accumulation of eastward momentum between 30° and 40° latitude leads to the formation of strong, meandering currents known as subtropical westerly jet streams at approximately 12 km altitude. (Figure 1.3)
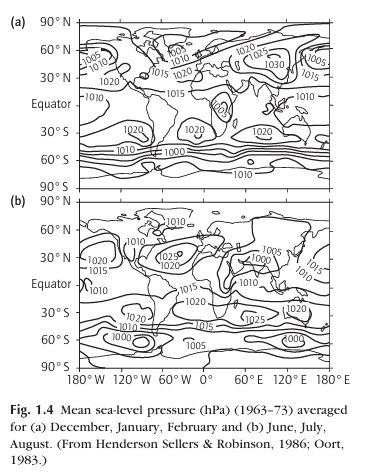
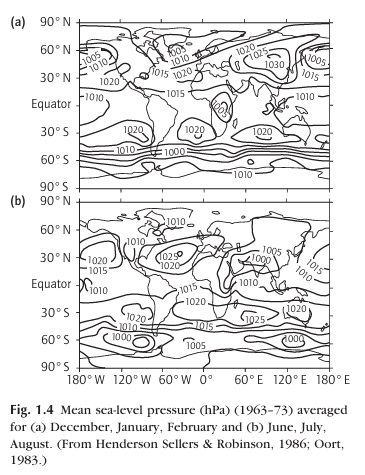
Subtropical Anticyclones: Air descending from the jet streams forms subtropical anticyclones around 30° to 40° N and S (Figure 1.4). The descending limb of the Hadley cell is marked by widespread subsidence, while ascent is limited to a few localized areas of intense convection.
2. Ferrel Cell and Middle Latitude Dynamics
Ferrel Cell (30°-60° Latitude):
Overview: The Ferrel cell is an indirect circulation cell where air flows poleward at the surface and equatorward at higher altitudes. It is less stable than the Hadley cell and is influenced by the momentum transferred from the subtropical jet streams.
Middle Latitude Westerlies: Excess momentum from the jet streams is transported downward and poleward, maintaining the eastward-flowing surface winds (temperate latitude westerlies) against ground friction.
Trade Winds: Air flows from the subtropical anticyclones toward the equator, forming the trade winds, which are easterly (westward flowing). These winds tend to slow Earth's rotation while gaining eastward momentum themselves.
3. Rossby Waves and Atmospheric Variability
Rossby Waves:
Upper Atmosphere: In the upper westerlies, smooth wave-shaped patterns dominate, with typically four or five major waves around each hemisphere. These are known as Rossby waves, named after Carl-Gustaf Rossby, who first described their properties.
Lower Atmosphere: The middle latitudes are characterized by large-scale cyclonic (eastward and poleward) and anticyclonic (eastward and equatorward) eddies, creating significant atmospheric variability.
4. Polar Front Jet Streams
Polar Front Jet Streams:
Location and Function: Found along the polar edges of the Ferrel cells at about 10 km altitude, these jet streams form due to strong thermal gradients between the warmer mid-latitudes and the colder polar regions. (Figure 1.2)
Instability and Eddies: The zone of westerlies is unstable, leading to a continuous formation of large-scale eddies, with the cyclonic ones moving eastward and poleward and the anticyclonic ones moving eastward and equatorward.
5. Ocean-Atmosphere Interactions and Climate
North Atlantic Circulation:
Warm Saline Flow: Warm, saline surface water from the Caribbean travels through the Gulf Stream to the northern North Atlantic, where it is further moved into the Greenland and Norwegian Seas.
Cooling and Sinking: As the warm water cools, it sinks, driving deep ocean circulation. This process is unique due to the higher salinity, which allows the water to remain dense as it cools, unlike freshwater which reaches maximum density at 4°C.
Sea-Ice Formation:
Low Salinity Layers: In cold oceans, sea ice forms when a low salinity layer near the surface allows the temperature to fall to freezing despite higher temperatures in the underlying layers.
Climate Implications: The formation and movement of sea ice affect global climate patterns by influencing ocean circulation and albedo (the reflection of solar radiation).
1.3 Paleoclimates
1. Major Controls of Long-Term Climatic Change
Greenhouse Gas Concentrations:
Carbon Dioxide (CO2): The concentration of atmospheric CO2 is a crucial driver of long-term climatic changes. Throughout Earth's history, CO2 levels have fluctuated significantly. Up to around 60 million years ago (Myr), atmospheric CO2 concentrations were relatively high. A notable decline began about 60 Myr ago, continuing over time, and by approximately 20 Myr ago, CO2 levels fell below 300 ppm (parts per million). This decrease in CO2 is a result of the carbon cycle, where slight imbalances over tens to hundreds of millions of years have led to a reduction in atmospheric CO2.
Carbon Cycle:
The carbon cycle regulates CO2 levels in the atmosphere. Over geological time scales, slight imbalances in the carbon cycle have led to reductions in atmospheric CO2 concentrations. This long-term trend has had significant impacts on global climate, contributing to periods of both warming and cooling.
2. Mesozoic Era Climate
Temperature Ranges:
Poles: During the Mesozoic era, temperatures at the poles ranged from 10 to 20°C, indicating that polar regions were free of permanent ice fields.
Equator: In contrast, temperatures at the Equator ranged from 25 to 30°C, reflecting a significantly warmer climate compared to present-day conditions.
Climate Trends:
Jurassic Period: At the start of the Jurassic Period, a slight cooling occurred, marking the beginning of a transition in global climate.
Cretaceous Period: The first half of the Cretaceous Period saw marked warming at high latitudes, followed by global cooling towards the end of the period.
Eocene Epoch: A long-term cooling trend commenced at the start of the Eocene Epoch, about 55 Myr ago, leading to significant climatic shifts and the development of new ice conditions.
3. Eocene-Oligocene Boundary
Significant Climate Change:
Glaciations: Around 34 Myr ago, the Eocene-Oligocene boundary marked a significant climatic shift with the onset of widespread glaciations in Antarctica. This period represents one of the most fundamental reorganizations of global climate and ocean circulation (Fig. 1.4). The development of permanent ice sheets in Antarctica led to a notable decrease in global temperatures and the establishment of modern climate patterns.
Ocean Circulation: Prior to the Eocene-Oligocene boundary, there was limited evidence of deep cold water in the oceans, which became more common post-boundary. Ocean circulation patterns shifted, with the formation of deep-water plumes in Antarctica and the Arctic Ocean playing a dominant role in oceanic bottom-water formation.
4. Development of the Antarctic Ice Sheet
Tectonic Changes:
Continental Drift: The growth of the East Antarctic Ice Sheet is often linked to the opening of ocean gateways between Antarctica and Australia (Tasmanian Passage) and between Antarctica and South America (Drake Passage). These tectonic changes are thought to have contributed to the organization of the Antarctic Circumpolar Current and the thermal isolation of Antarctica.
Recent Models: Recent simulations (DeConto & Pollard, 2003) suggest that declining CO2 levels initially led to the formation of small, dynamic ice caps on high Antarctic plateaux. A significant threshold in CO2 concentrations eventually triggered rapid expansion of these ice caps into a continental-scale East Antarctic Ice Sheet. According to these models, the opening of the Southern Ocean gateways played a secondary role compared to CO2 concentration changes.
5. Quaternary Glaciations
Ice-Sheet Formation:
Northern Hemisphere: Continental ice sheets began forming in the Northern Hemisphere about 3 Myr ago, with glacial marine sediments first appearing in North Atlantic marine cores around this time. The oldest glacial moraines in Iceland date to approximately 2.6 Myr ago.
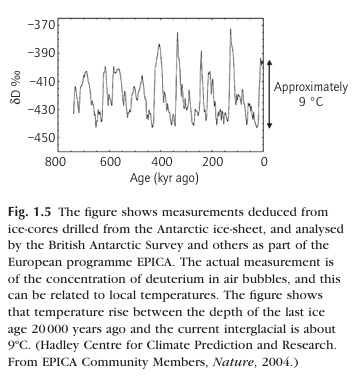
Glacial Cycles: For at least the past million years, Earth's climate has alternated between glacial and interglacial periods. These cycles are marked by the waxing and waning of continental ice sheets and variations in global temperatures (Fig. 1.5). The dominant cycle is approximately 100,000 years, reflecting the complex interplay of climatic forces over this period.
6. Transition from Glacial to Interglacial Conditions
430 Kyr Transition:
Climate Changes: The transition around 430 kyr ago is notable for its similarity to the current interglacial period in terms of temperature and greenhouse gases. This period is characterized by significant changes in temperature and CO2 concentrations, paralleling the current interglacial period and suggesting potential analogues for future climate conditions.
Orbital Forcing: The orbital parameters during this transition are similar to those observed today and in the coming decades. This suggests that the climatic patterns from 430 kyr ago may serve as a useful analogue for understanding current and future climate trends, particularly in the absence of human intervention.
7. Recent Climate Record
Temperature Trends:
Northern Hemisphere: Instrumental temperature records from around 1860 and multiproxy data reconstructions reveal a long-term cooling trend prior to industrialization. The temperature decreased by about −0.02°C per century before the mid-nineteenth century. Recent warming since then has been marked by significant increases, with notable warming periods beginning around 1910 and in the 1970s (Fig. 1.6).
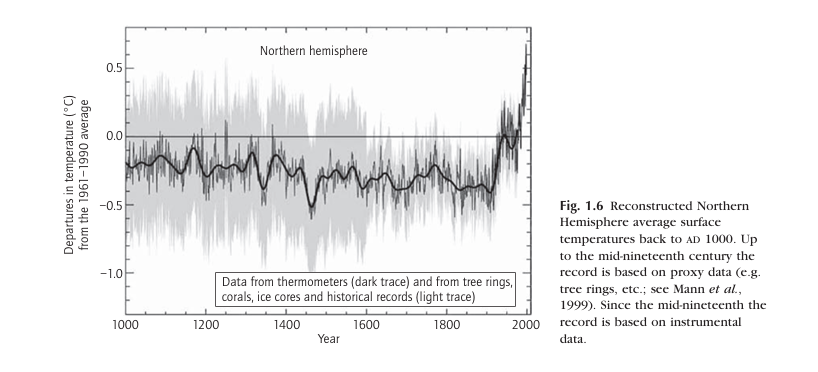
Recent Warming: The global mean surface temperature has increased significantly since the early nineteenth century, with the most substantial warming occurring since 1970. The warmest years on record have been since 1990, with significant warming observed in winter extratropical Northern Hemisphere regions and enhanced tropospheric warming (Fig. 1.7).

Climate Models:
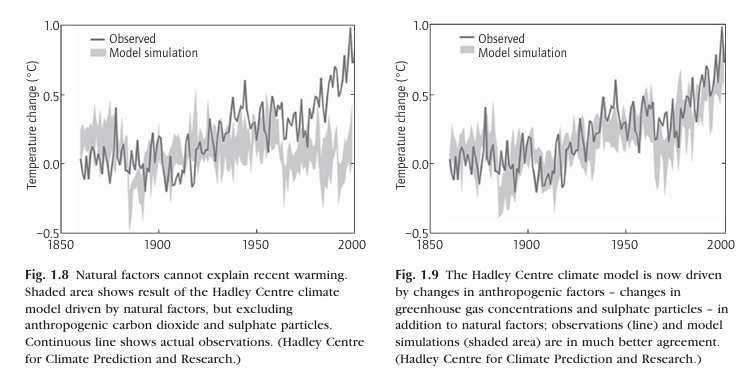
Natural vs. Anthropogenic Factors: Models that account for natural factors alone, such as chaotic climate variability, solar output changes, and volcanic emissions, do not align with observed temperature trends, especially since 1970 (Fig. 1.8). When anthropogenic factors, such as greenhouse gases and sulphate aerosols, are included, models better match observed data, showing that recent warming trends can be attributed to human activities (Fig. 1.9).
1.4 Polar Climates
1.5 Temperate Climates
1.6 Tropical Climates
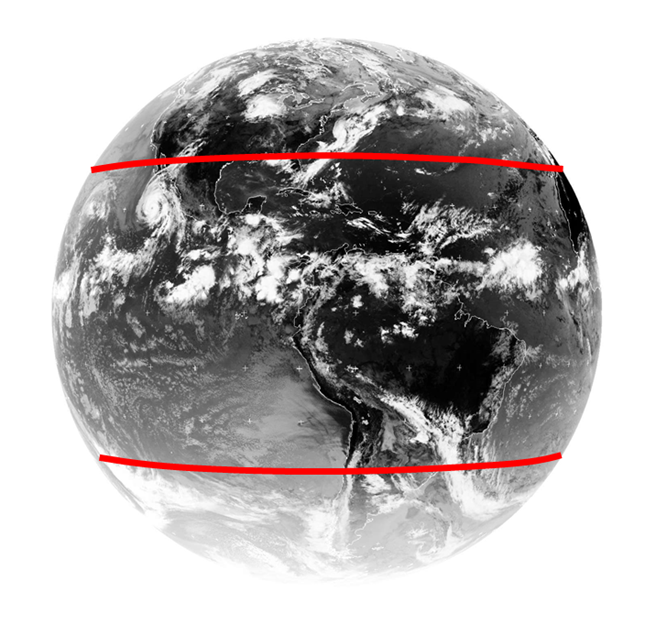
The tropical world may be considered as bounded at the surface by the two belts of subtropical high pressure, at about 30° N and 30° S.
In the tropical world, the Sun is nearly always almost overhead at midday, with little seasonal variation in day length from about 12 hours. Seasonal temperature variations in the humid tropics are therefore generally small, particularly near the Equator
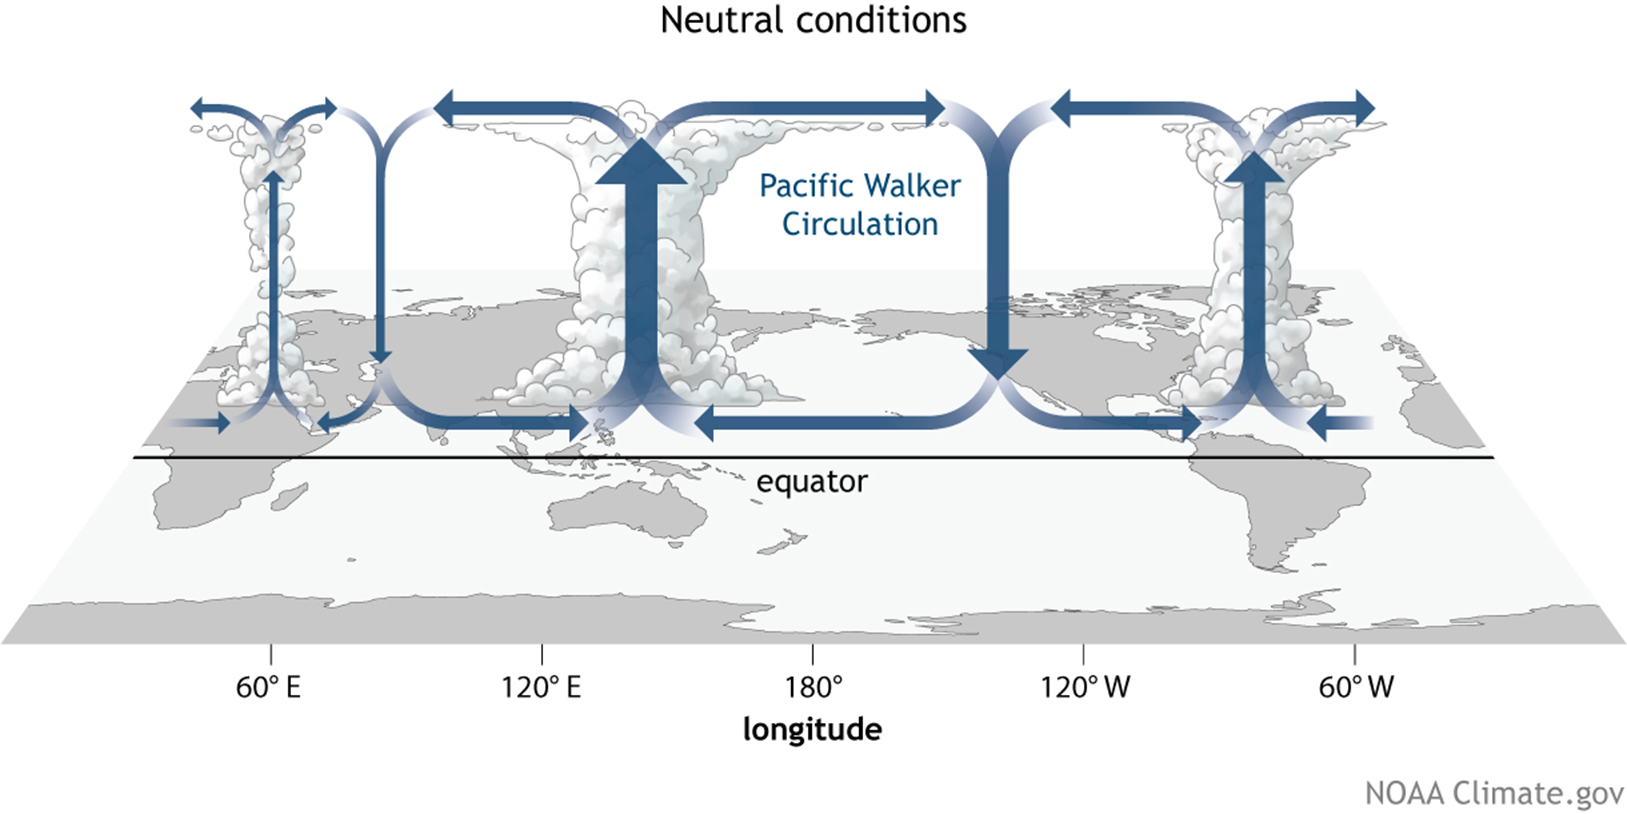
El Nino and La Nina
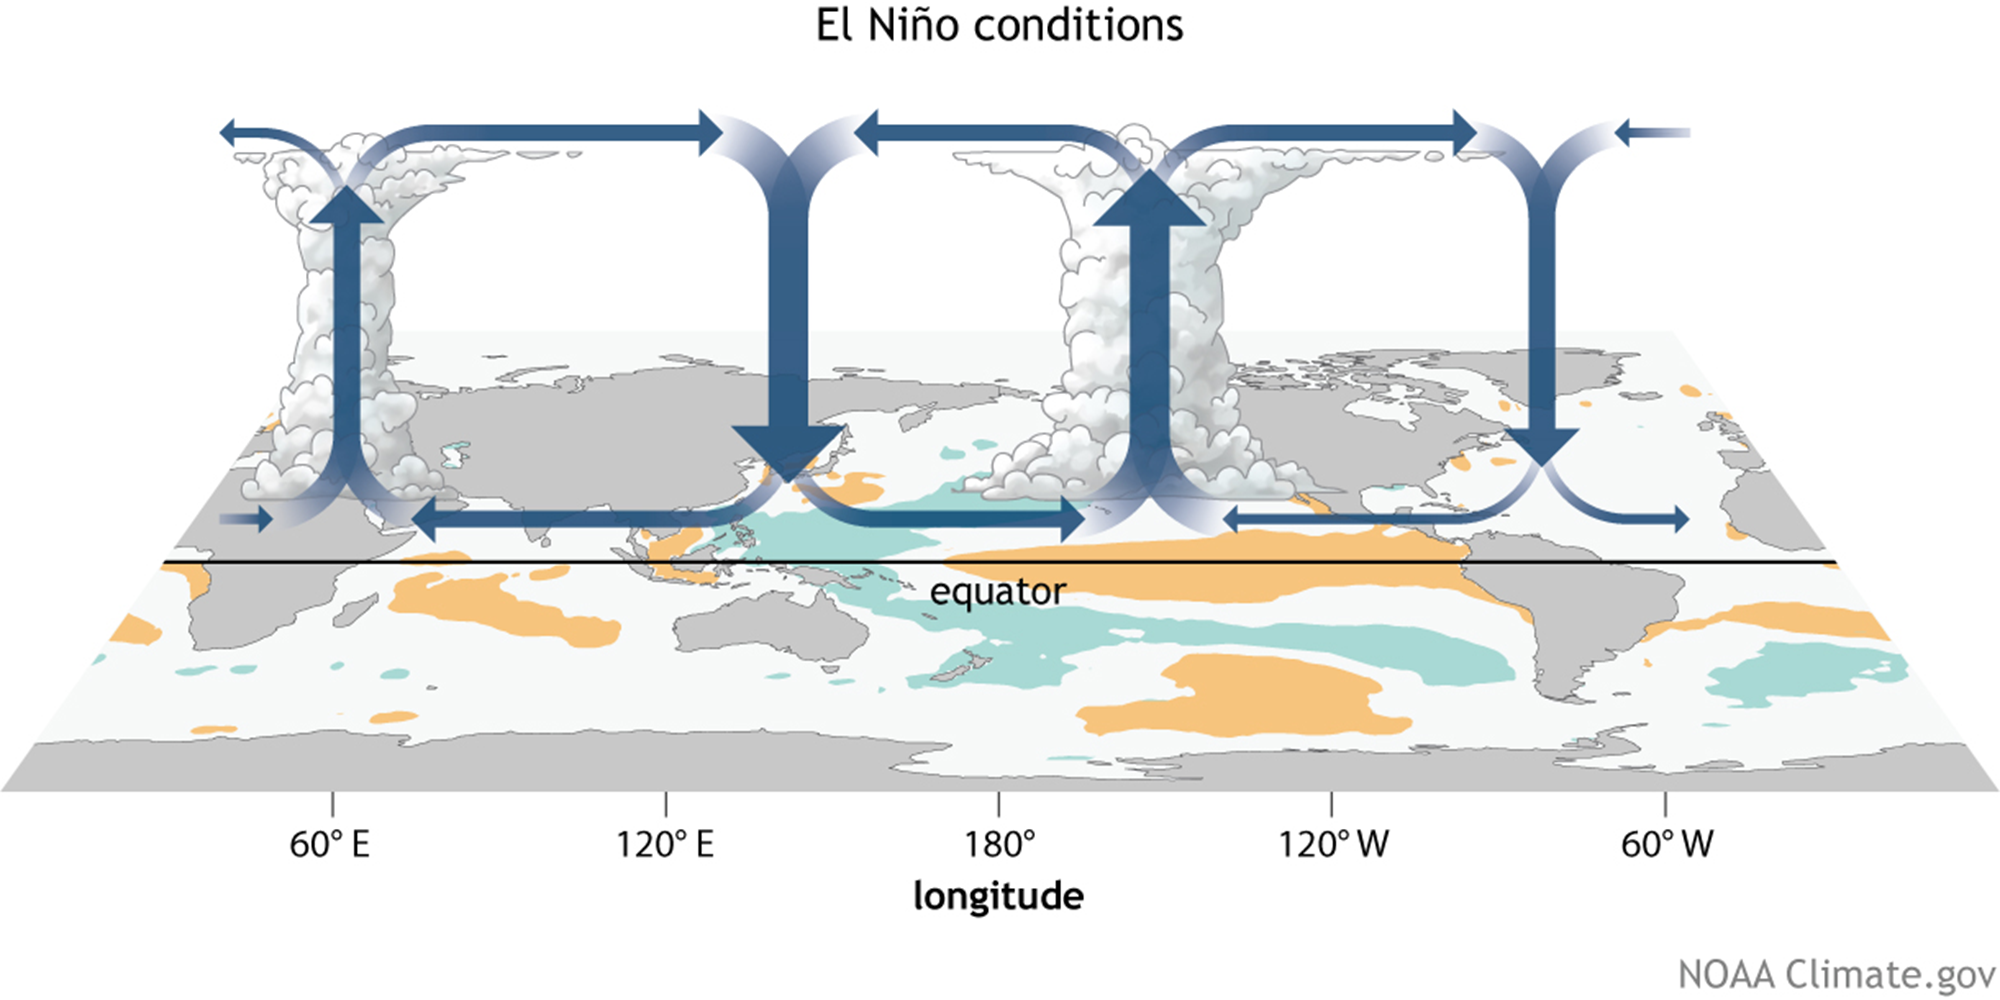
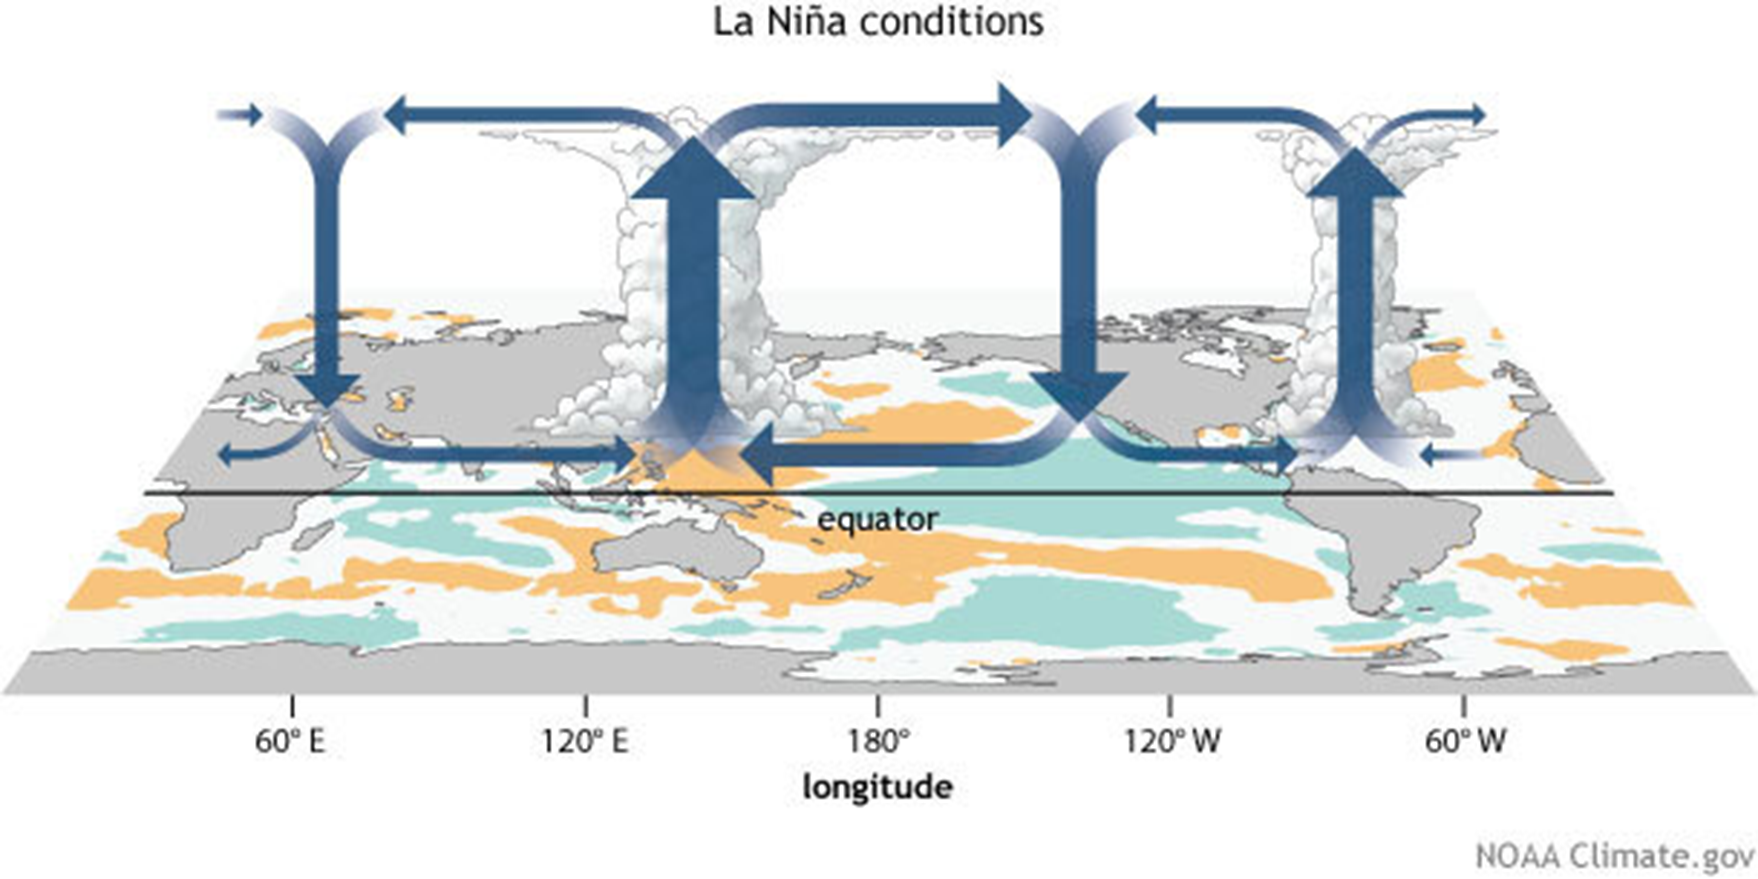
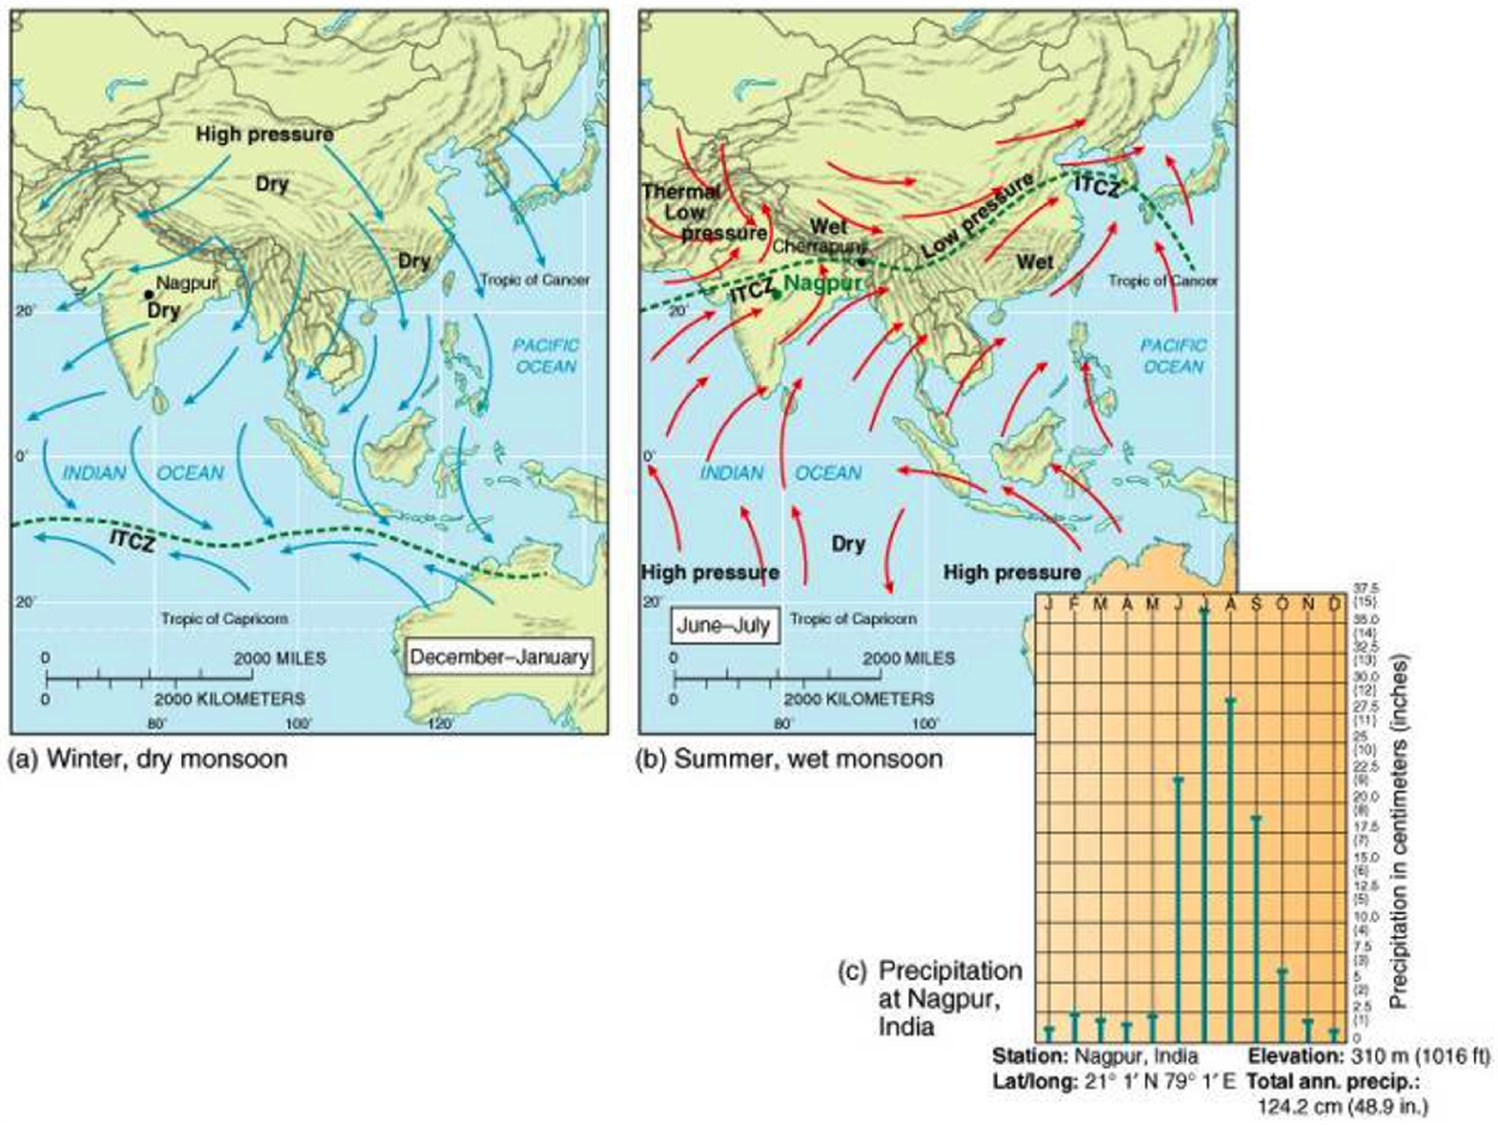
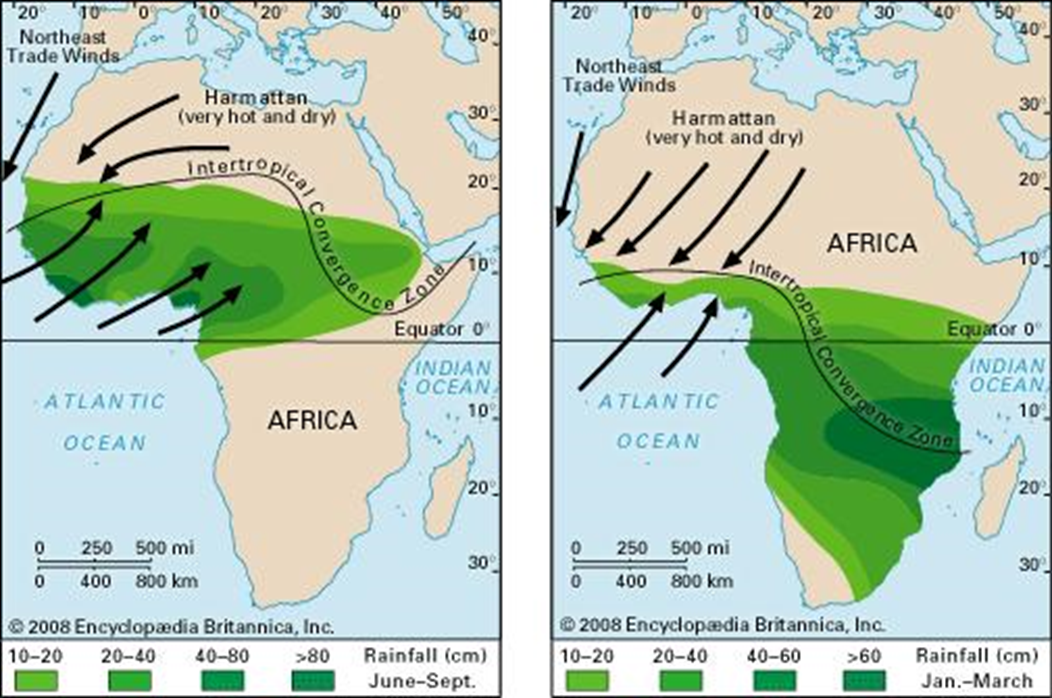
Monsoons
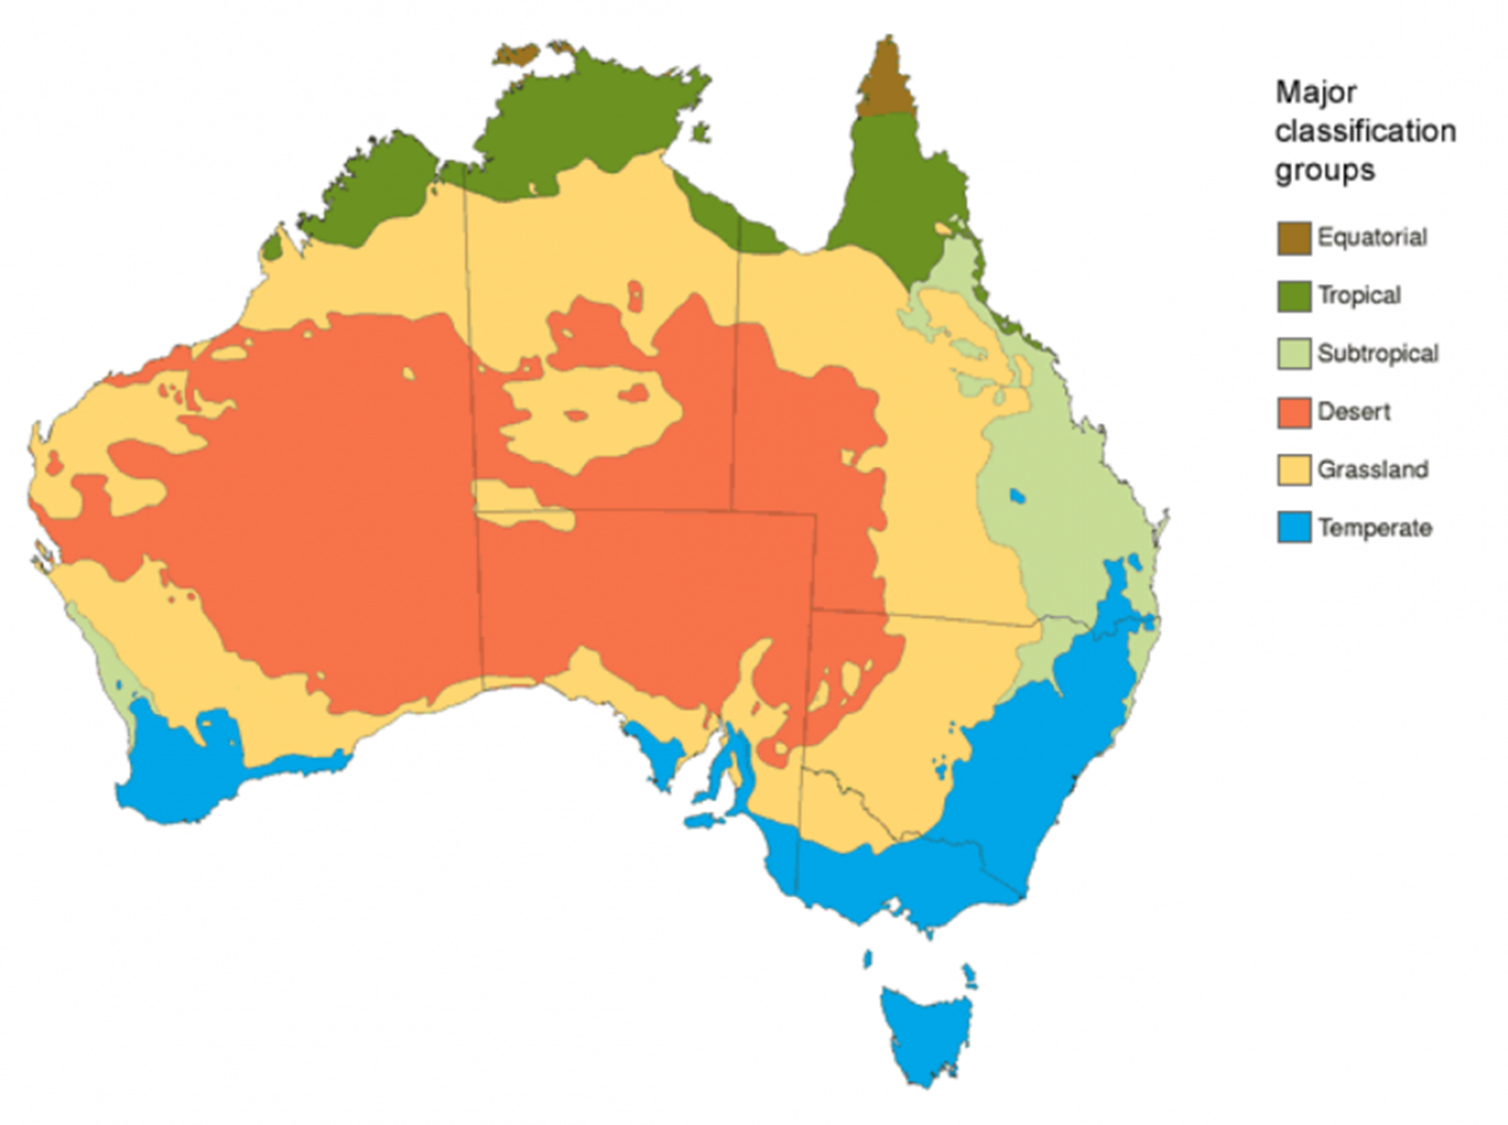
Australia Climate
Climate of South America

What causes the Desert / Arid climate to the West of the Andes mountains?
Due to the cold air moving up from the Antarctic ocean, the air is cold instead of warm, causing no clouds to be formed.
2.1 Chemical Evolution of the Atmosphere
We investigate evolution of Earth’s atmosphere and compare the evolution with the the evolutions of Venus and Mars atmospheres
Composition of the Earth’s Atmosphere
78% Nitrogen
21% Oxygen
1% CO2, Argon, etc.
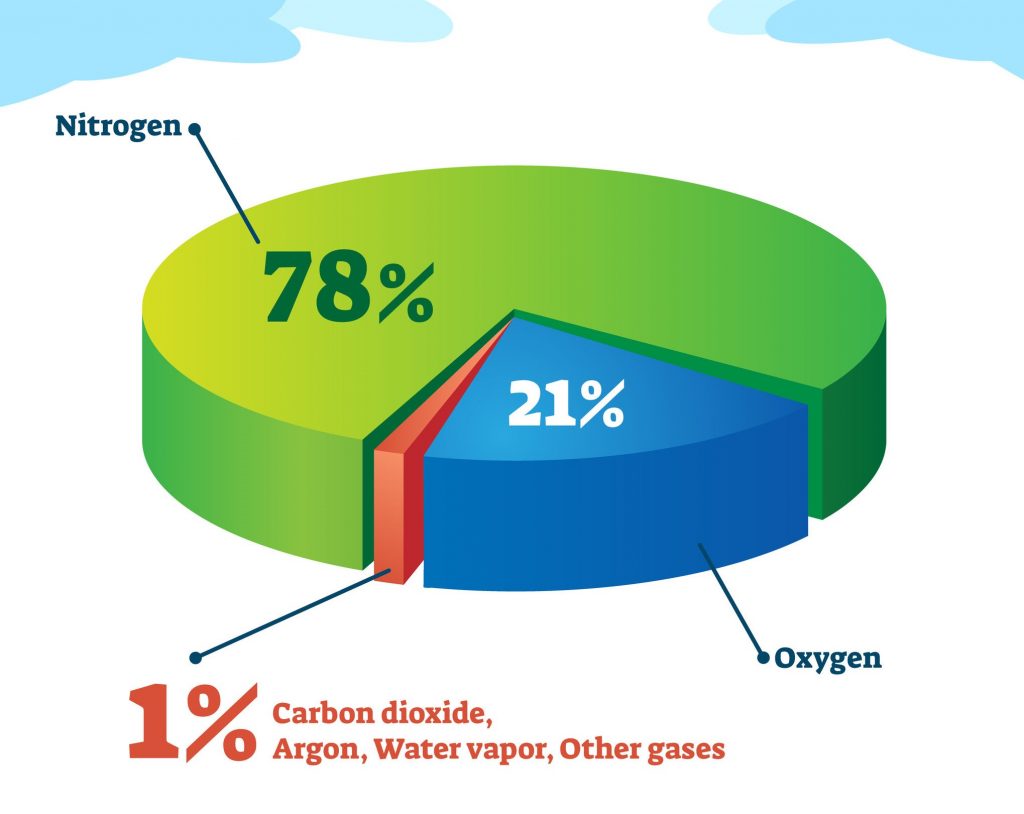
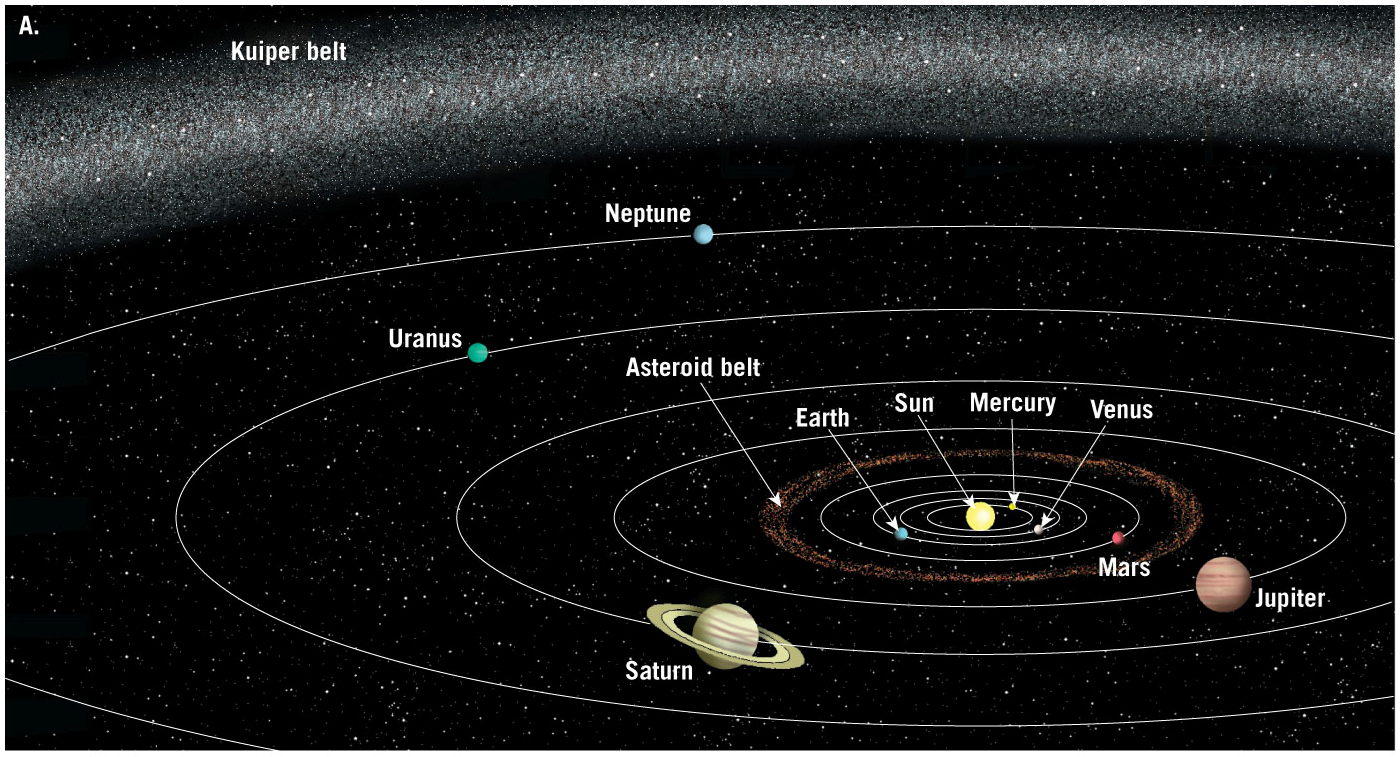
Comparison of Venus, Earth, and Mars atmosphere
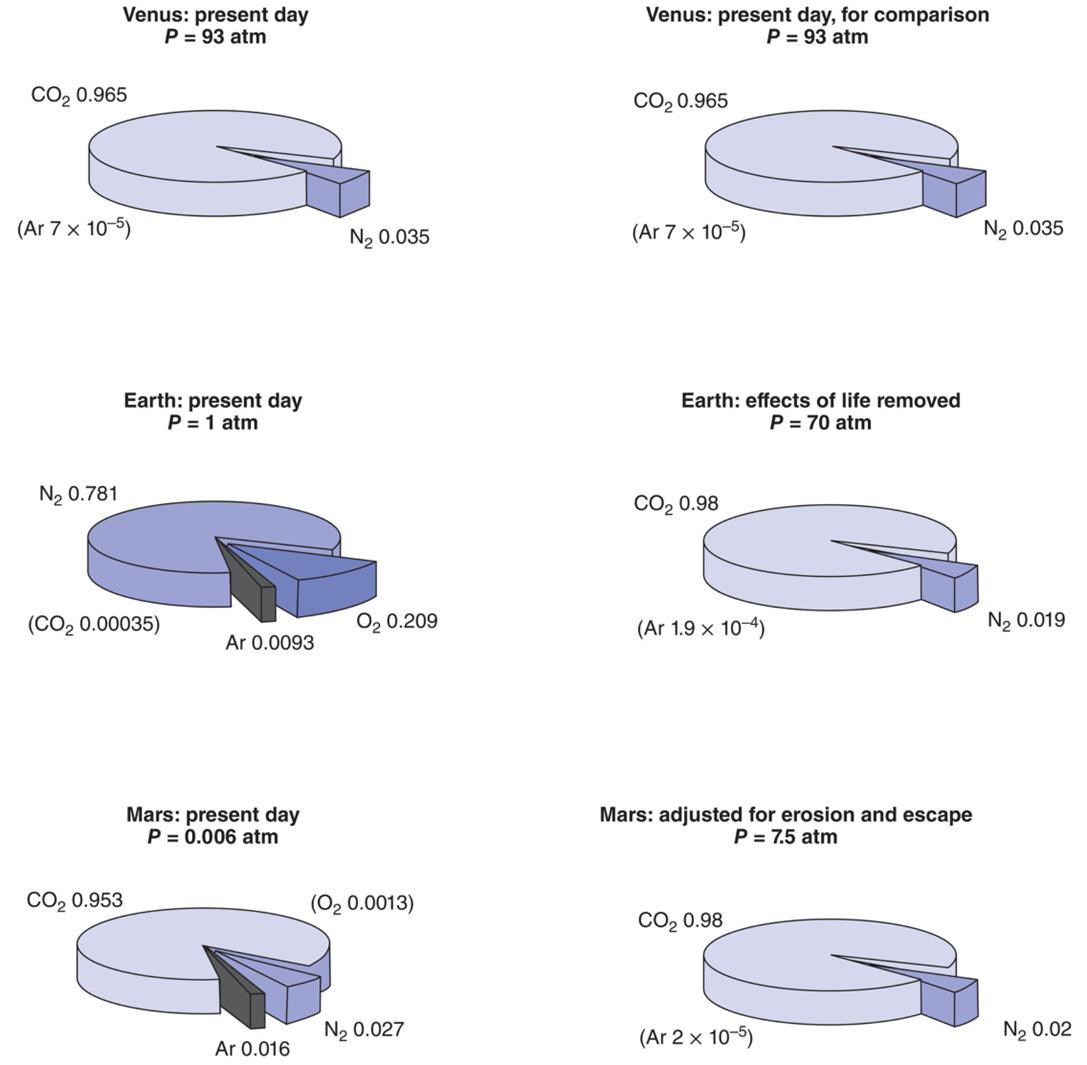
What has happened in the history of these atmospheres?
Four possible mechanisms could account for the existence of atmospheres on Venus, Earth, and Mars.
capture of gases from the primitive solar nebula
capture of some of the solar wind
collision with volatile‐rich comets and asteroids
release (outgassing) of volatile materials trapped together with the dust grains and planetesimals as the planets accreted
Evidence based on concentrations of noble gasses is taken as clear proof that Earth (and Mars and Venus) has lost almost all its primordial atmosphere, if such an atmosphere existed at all, and that the present atmosphere has been acquired later.
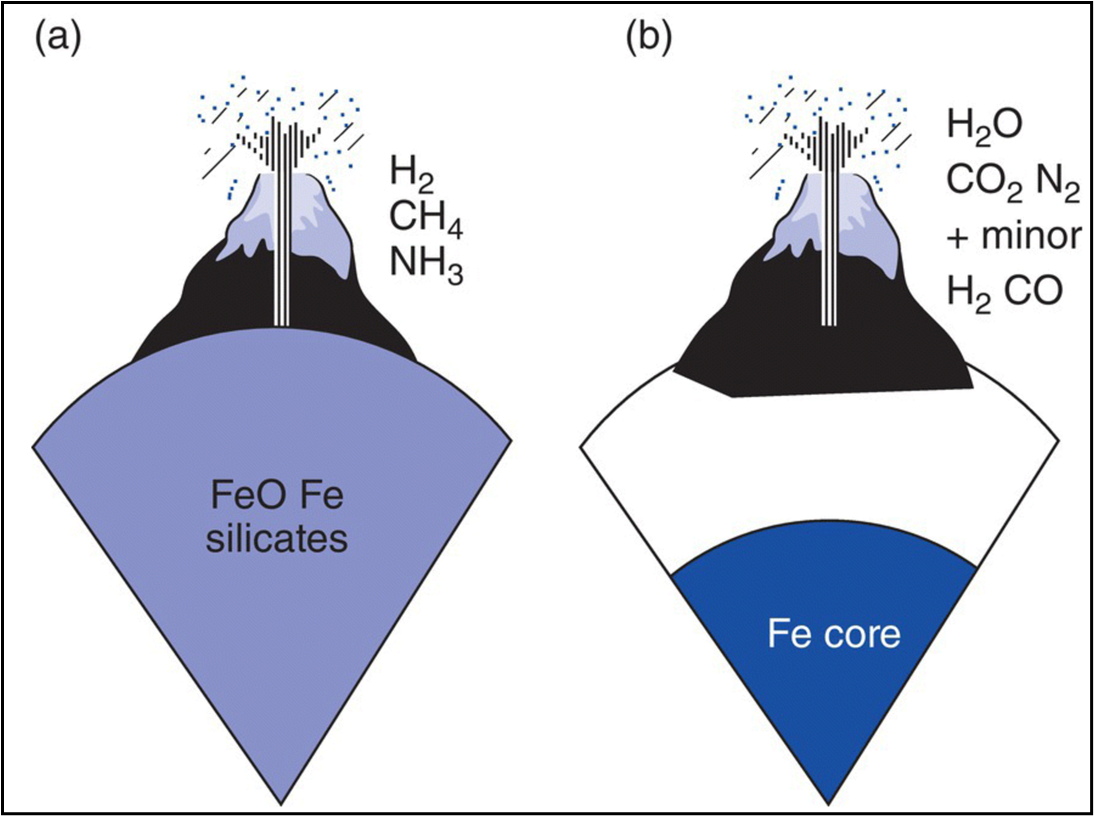
Release (outgassing) of volatile materials trapped together with the dust grains and planetesimals as the planets accreted
In (a), the gases pass through the iron‐rich mantle and are reducing
in (b), the gases feed the atmosphere after the Earth has differentiated into core, mantle and crust, and are thus only weakly reducing
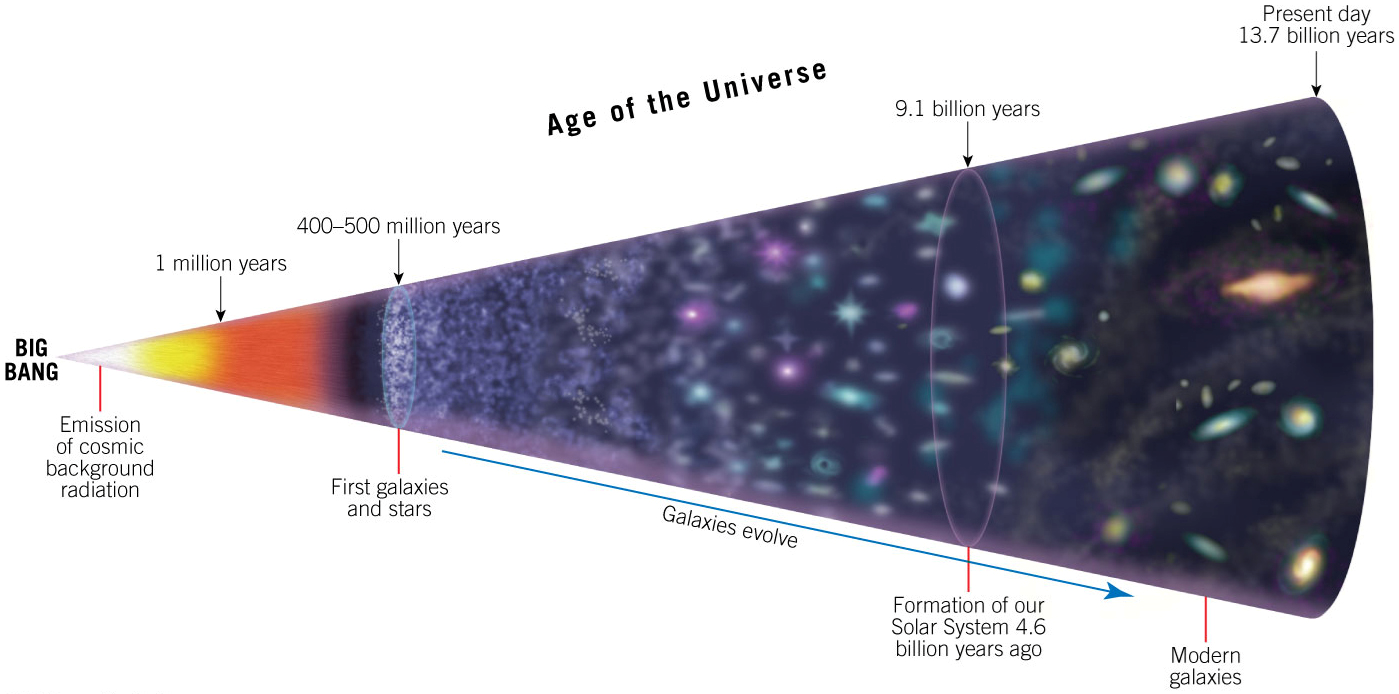
Timeline
Orbits of the Planets
2.2 Earth’s Atmosphere before Life Began
Most current models predict that the early atmosphere consisted mostly of CO2, N2, and H2O, along with traces of H2 and CO.
A most important aspect of atmospheric evolution on Earth is thus how atmospheric CO2 might be converted to solid carbonates. Inorganic weathering reactions (Wayne 2000) can convert silicate rocks such as diopside (CaMgSi2O6) to carbonate
This requires liquid water!

2.3 Comparison of Venus, Earth, and Mars
The composition and the chemical and physical behavior of the atmospheres of Venus and Mars provide further evidence about the evolution of our own atmosphere
In particular, comparisons of the three atmospheres show how the emergence of life on Earth modified our atmosphere dramatically from the atmospheres of our two planetary neighbors
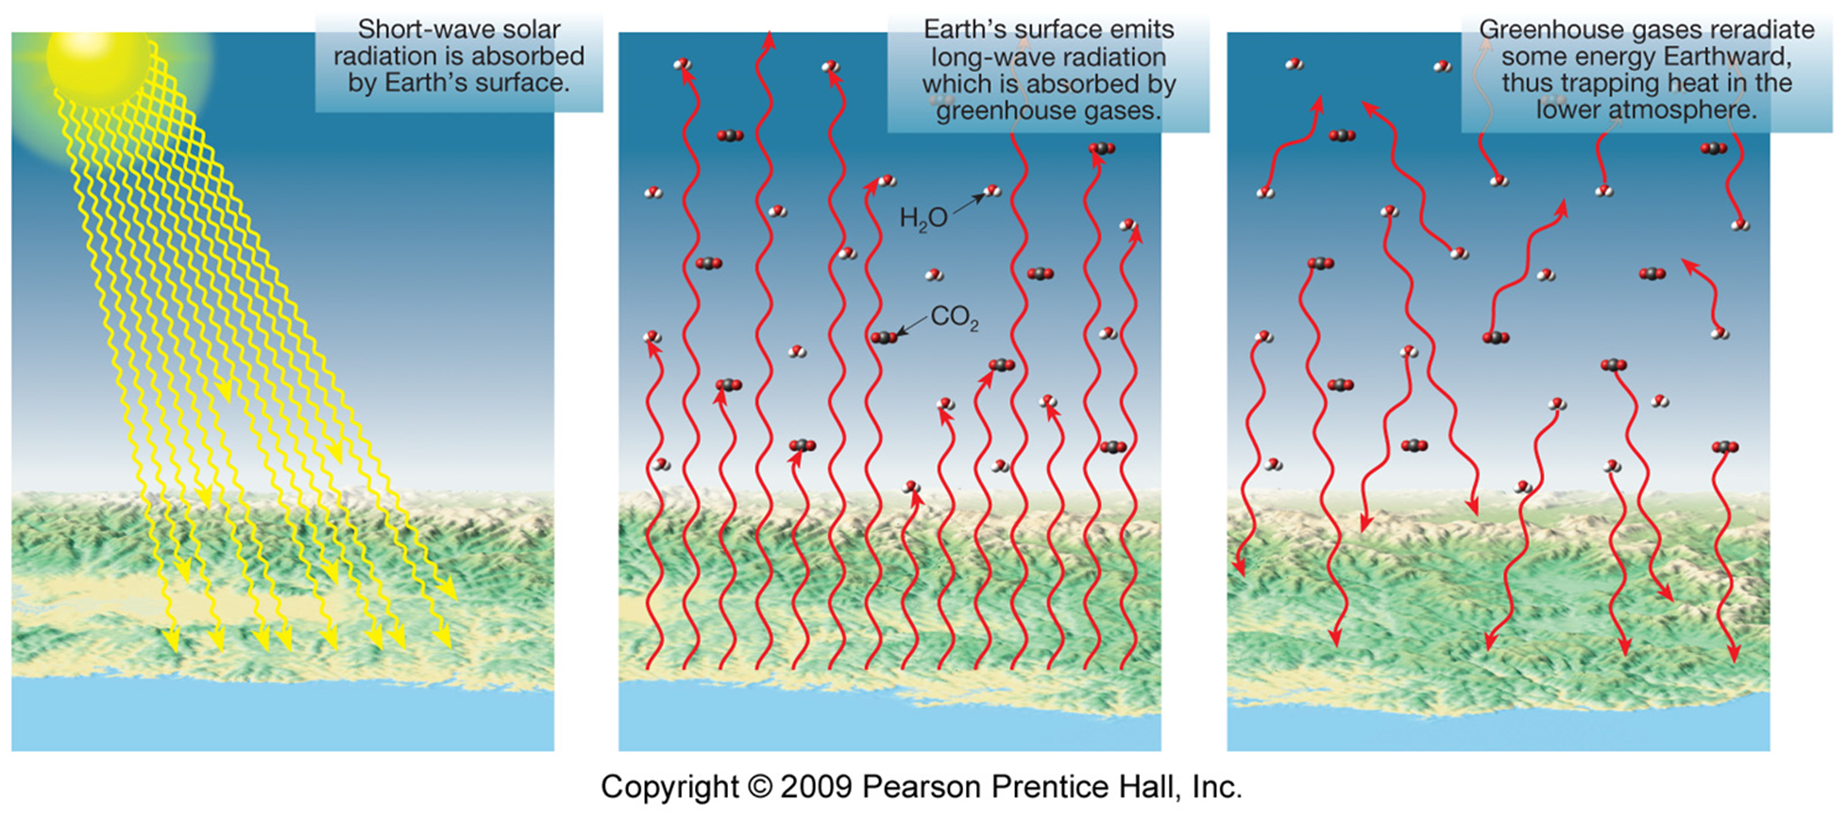
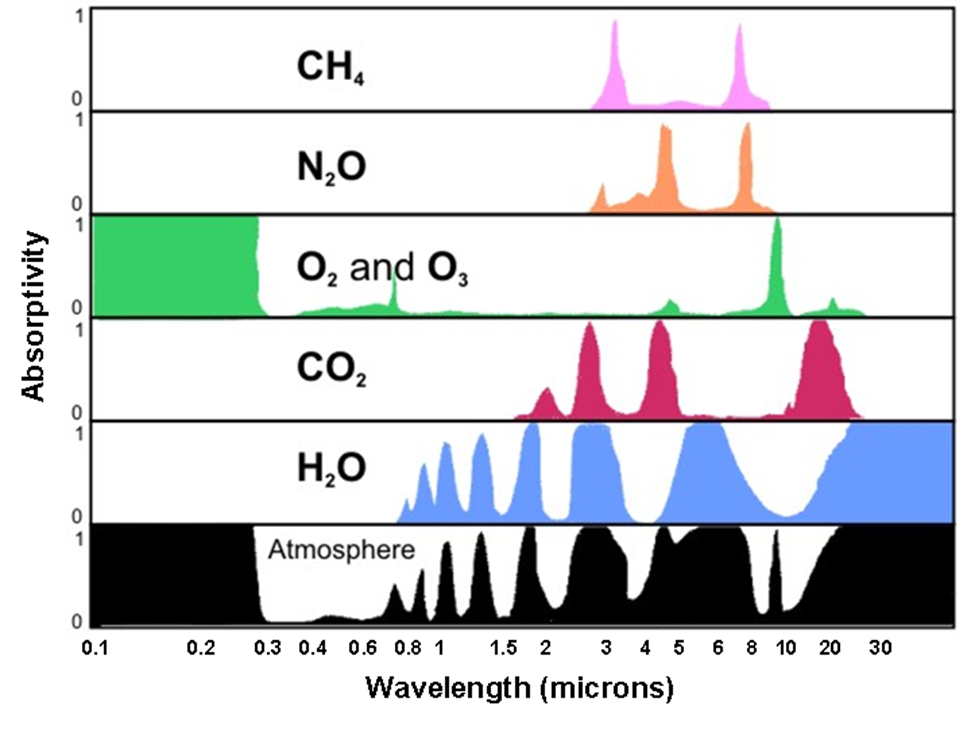
Greenhouse Effect
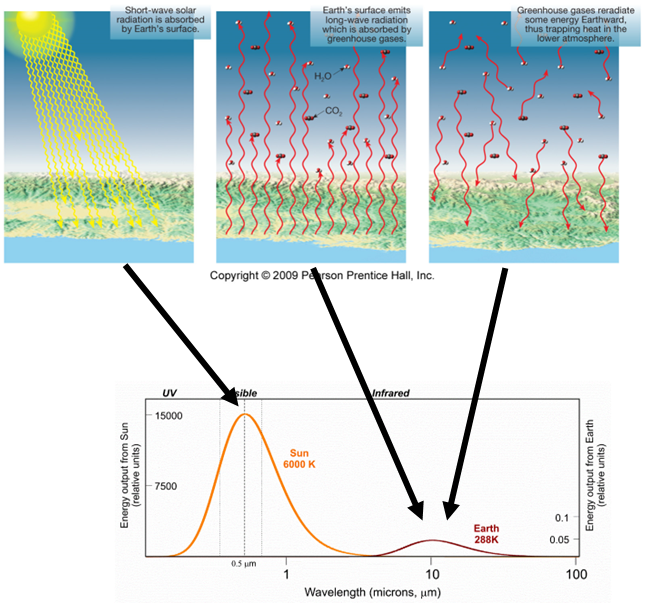
Venus
Close to the sun, causing the runaway greenhouse effect, causing vaporization of all surface water
Water vapor contributes largely to atmospheric heating. Since vapor pressures rapidly increase with increasing temp., thus further increasing trapping, there exists a positive feedback to the greenhouse effect
Evaporation from a planetary surface will proceed either until the atmosphere is saturated with water or until all the available water has evaporated
What happens on any particular planet will depend on the starting temperature in the absence of radiation trapping, since that will decide whether the vapor ever becomes saturated at the temperatures reached
On Mars and Earth, the additional heating due to liberation of water vapor is not sufficient to prevent the vapor reaching saturation as ice or liquid

Mars
Mars presents a sharp contrast
Surface channeling features suggest strongly that there was once liquid water on the surface
There seems to be no liquid water now, but there is water vapor in the atmosphere and clouds are observed
The polar caps (and much of the winter hemisphere) are covered with water ice, and the winter polar cap probably contains solid CO2 as well
The escape velocity for relatively small Mars is less than half (and the energy required for escape thus less than a quarter) that for either of the two larger planets. A large proportion of the outgassed species can therefore have been lost from the Martian atmosphere

Water on Earth
Geological evidence suggests that the waters of the ocean have neither completely frozen nor completely evaporated for at least the past 3.5 billion years
Yet the infrared luminosity of the Sun has increased substantially over that period, leading to the ‘faint young Sun paradox’ to which we shall return later when we examine CO2 concentrations in more detail
Thermostatic control seems to have been exerted by a reduction of the concentration of In the absence of water on Venus
carbonate rocks have probably never been formed, and most of the carbon dioxide remains in the atmosphere
The total burden of CO2 is not much different on Earth from that on Venus; it is just the distribution between reservoirs that differs
2.4 Life and Earth’s Atmosphere
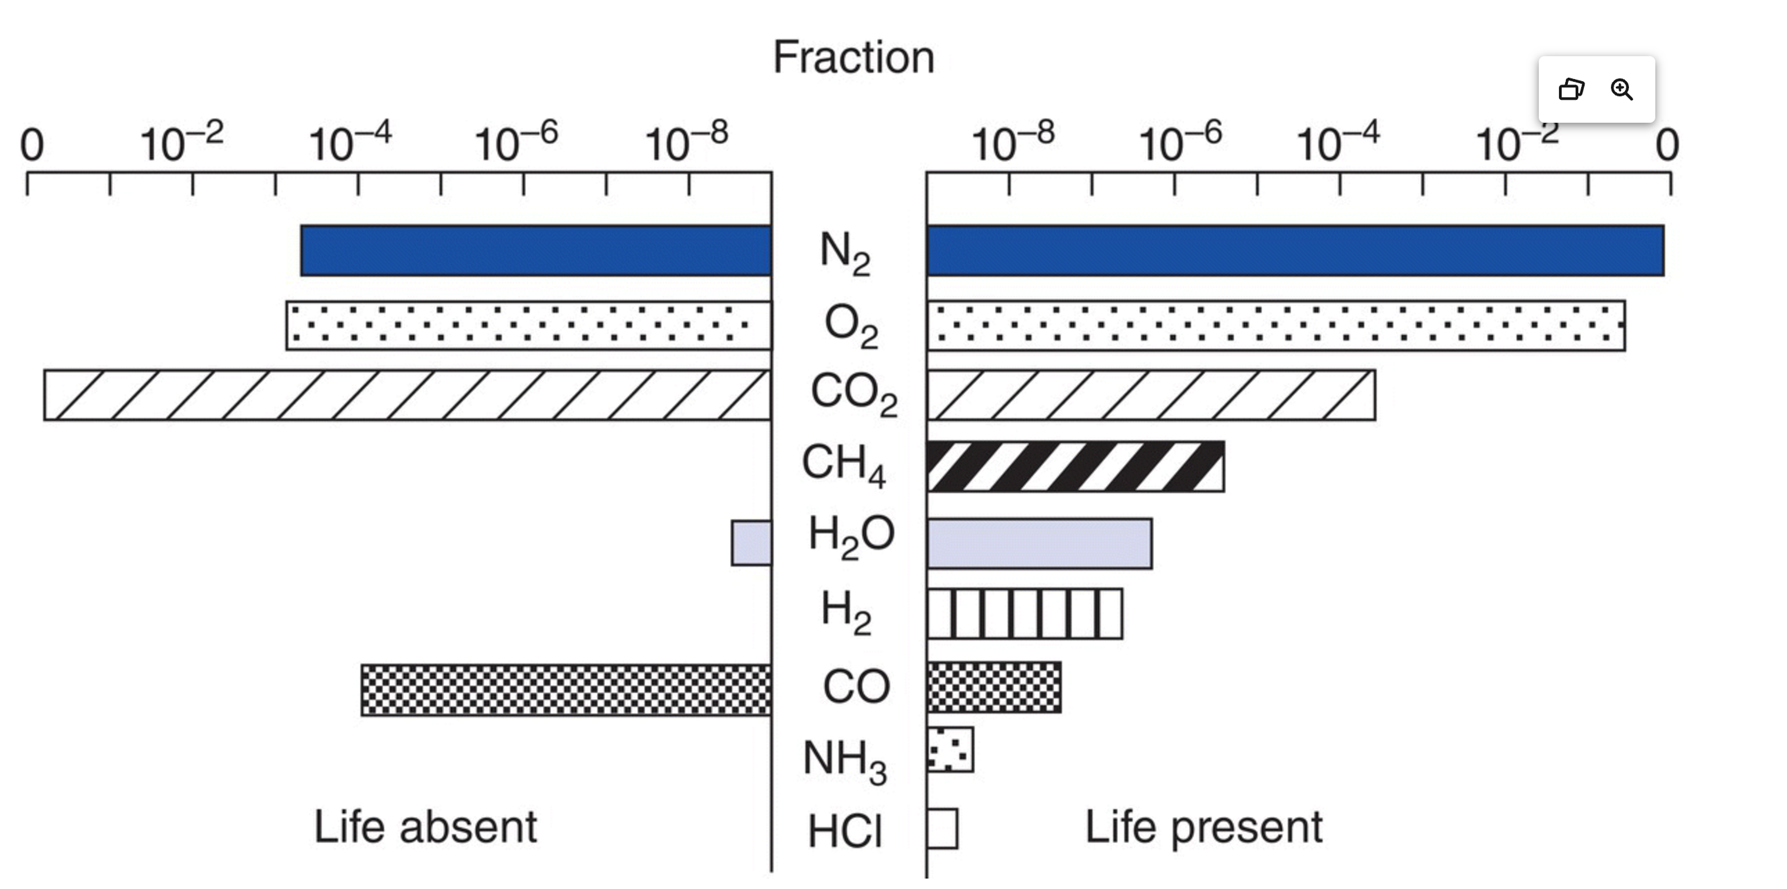
Earth’s atmosphere is a disequilibrium mixture of chemical species
atmosphere is like a low‐temperature combustion system, and it contains a variety of easily oxidizable substances, such as H2, CH4, CO, H2S, and hundreds of other minor constituents in the presence of molecular oxygen
even the nitrogen and oxygen, the major components of the atmosphere, are not in thermodynamic equilibrium.
Biosphere influence on composition
Earth's atmosphere thus has a composition that is influenced by the biosphere
Composition, temperature, and pressure of the atmosphere can each be modulated in response to biological activity, and these atmospheric parameters themselves have consequences for that activity
Temperature, for example, is determined in part by the greenhouse heating afforded by atmospheric CO2; the partial pressure of CO2 in the atmosphere is strongly dependent on photosynthetic activity (short term) and chemical weathering of silicate rocks (long term) that are themselves sensitive to temperature
Earliest evidence of life
3.5 billion years ago, life was almost certainly extant
Several scientists believe that there is ample morphological evidence to document the existence of microbiota in sediments that have not been metamorphised
tests both for biogenicity and for the absence of rock modification continue to excite controversy
According to Schopf (2006), the oldest fossils meeting the criteria for dating authenticity are from 3.5 Gyr ago, and were found in the Apex chert of northwestern Australia
They consist of 11 types of prokaryotic thread‐like organisms, and include several types of cyanobacteria (blue‐green algae)
Cyanobacteria not only both produce and consume oxygen, but they are also the main organisms responsible for fixing nitrogen from the present‐day atmosphere
Circumstantial support for this conclusion is given by several discoveries of stromatolites (Greek for ‘layered rock’) from the same period
There is even indirect evidence that life existed 3.8 billion year ago, although supposed microfossils from the Isua sedimentary deposits of this date may have nonbiological origins
carbon‐isotope indicators of biological activity in the same deposit may have been affected by metamorphic processes
The similarities amongst all present‐day organisms indicate the presence of a common ancestor from which all known species have diverged through the process of evolution
It is most unlikely that the earliest organisms to appear on Earth produced oxygen
more probably methane‐producing bacteria
2.5 CO2 in the Earth’s Atmosphere
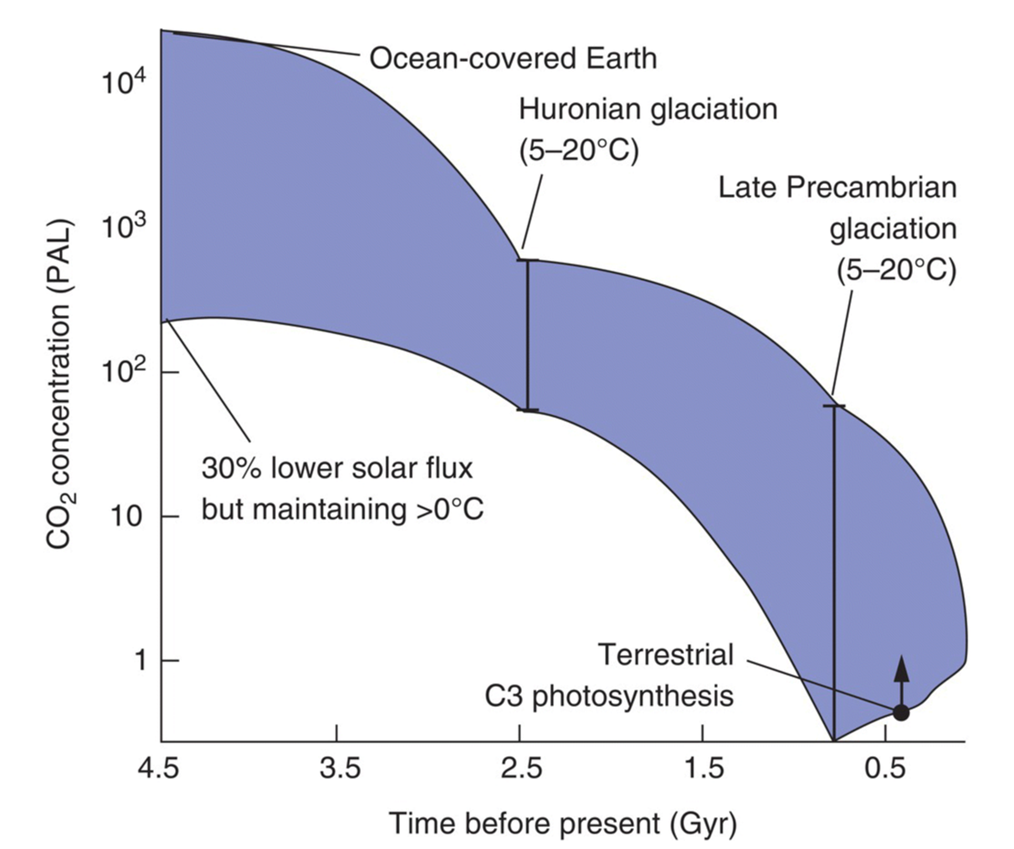
Whatever greenhouse‐gas or other mechanism kept the Earth warm, it must have been smoothly reduced to avoid exceeding the high‐temperature limit for life
CO2 seems the most likely greenhouse gas to have exerted thermostatic control of our climate (Kasting 1993), although in the earliest stages after the appearance of life, methane might also have been a critical contributor
Negative‐feedback mechanisms can be identified for both CO2 and CH4
In the case of CO2, nonbiological control might include acceleration of the weathering of silicate minerals to carbonate deposits in response to increased temperatures