W7 Levels of measurement & descriptive statistics
Page 4: Learning Outcomes
By the end of the lecture, students should be able to:
Explain nominal, ordinal, interval, and ratio data with examples.
Demonstrate understanding of measures of central tendency (mean, median, mode) and spread (variance, standard deviation).
Identify basic mathematical equations related to statistics.
Page 6: Types of Statistics
Descriptive Statistics:
Summarize and describe datasets
central tendency and spread.
Concerned with concrete/known values.
Inferential Statistics:
Use probability to infer conclusions about larger population samples.
Abstract/estimated values.
Page 8: Levels of Measurement
Key question: How much detail do the data convey?
Four levels:
Nominal
Ordinal
Interval
Ratio
Page 9: Nominal Data
Also called categorical data; lowest information level.
Categories have no numerical relationships (figures) between categories
Examples include gender (male/female/non-binary), language proficiency (bilingual/monolingual), and colour categories.
only tells us the datapoint is in one category: groups are separated
Page 10: Ordinal Data
Ranked positions; numbers do not represent counts
the exact interval between positions is still unknown (winner, second, third)
Examples: ranks in competitions, Likert scales (e.g., agree/disagree).
Page 11: Interval Data
Equal units; distances between scale points are consistent.
Examples include IQ scores, temperature (Celsius/Fahrenheit).
Can calculate a range of stats - mean, median etc.
Page 13: Ratio Data
Interval data with a true zero, allowing for ratios.
Cannot take negative values.
Examples include height, weight, and duration of time.
Page 12: Likert Scale Debate
Likert scale can be ordinal or interval based on design.
Single-item scores treated as ordinal
combined multiple items may be treated as interval.
Page 14: Measurement Levels Summary
Nominal: Categorical data; frequency count only.
Ordinal: Orders data; mode and median applicable.
Interval/Ratio: Mean and standard deviation can be calculated.
Page 19: Descriptive Statistics
central tendency
most typical score
dispersion (value variance)
How much do the values vary around the central value
Both measures are necessary for a complete data understanding.
Page 20: Measures of Central Tendency
Mean:
Arithmetic average; sum of scores/number of scores.
Median:
Midpoint dividing scores, half the scores above the median and half above, half below.
Mode:
Most frequent score; the simplest measure of central tendency.
Page 21: Central Tendency Considerations
Mean is most commonly, however its the most sensitive to outliers.
If data contains extreme values, median is preferred because it provides a better indication of the typical score
Visualize data to understand its structure.
Reference the "datasaurus" for illustration of data visualization importance.
Page 27: Data Distribution Overview
If a dataset is symmetrical, then the mean, mode and median are all the same.
Page 29: Measures of Spread/Dispersion
Range:
Difference between highest and lowest score; sensitive to outliers.
Interquartile Range (IQR):
Scores between the 25th and 75th percentiles, excluding extremes.
Variance:
Average squared deviation from the mean; uses information from all scores.
Standard Deviation (SD):
Square root of variance; indicates average deviation from the mean.
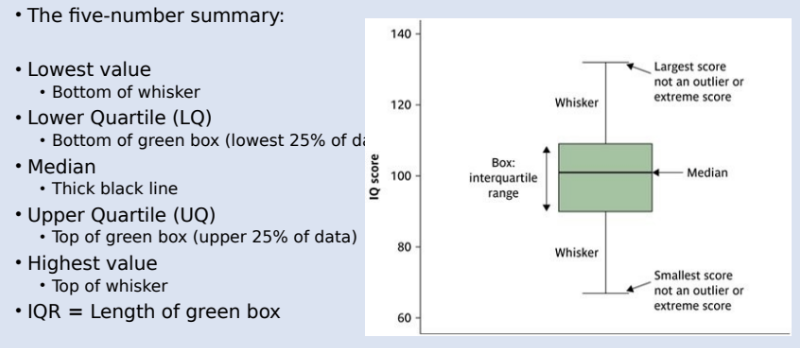
Page 31: Boxplots Overview
Page 37: Standard Deviation Calculation & Importance
most commonly used measure of spread
Square root of variance; puts variance back into the original scale/values measured
Page 38: Understanding SD Clusters
If the SD is large, the data are dispersed
If the SD is small, the data are more clustered around the mean
Page 39: Describing a Data Set
Discuss changes in understanding dataset with key metrics: data points count, max/min ranges, central tendency.
Page 43: Impact of Measurement Levels on Descriptive Statistics
Descriptive statistics change according to level of measurement
Nominal data = frequency
Ordinal data = frequency, mode, median
Interval/ratio = mean, SD
Page 45: Key Terms for Learning
Descriptive statistics
Inferential statistics
Nominal/categorical
Ordinal
Interval
Ratio
Central tendency
Spread/dispersion
Mean
Median
Mode
Range
Inter-quartile range
Variance
Standard deviation
∑
N