AP Statistics Notes: Unit 3
Introducing Statistics:
A proper analysis of data must take into account how the data was collected
Keep in mind that samples may not be a good representative of the whole population data taken from
Notice how individuals in the sample are different from all individuals within the population comparatively
Introduction To A Planning Study:
Identify the population vs. the sample in your study
A sample is a subset of a population
Generalizations can only be made if the sample is randomly selected and if the entirety of the sample is taken from the same population
When evaluating a study, consider confounding variables, outside influences, and the type of study
Types of Studies/Samples:
Experimental
Observational
Randomization
Matched pairs design
Blind experiments
Stratified samples
Bias samples
Placebo and control groups
Simple random samples

Random Sampling and Data Collection:
Random samples, when well executed, tend to provide a good representation of populations through data (unbiased estimates)
A simple random sample gives every group of (n) individuals equal chance of being selected
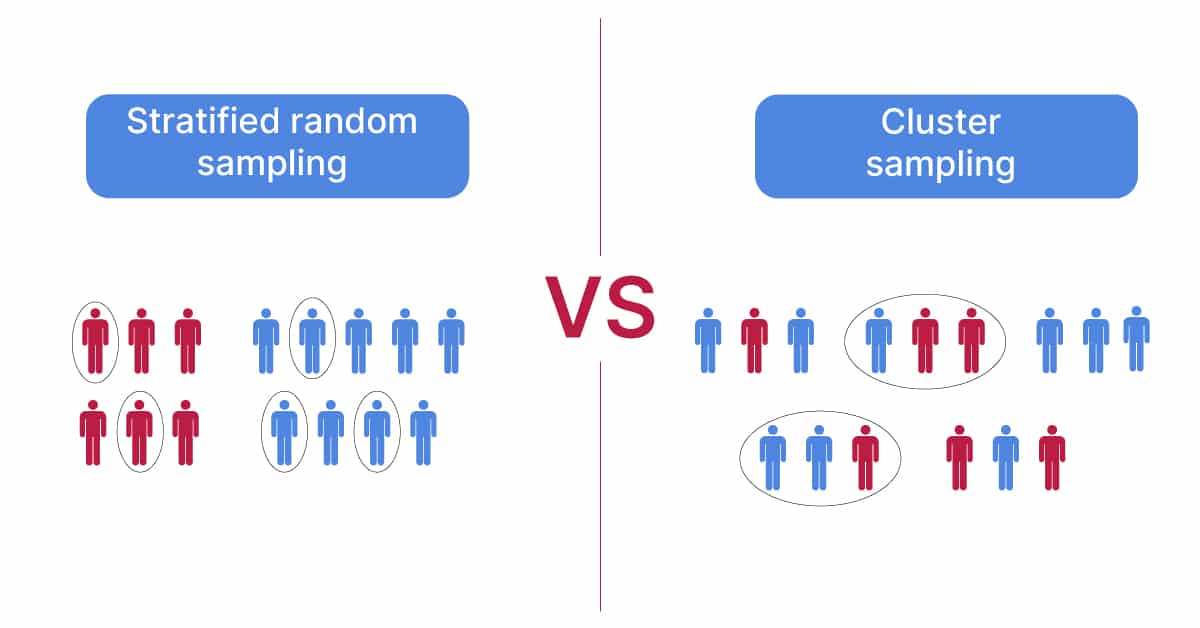
Cluster sampling creates groups, then randomly samples entire groups (from their group of multiple clusters) (effective when heterogenous)
Stratified sampling creates groups and then takes random samples from each of those groups (effective when homogenous)
A voluntary response sample consists of people who choose themselves by responding to a general invitation.
Choosing individuals from the population who are easy to reach results in a convenience sample.
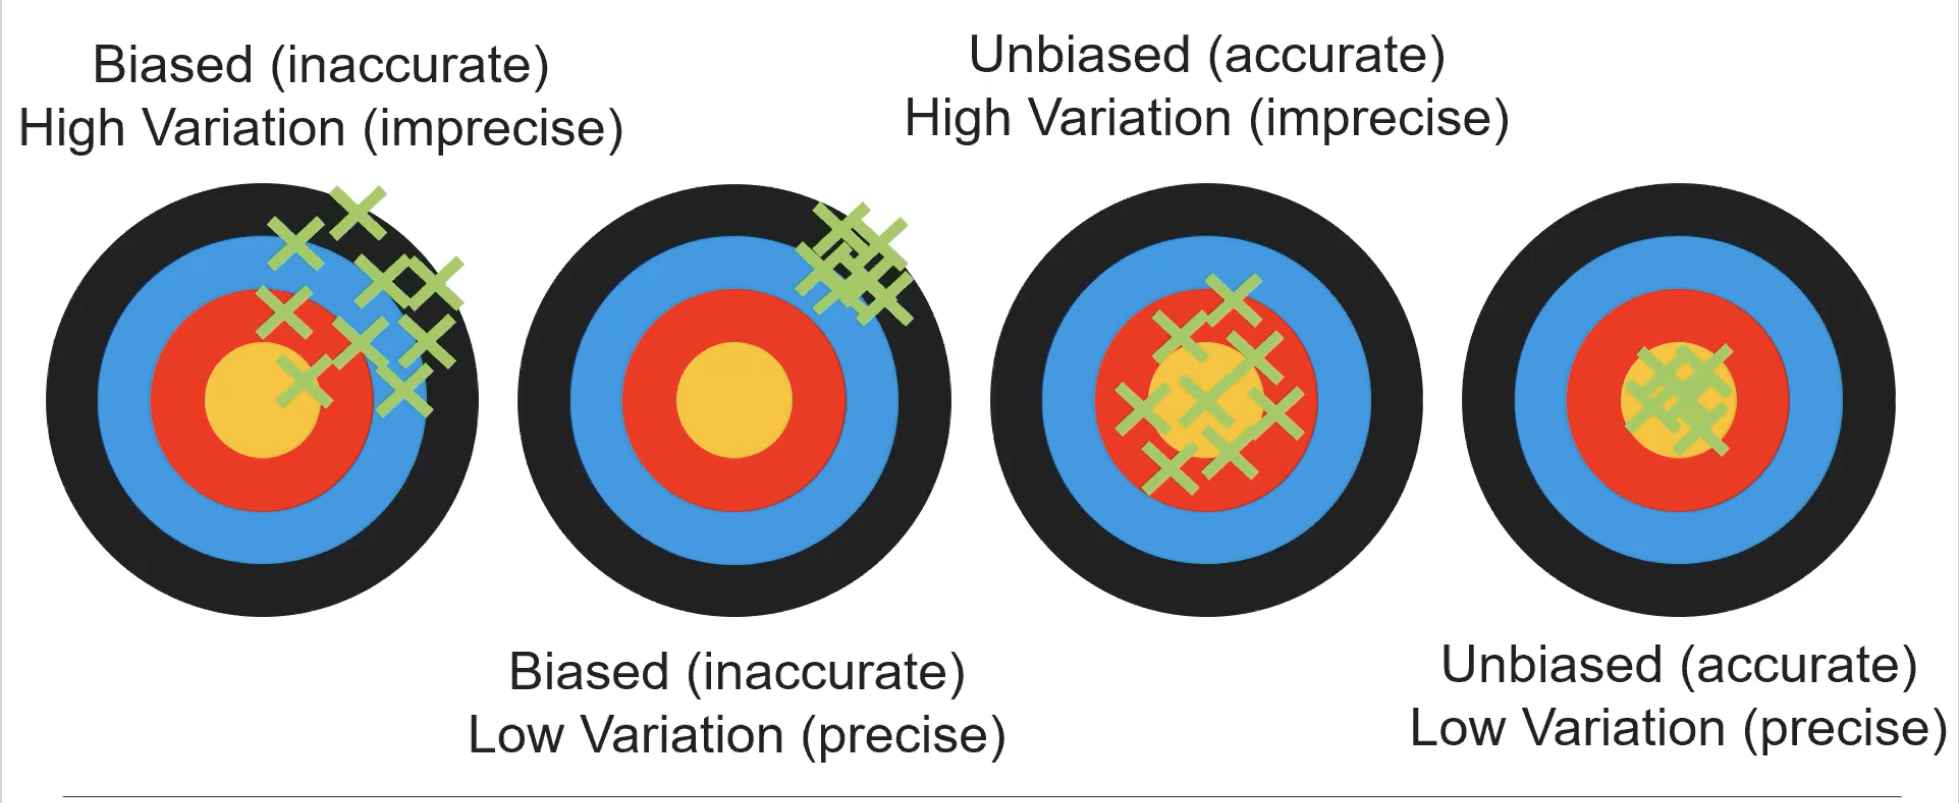
Low variation provides precise data, while high variation data provides nonprecise data
Biased samples provide inaccurate data, while unbiased samples provide accurate data
A census collects data from every individual in the population.

Potential Problems With Sampling:
Bias arises when certain responses are systematically favored over others
When explaining a bias, make sure to compare differences between sample and population to highlight contrast
Also, when explaining bias include if data is over or under-estimated
Have the reader understand what the sampling method is and why it causes bias
Undercoverage: occurs when some members of the population cannot be chosen in a sample.
Nonresponse: occurs when an individual chosen for the sample can’t be contacted or refuses to participate.
Taking Random Samples:
Table D (select a line, split numbers in reflection to sample amount, take a sample)
Use a graphing calculator (Step 1: MATH Step 2: PRB Step 3: randInter(, Step 4: enter)
Stratified: spilt data into groups of strata, then SRS from each strata to get a sample of a desired amount
Cluster: split data into groups based on proximity, then randomly select each cluster until the desired sample amount is satisfied
Principles of Experimental Design:
Comparison: use a design that compares two or more treatments
Random Assignment: Use the chance to assign experimental units to treatment
Control: Keep other variables that might affect the response the same for all groups
Replication: Use enough experimental units in each group so that any differences in treatment groups can be distinguished from chance
Designing Studies:
Completely randomized design: the experimental units are assigned to the treatments completely by chance
Double-blind experiment: neither the subjects nor those who interact with them and measure the response variable know which treatment a subject received
Single-blind experiment: only the researcher knows which treatment the experimental units received
Observed effect: so large that it would rarely occur by chance is called statistically significant
A Block: a group of experimental units that are known before the experiment to be similar in some way that is expected to affect the response to the treatments
Randomized block design: the random assignment of experimental units to treatments is carried out separately within each block
⭐️The main purpose of a control group is to provide a baseline for comparing the effects of the other treatments.

