Intro to Ecology
}}Growth Chart Thing}}
A %%Type I%% curve is flat at the start, reflecting low death rates during early and middle life, and then drops steeply as death rates increase among older age groups. Many large mammals, including humans, that produce few offspring but provide them with good care exhibit this kind of curve.
organisms that fit this curve are typically mammals, large, have an extended time before reproductive age, and have a long lifespan
In contrast, a %%Type III%%curve drops sharply at the start, reflecting very high death rates for the young, but flattens out as death rates decline for those few individuals that survive the early period of die-off. This type of curve is usually associated with organisms that produce very large numbers of offspring but provide little or no care, such as long-lived plants, many fishes, and most marine invertebrates. \n
%%Type II%% curves are intermediate, with a constant death rate over the organism’s life span. This survivorship occurs in some rodents (including Belding’s ground squirrel), invertebrates, lizards, and annual plants.
\n

\n
{{Abiotic Factors{{
Temperature
Environmental temperature is an important factor in the distribution of organisms because of its effect on biological processes. Cells may rupture if the water they contain freezes (at temperatures below 0°C), and the proteins of most organisms %%denature%% at temperatures above 45°C and in cooler temperatures the parts move slower resulting in %%less efficient%% proteins. Most organisms function best within a %%specific%%range of environmental temperatures. \n
Water and Oxygen
The dramatic variation in water availability among habitats is another important factor in species distribution. Species living at the seashore or in tidal wetlands can %%desiccate%% (dry out) as the tide recedes. Terrestrial organisms face a nearly constant threat of desiccation, and the distribution of terrestrial species reflects their ability to obtain and retain water. Many amphibians, such as the Paedophrynefrog in Figure 40.1, are particularly vulnerable to drying because they use their moist, delicate skin for gas exchange. \n \n Water affects oxygen availability in aquatic environments and flooded soils. Oxygen diffuses slowly in water. As a result, its concentration can be low in certain aquatic systems and soils, limiting%%cellular respiration and other physiological processes%%. Oxygen concentrations can be particularly low in deep ocean and deep lake waters and sediments where organic matter is abundant. \n
Salinity
The salt concentration of water in the environment affects the water balance of organisms through %%osmosis%%. Most aquatic organisms are restricted to either freshwater or saltwater habitats by their limited ability to osmoregulate (see Concept 32.4). Although most terrestrial organisms can excrete excess salts from specialized glands or in feces or urine, salt flats and other high-salinity habitats typically have few species of plants or animals. \n
Sunlight
Sunlight provides the energy that drives most ecosystems, and too little sunlight can limit the distribution of %%photosynthetic%%species. In forests, shading by leaves makes competition for light especially intense, particularly for seedlings growing on the forest floor. In aquatic environments, most photosynthesis occurs near the surface, where sunlight is more available. \n
Rocks and Soil
On land, the %%pH%%, mineral composition, and physical structure of rocks and soil limit the distribution of plants and therefore of the animals that feed on them. The pH of soil can limit the distribution of organisms directly, through extreme acidic or basic conditions, or indirectly, by affecting the solubility of nutrients and toxins. \n \n In a river, the composition of rocks and soil that make up the substrate (riverbed) can affect water%%chemistry%%, which in turn influences the resident organisms. In freshwater and marine environments, the structure of the substrate determines the organisms that can attach to it or %%burrow%% into it.
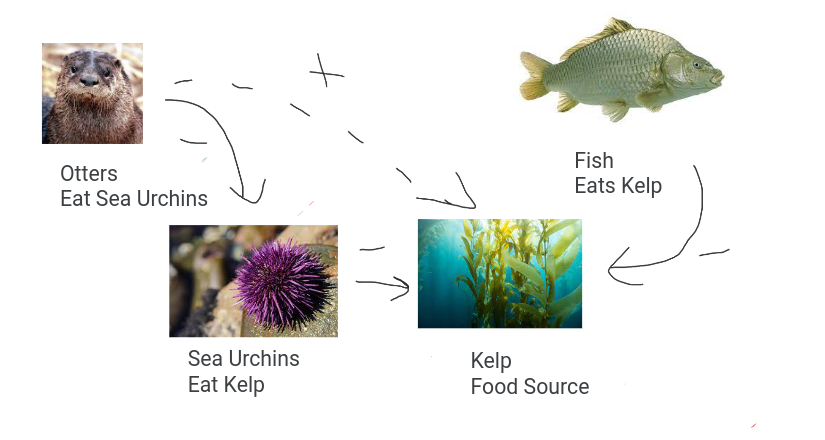
<<Direct and Indirect Relationships<<
Actions of organisms impact others
These interactions make up ecosystems and contribute to energy flow
\n
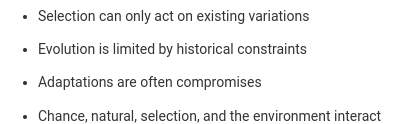
[[Natural selection review[[
Why can't ‘perfect’ organisms be fashioned
Compromise -
Life is about trade offs
for example, human legs can perform work but are susceptible to injury
Giraffe necks are good for eating off trees, bu not for drinking water from the floor
Existing variation
new phenotypes cannot be brought into existence on its own
diversity si required for evolution to happen
No goal
natural selection is not driven by a goal
]]Exponential and Logistic Growth]]
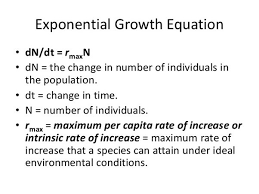
{{Exponential growth{{
idealized conditions
max reproduction rate
abundant resources
r selection
high intrinsic rate of increase
may be followed by a sudden drop in population size (cicadas)
best fits type III curves

It is density-independent
In these simple models of exponential growth, birth and death rates stay the same through time, regardless of population size. They are density-independent
Density-independent factors are natural disasters, fires, hurricanes
these events do not rely on the size of a population
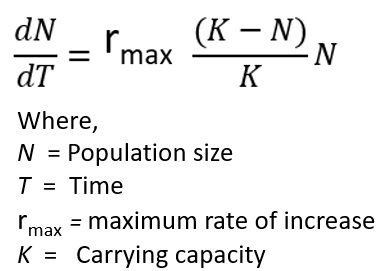
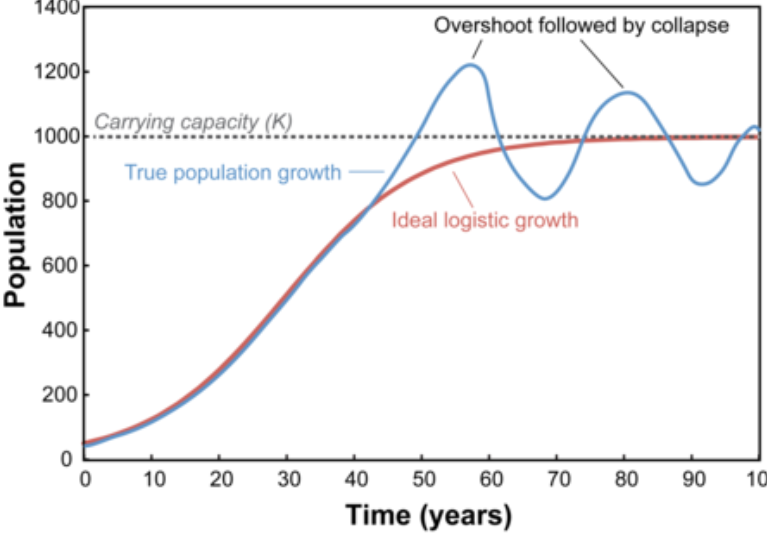
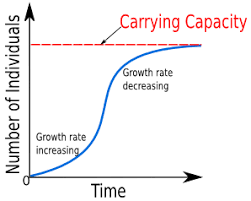
{{Logistic Growth{{
The per capita rate of increase approaches zero as the carrying capacity is reached
best fits type I graphs
growth is limited
k selection
factors in carrying capacity
fastest rate of growth at medium capacity
k = carrying capacity = the maximum an environment can carry
k is overhot most times as oscillates
the growth curve may also curve off and flatten out at k
It is density-dependent
Per capita rates of birth and death change in response to population size or density
Density-dependant factors include competition for resources, predation, disease, toxic wastes, territoriality, and intrinsic factors
there is a higher amount of these as pop density increases