Chapter 6: Supply and Demand
6.1 Demand
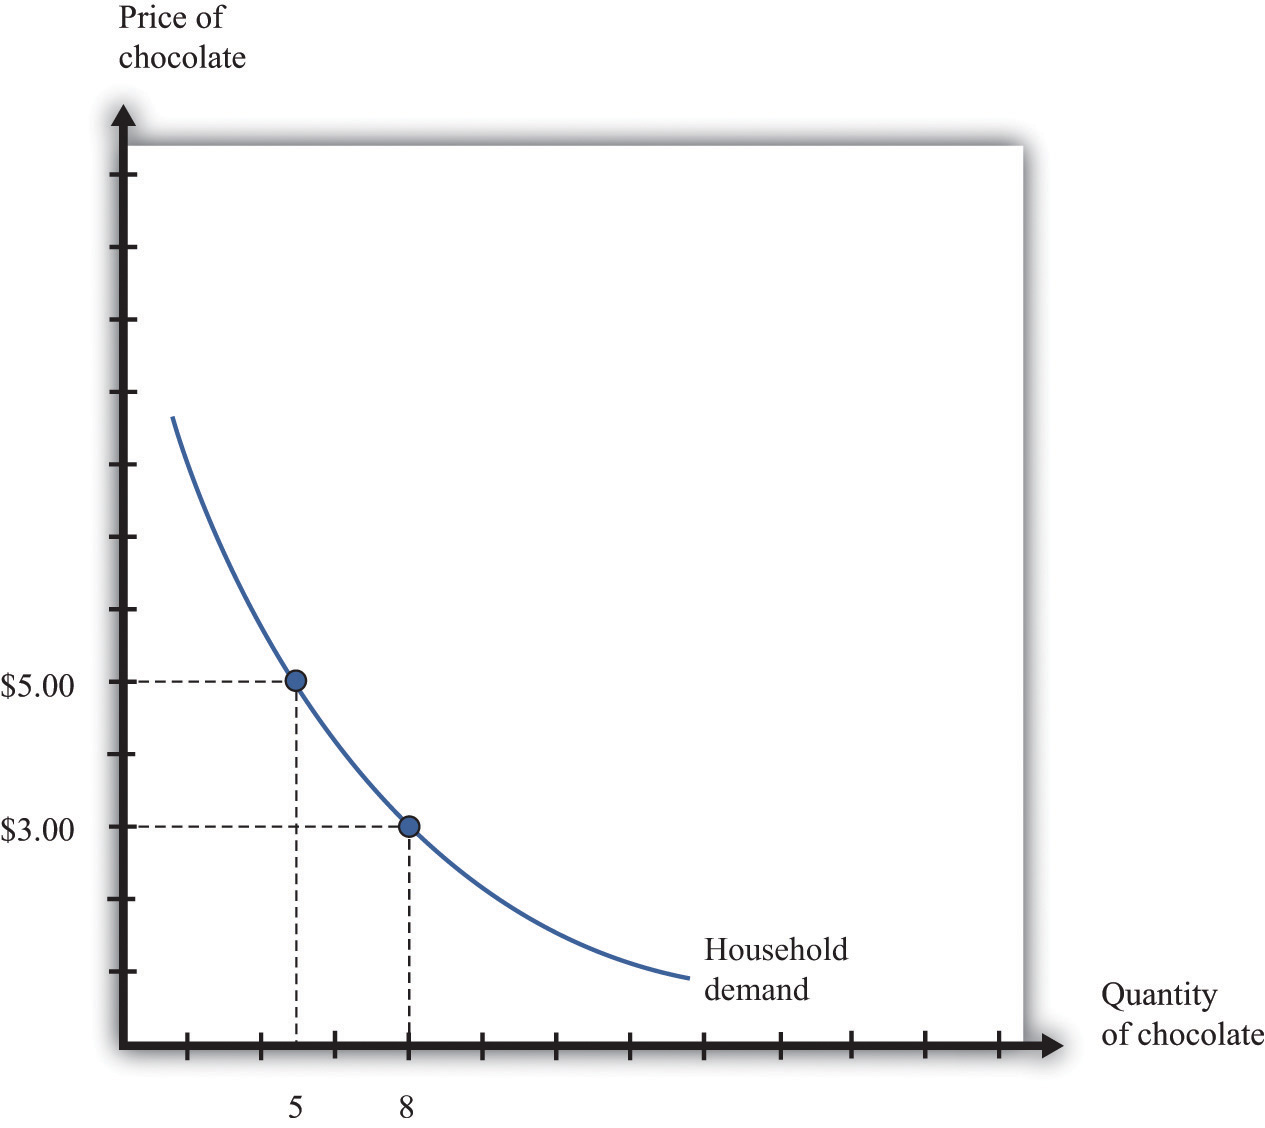
- Demand curve: shows relationship between price and quantity demanded of a good during a certain period of time
- Individual’s demand curve for a good reflects marginal utility received → marginal utility decreases as unit increases
- Law of diminishing marginal utility: satisfaction decreases as additional units of a good is consumed within a given period
- Law of demand: as the price of a good increases, the demand decreases
- And vice versa: as price decreases, the demand increases
6.2 Supply
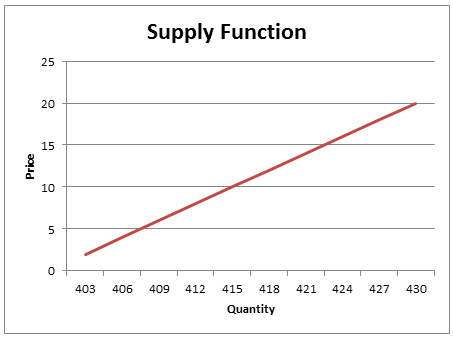
- Supply curve: shows relationship between price and quantity supplied by a perfectly competitive firm during a certain period of time
- Law of supply: as the price increases, the quantity of a good also increases
- Marginal cost increases
- Marginal cost: additional cost of producing another unit
- Market supply curve: shows total quantities of a good that suppliers are willing able able to provide at various prices during a period of time
- Horizontal summation of supply curves
- Change in quantity supplied: change in price → sellers adjust quantity
- Change in supply: change in overall supply
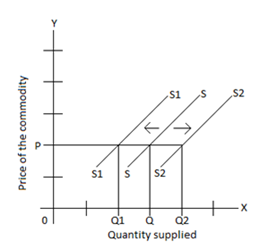
When is there an increase in supply?
- Decrease in input costs
- If wages, rents, etc. related to the good produced decrease
- Improvement in technology
- Expectations of lower prices in the future
- Increase in number of sellers
- More sellers = more supply curves added horizontally
- Decrease in price of a substitution during production
- Ex) Paper and lumber, milk and cheese
- If cost for cheese decreases, more milk will be sold instead
- Increase in price of joint product
- Ex) Leather and beef
- Production of one makes other available
- If price of leather increases → more cows will be slaughtered → supply of beef will increase
- Lower taxes
- Higher subsidies
- Lower regulations
- Acronym
ROTTEN
Resource costs
Other goods’ prices
Taxes and subsidies
Technology changes
Expectations of suppliers
Number of suppliers
Long-run average cost (LRAC): cost function that represents the average cost per unit for producing a good
Economies of scale
- Long-run average cost curve has a negative slope → cost per unit decreases
- Due to:
- Use of equipment: robots, assembly lines, etc. that increase efficiency when handling large output
- Cost of input that does not increase when output increases → spread out over large output
- Long term
- Ex) Copyright
Diseconomies of scale: exist over range of output when LRAC increases
Increasing returns (to scale): when output increases proportionately more than increases in all inputs
- Ex) Doubling all inputs results in more than double the amount of output
Decreasing returns (to scale): when output increases proportionately less than increases in all inputs
Constant returns (to scale): increase in output is equal to increase in input
Diminishing (marginal) returns: additional unit of input increases total input less than the previous unit of input → holds all other inputs constant
Increasing cost firm: faces decreasing returns to scale
Decreasing cost firm: faces increasing returns to scale