Chapter 4 (macro)
Price Controls and Market Intervention
Introduction to Price Controls
Governments may intervene in markets believing that the equilibrium price is inappropriate, resulting in either:
Price ceiling: Imposing a maximum allowable price for a good.
Price floor: Imposing a minimum allowable price for a good.
Effects of price controls:
Price ceilings cause shortages, leading to rationing or black markets.
Price floors lead to surpluses, diverting resources from productive activities.
Price Ceilings
Definitions and Examples
Definition: a maximum price at which a good can be bought and sold
Reasons for government implementation:
make goods more affordable
Example: rent controls prevent landlords from charging high rents, making housing more affordable
prevent exploitation
control inflation
Downside of Price Ceilings
If set below equilibrium price, it results in shortages:
Example: Rent control may discourage landlords from renting properties or reduces housing availability
A shortage can lead to rationing, black markets, or lower product quality
Price Floor
Definitions and Examples
Price Floor: Sets a minimum price (e.g., minimum wage).
Intent: To assist producers facing low market prices.
Reasons for government implementation:
protect producers’ income: ensures that producers get fair wages or prices for their goods
Example: minimum wage laws prevent workers from being underpaid
encourage production
Consequences of Price Floors
If above equilibrium price, causes surpluses:
Surplus management strategies:
Governments may buy excess agricultural products.
Payments to farmers not to produce.
Minimum wages can lead to unemployment, which is not addressed by reducing wages.
Elasticity of Demand
Understanding Price Elasticity
Price Elasticity of Demand: Percentage change in quantity demanded divided by percentage change in price.
Changes in Elasticity in terms of graphs
Graph analysis shows quantifiable responses in different demand curves.
High elasticity (significant changes in demand)
Low elasticity (minimal change in demand as price changes).
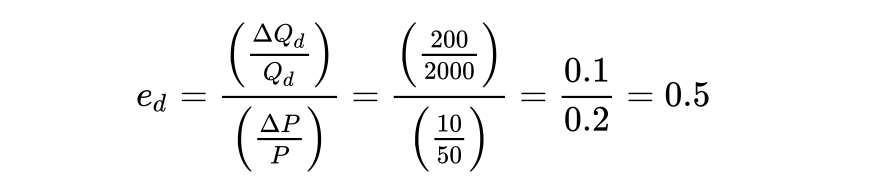
Suppose your university raises student season ticket prices from $50 to $60, which results in the quantity of season tickets sold falling from 2,000 to 1,800. The price elasticity of demand for season ticket prices would be
to find the numerator, calculate to the change in quantity demanded, which is 1,800 - 2,000 = -200. Then, for the denominator, calculate the change in price, which is $60 - $50 = $10.
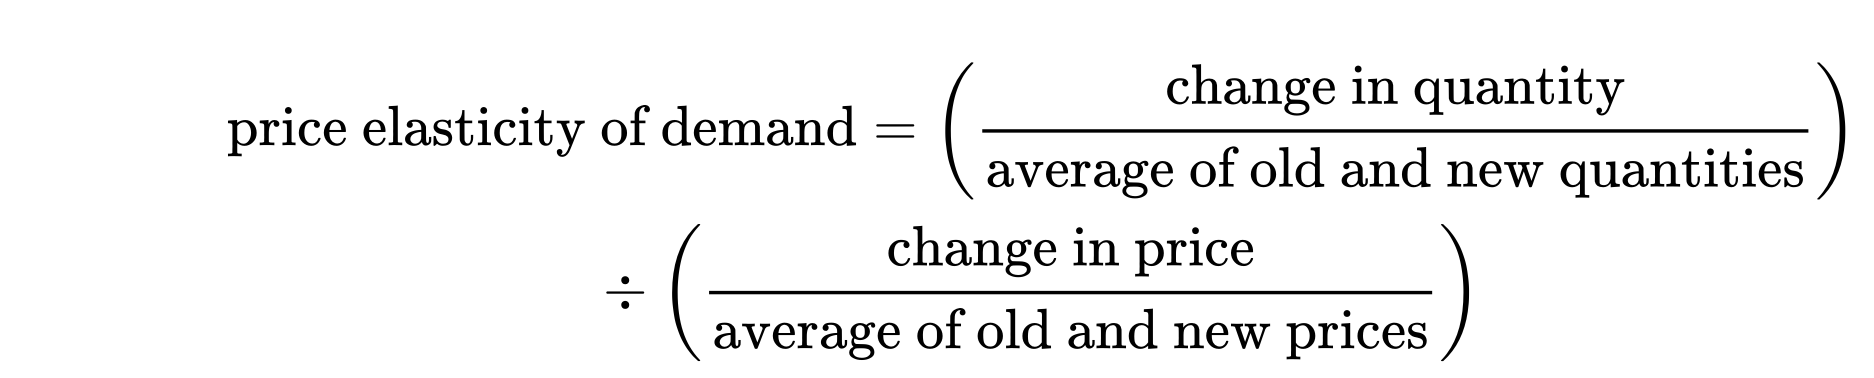
Calculating Elasticity with a midpoint Formula
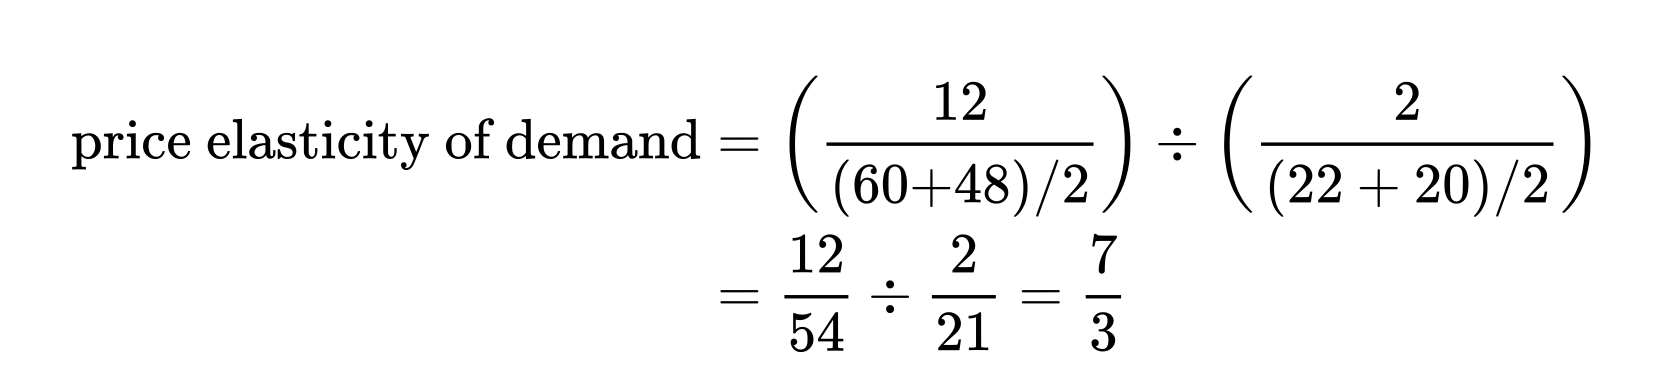
For example, if we use the midpoint formula to calculate the price elasticity of demand for oil when the price changes from $20 to $22 and the quantity demanded changes from 60 million to 48 million barrels a day, we get
Types of Elasticity:
Elastic demand: Price elasticity greater than 1
a small change in price causes large change in demand
happens when consumers have many substitutes or when the product is not a necesity
Example: luxury bags and plane tickets
Inelastic demand: Price elasticity less than 1
product is a necesity or has fewer substitutes
Example: gasoline or medicine, even if the price goes up people still need it
Perfectly Elastic: horizontal line (price reacts strongly).
consumers will buy an unlimited quantity at specific price
Perfectly Inelastic: vertical line (no response to price change).
people will buy the same amount no matter how high or low the price
Revenue and Elasticity
Relationship Between Price Elasticity and Revenue
Revenue formula: Revenue = Price (P) × Quantity (Q)
Elastic Demand: Increase in price reduces revenue (negatively related)
people stop buying as much because there are many other options or the product is not essential
Inelastic Demand: Increase in price increases revenue (positively related)
people keep buying no matter what because it is a necesity
Determinants of Price Elasticity
Factors Affecting Elasticity
Substitutability: More substitutes lead to higher elasticity. (easy to switch to a different good)
Good Type: Big-ticket items have higher elasticity compared to little-ticket items.
Price Change Perception:
Temporary changes imply higher elasticity.
Permanent changes imply lower elasticity.
Consumer Preferences: Different elasticity among demographic groups.
Time:** Long-run elasticity is often greater than short-run elasticity due to adjustments.
Long- run elasticity is greater since consumers and producers have more flexibilty to adjust
Short-run elasticity is lower becasue of immediate contraints
Cross-Price and Income Elasticity of Demand
Definitions of Elasticities
Income Elasticity: Change in quantity demanded due to change in income.
Cross-Price Elasticity: Change in quantity demanded for one good when the price of another related good changes.
Elasticity Classifications
Normal goods exhibit positive income elasticity.
Inferior goods show negative income elasticity.
Summary of Elasticity Effects on Revenue
Higher elasticity decreases revenue when prices rise; lower elasticity increases revenue.
Elasticity of Supply
Understanding the Elasticity of Supply
Price Elasticity of Supply: Percentage change in quantity supplied divided by percentage change in price.
Types:
Elastic Supply: Price elasticity greater than 1
Small change in price leads to large change in quantity supplied
producers can quickly adjust to production
Example: If the price of t-shirts increases, manufacturers can quickly produce more because materials and labor are available.
Inelastic Supply: Price elasticity less than 1
change in price only leads to a small change in quantity supplied
producers can’t quickly adjust production
Example: If the price of gold increases, miners cannot immediately extract more because mining takes time.
Perfectly Elastic: horizontal line (price reacts strongly).
unlimited supply at a specific price
Perfectly Inelastic: vertical line (no response to price change).
quantity supplied does not change at all