Unit 2 - Supply and Demand Guide
All the basics of Supply and Demand which are the foundation of the majority of concepts moving forward.
[[2.1 - Demand[[
Demand: the quantity which a consumer/buyer are willing and able to buy at different prices
- Movement on the graph: downward sloping
- Demand slopes down on the graph due to:
- Income effect
- Substitution effect
- law of diminishing marginal utility
Law of Demand: As price increases, demand decreases, and as price decreases, demand increases
Determinants of demand:
- Taste and preferences, related goods, income, buyers, expectation of failure
Substitutes : good/service that can be used in place of another, when price of one increases, consumers will buy more of the other (ex. coffee and tea)
- Substitution effect: as the price of a good increases, consumers substitute the good with another that is cheaper
Complements : goods/services that are consumed together (ex. hamburgers and buns)
Income effect: as income increases, people will buy more of normal goods, and less of inferior goods
Normal good : increase in demand when consumer’s income increases (ex. oreos)
Inferior good : increase in demand when consumer’s income decreases (ex. off brand oreos)
Diminishing marginal utility: As more units of a product are consumed, the satisfaction/utility it provides tends to decline
- Apple users would purchase at maximum, a limited phones-they wouldn’t purchase a new iPhone every month since that extra phone would offer them no utility or not as much
[[2.2 - Supply[[
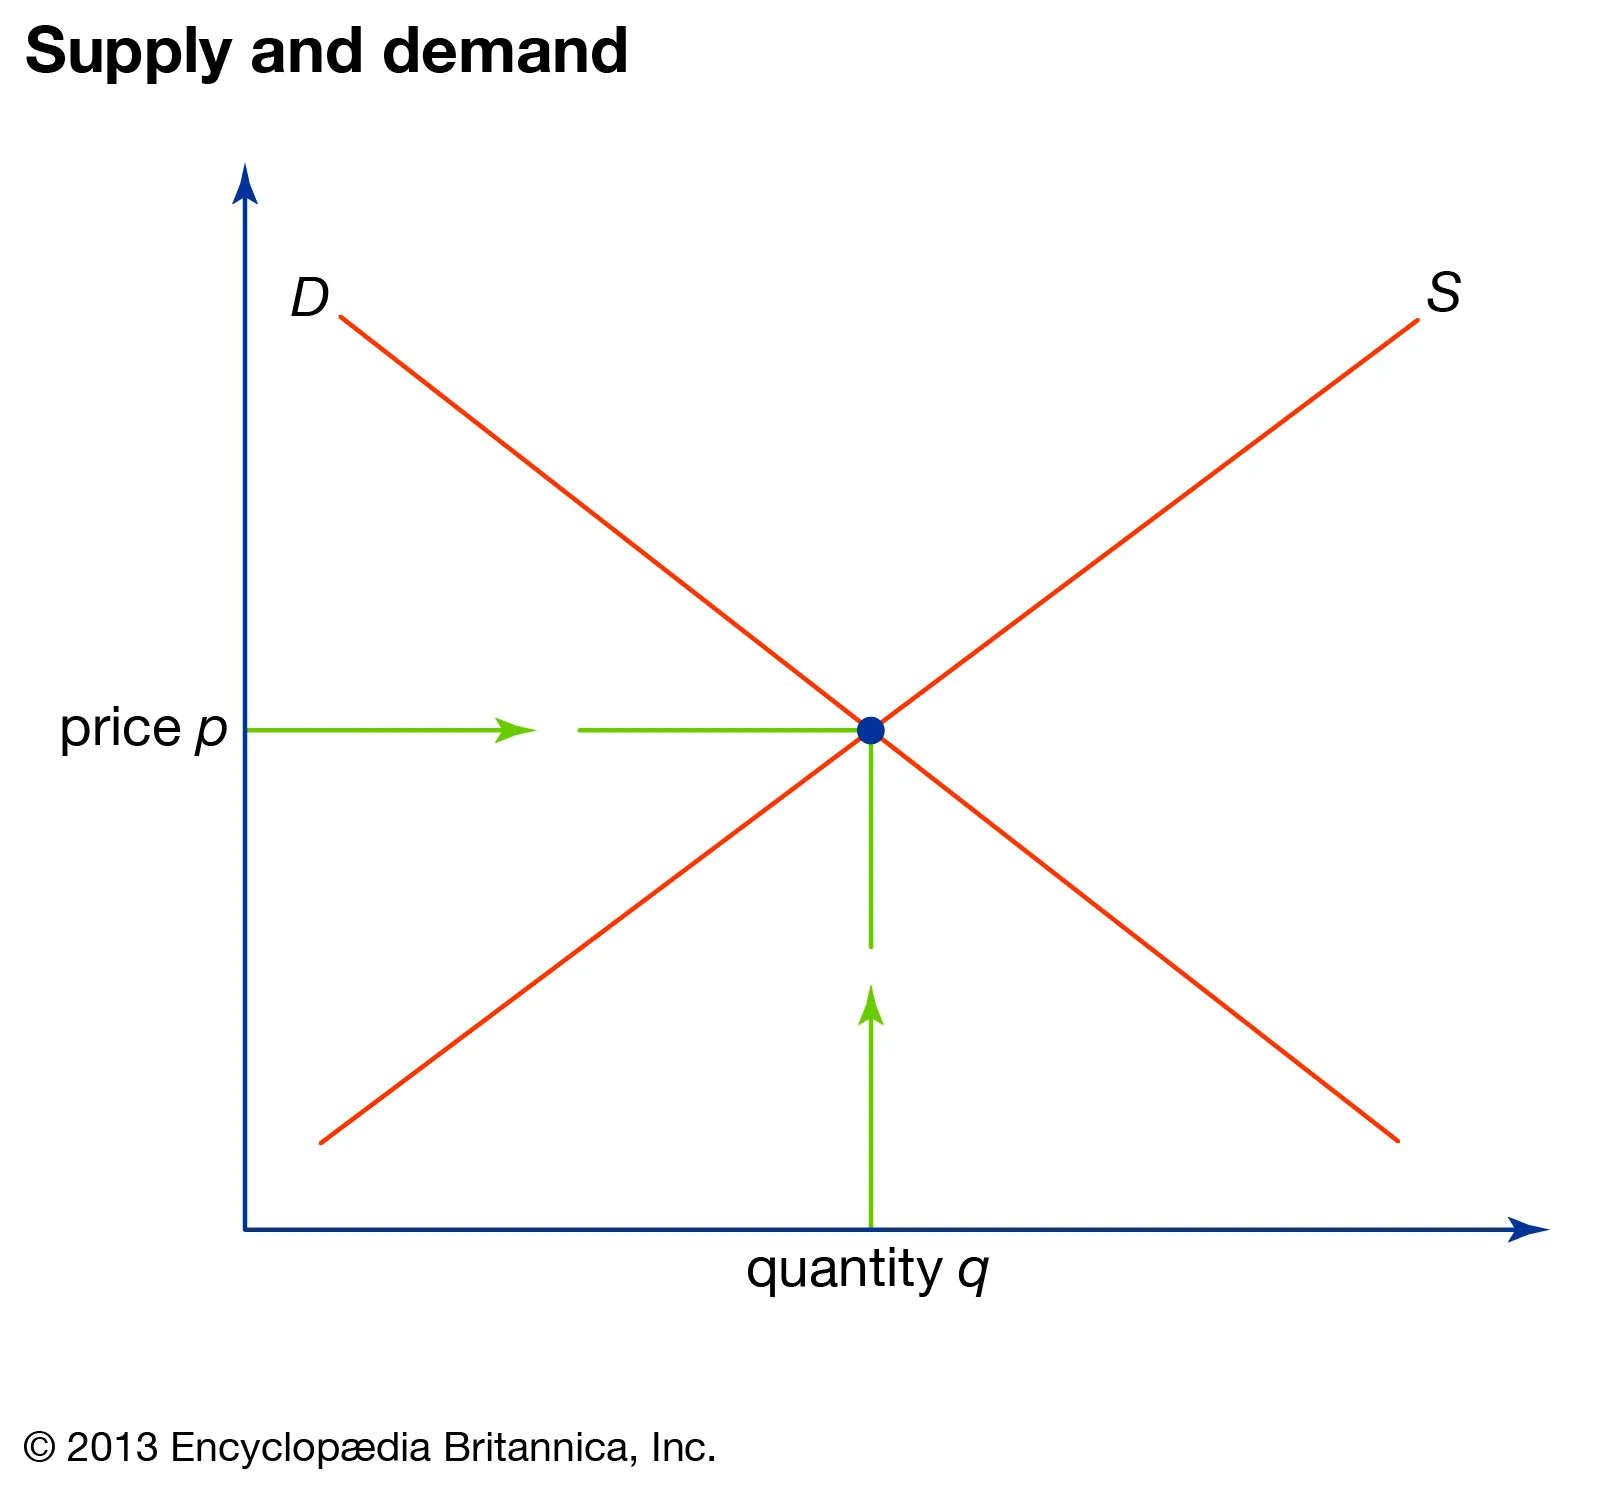
- Supply: different quantities of goods/services which sellers are willing and able to produce at a given price
- Law of supply: as price increases, quantity supplied also increases, this is a direct relation.
- The market supply shows the quantity a supplier is willing and able to offer at various prices at a given time
@@Reasons for the Law of Supply@@
Rising prices give greater opportunities to suppliers to earn a profit
With every additional unit, suppliers face an increase in the marginal cost of production
- Charging higher prices provides them with the easiest way to cover the cost
- The vice versa is also true; lower prices wouldn’t provide the incentive to motivate the supplier and thus reduces the quantity of product
- The supply curve shifts upward, and the movement along the supply curve indicates a change in price.
- Charging higher prices provides them with the easiest way to cover the cost
Shifters of supply :
- Resource costs and availability
- The cost of production (land, labor, capital) has an inverse impact on the supply
- When the cost of these increases, the supplier decides to produce less of the products since he is unable to afford the production cost
- Other goods and services
- Suppliers who produce more than one product (profit-maximizing firms) have an easier time switching to the production of another product if issues do arise in prices
- E.g. A farmer has land where he is able to produce corn and earn a profit
- If his land is capable to produce wheat as well, in case the price of wheat increases to that of corn, he would switch to wheat production to earn better
- The supply curve in this situation for wheat would shift outwards(more supply) and vice versa for corn(reduced supply)
- Technology
- Newer technology causes the cost of production to decline and helps improve the efficiency of the supplier
- This allows the supplier to produce more, shifting the supply curve outwards(toward right)
- E.g. machines on the production line help reduce unit costs due to which more products are affordable by the supplier
- Taxes and Subsidies
- Taxes are added up to the unit cost of production, thus making it more expensive
- Due to this, heavily taxed products are produced in less quantity by suppliers(supply curve shifts towards left)
- Subsidies are the opposite of taxes and help reduce price per unit
- This allows suppliers to produce more of the product(supply curve shifts towards the right)
- Expectation
- If suppliers expect prices to increase in the future, they would hold back supply for the current time with the future goal of earning more profit later (and vice versa)
- Number of sellers
- As the number of sellers increases in the market, the supply automatically increases
- This allows consumers more choices at a lower price due to an increase in competition
[[2.3 - Price Elasticity of Demand[[
Equation : %∆Qd/%∆P
- 0 = perfectly elastic,
Midpoint formula : Qd2-Qd1/(Q2d+Qd1)/2 , replace with Qd with price for price
Inelastic demand : TR correlates direct with price
Elastic demand = TR correlates inversely with price
@@Elasticity@@: how much the Q is affected by P.
- Elastic demand means that the goods are subject to be affected by a change in price.
- Inelastic demand means that goods are not subject to be affected by a change in price.
@@Characteristics of Elastic Demand@@:
- Flat, quantity is sensitive to price change, substitutes, luxury items, large portion of income, not needed immediately. Is equal to >1.
@@Characteristics of Inelastic Demand:@@
- Steep, few substitutes, required now, small portion of income, is equal to <1
@@Shapes of elasticity/inelasticity@@
- Perfectly elastic: infinity
- Relatively elastic: >1
- Unit elastic: 1
- Relatively inelastic: <1
- Perfectly inelastic: 0
[[2.4 - Price Elasticity of Supply[[
@@PES@@: measures how sensitive are sellers to price changes on goods
- Equation : %∆Qs/%∆P
- 0 = perfectly elastic,
- Inelastic : unable to respond to price change
- Elastic : short run
- Extremely elastic : long run
@@Characteristics of inelastic Supply:@@
- Difficult production, high costs, hard to change to alternative, high barriers to entry, <1
@@Characteristics of Elastic Supply:@@
- Easy production, low cost, easy to switch to, low barriers to entry, >1
[[2.5 - Other Elasticities[[
- @@Cross price elasticity of demand :@@ %∆Qd of Good A/%∆P of good B
- Negative = compliments (inferior good), positive = substitutes (normal good)
- Income elasticity of demand : %∆Qd/%∆income
1 = income elastic, <1 = income inelastic, negative = inferior, positive = normal
[[2.6 - Market Equilibrium, Consumer and Producer Surplus[[
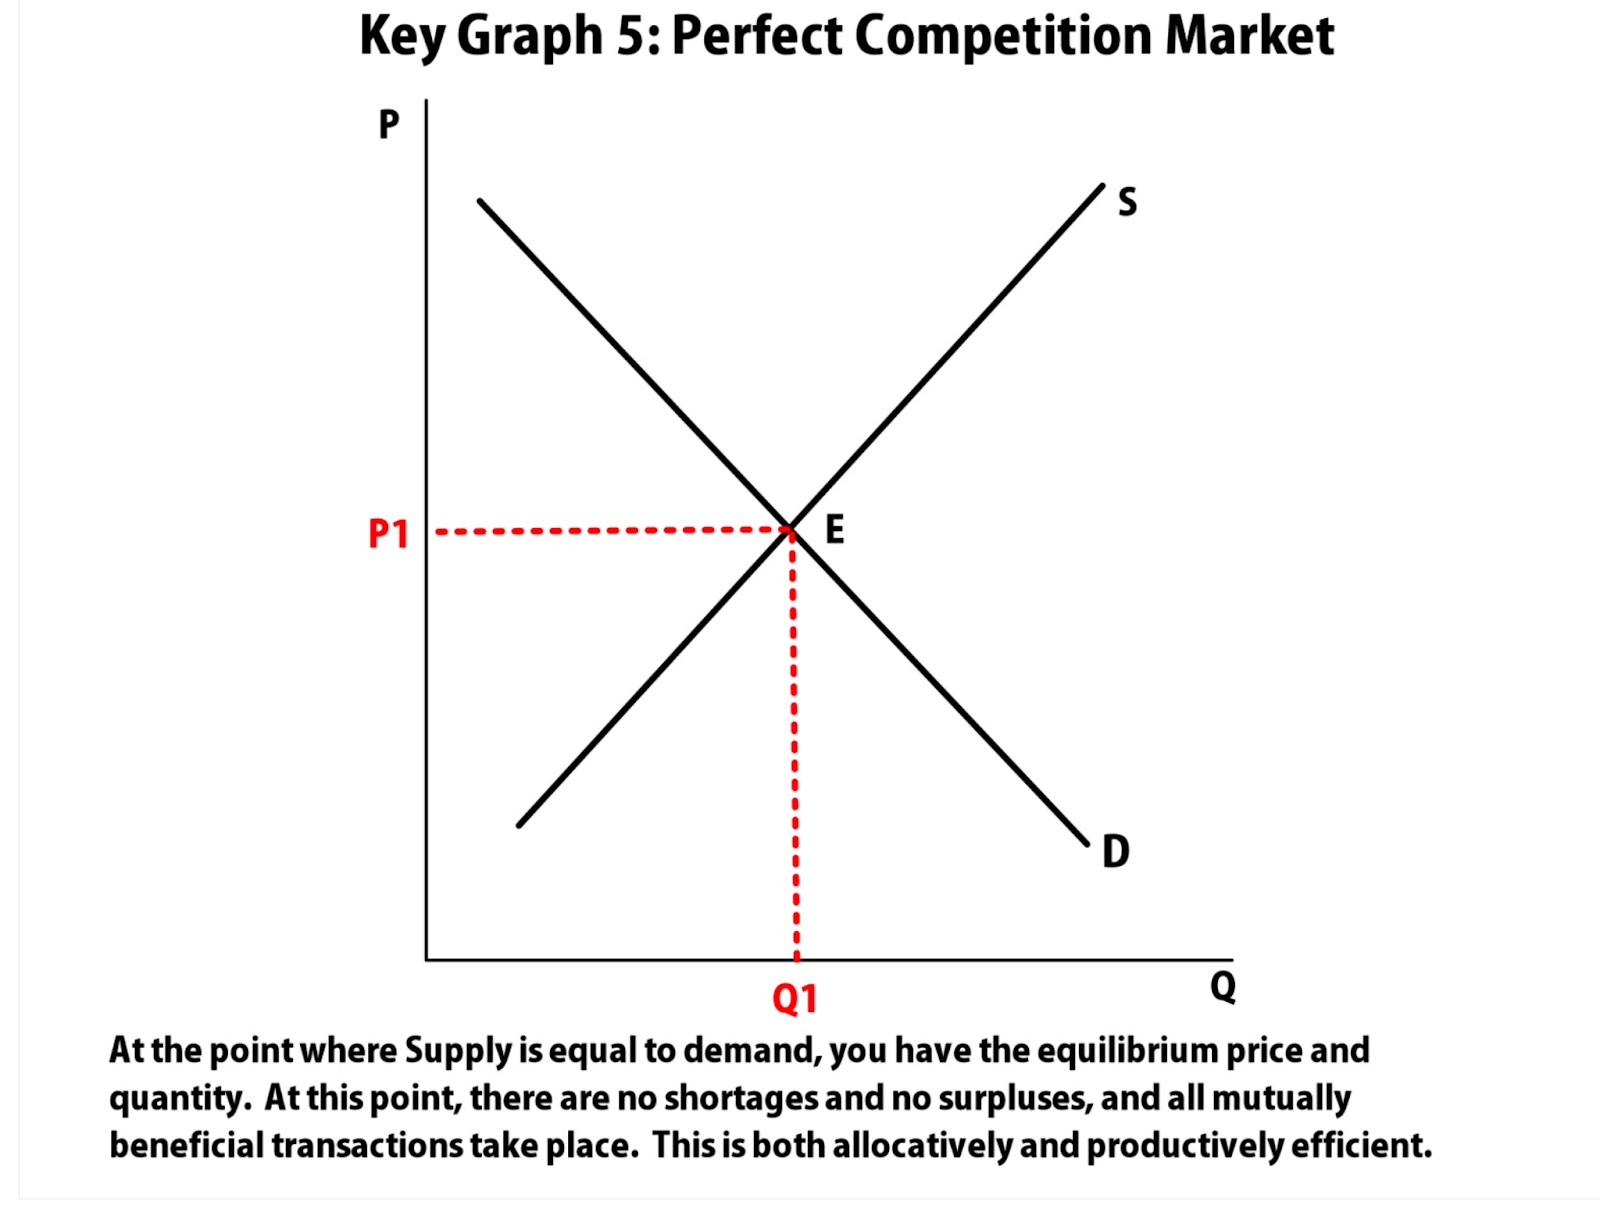
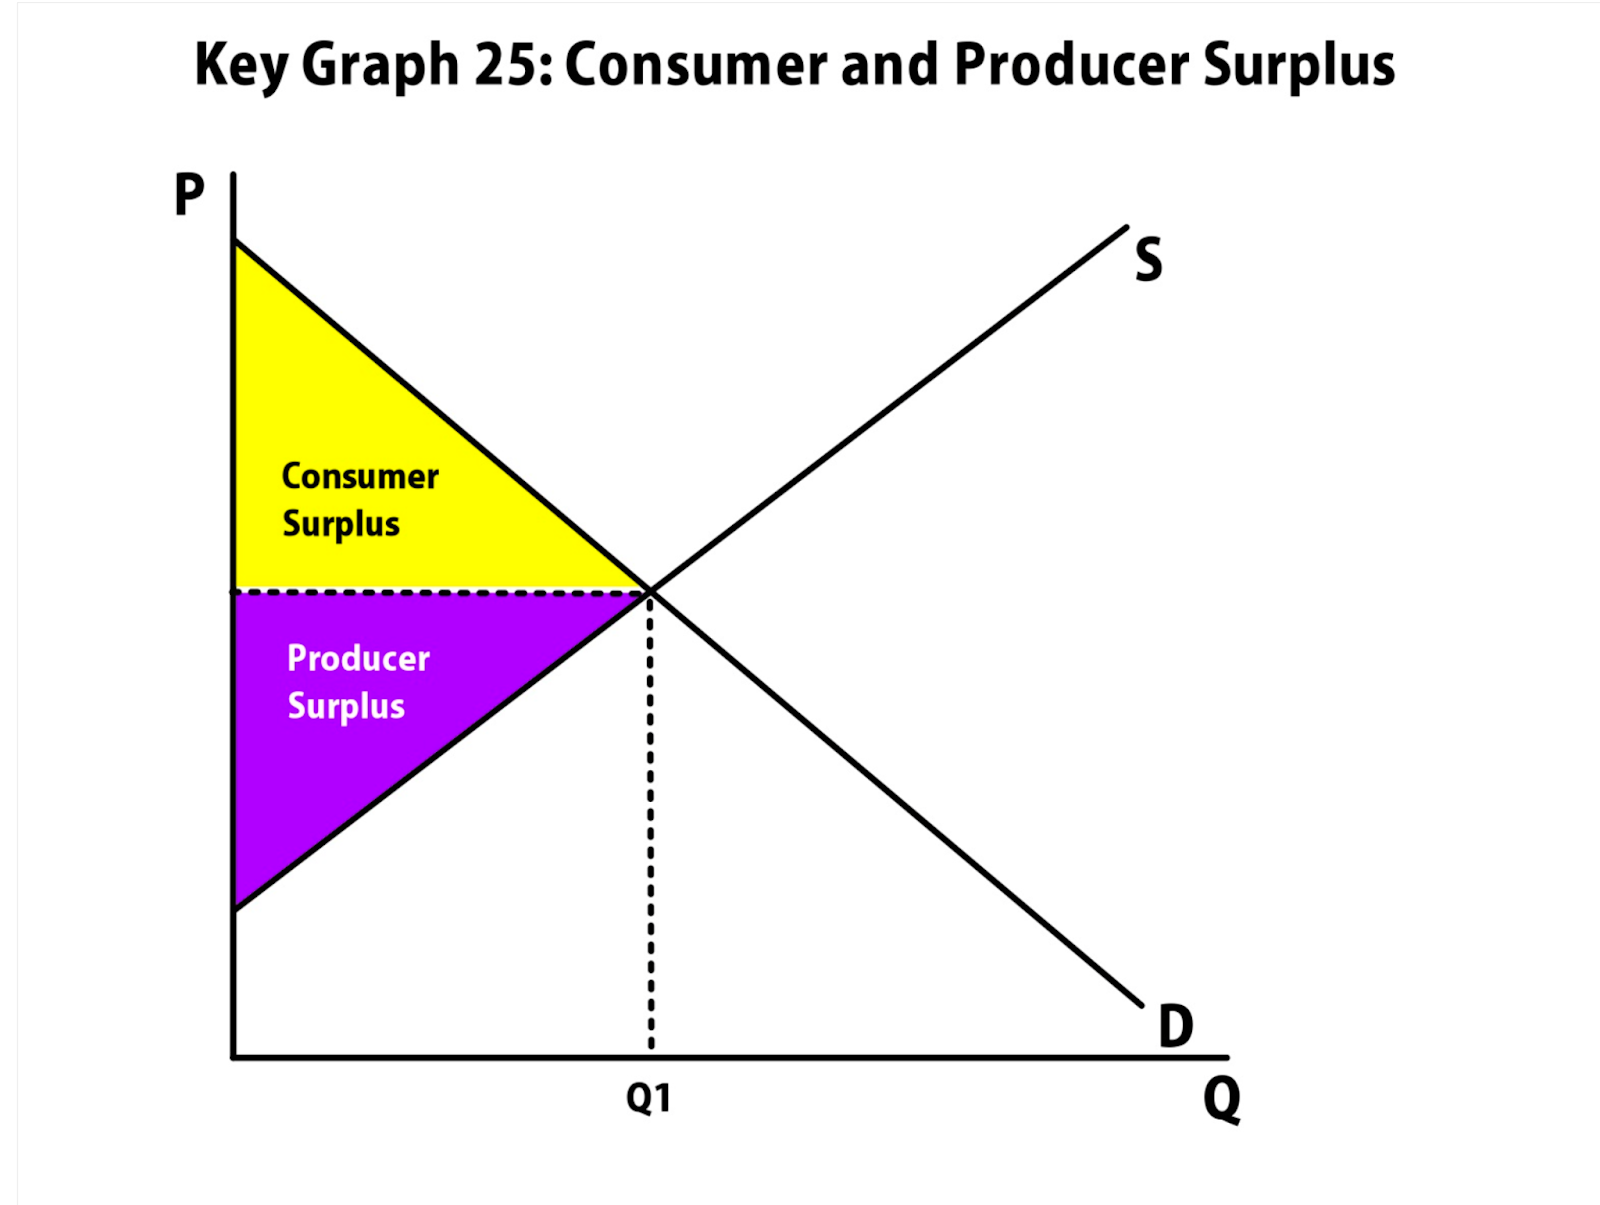
@@Equilibrium@@ : occurs when no one is better off doing something else
- Equilibrium = Qs=Qd
- Price below the equilibrium is shortage
Consumer surplus : price consumers are willing to pay - actual price
Producer surplus : actual price -price the producer is willing to sell for
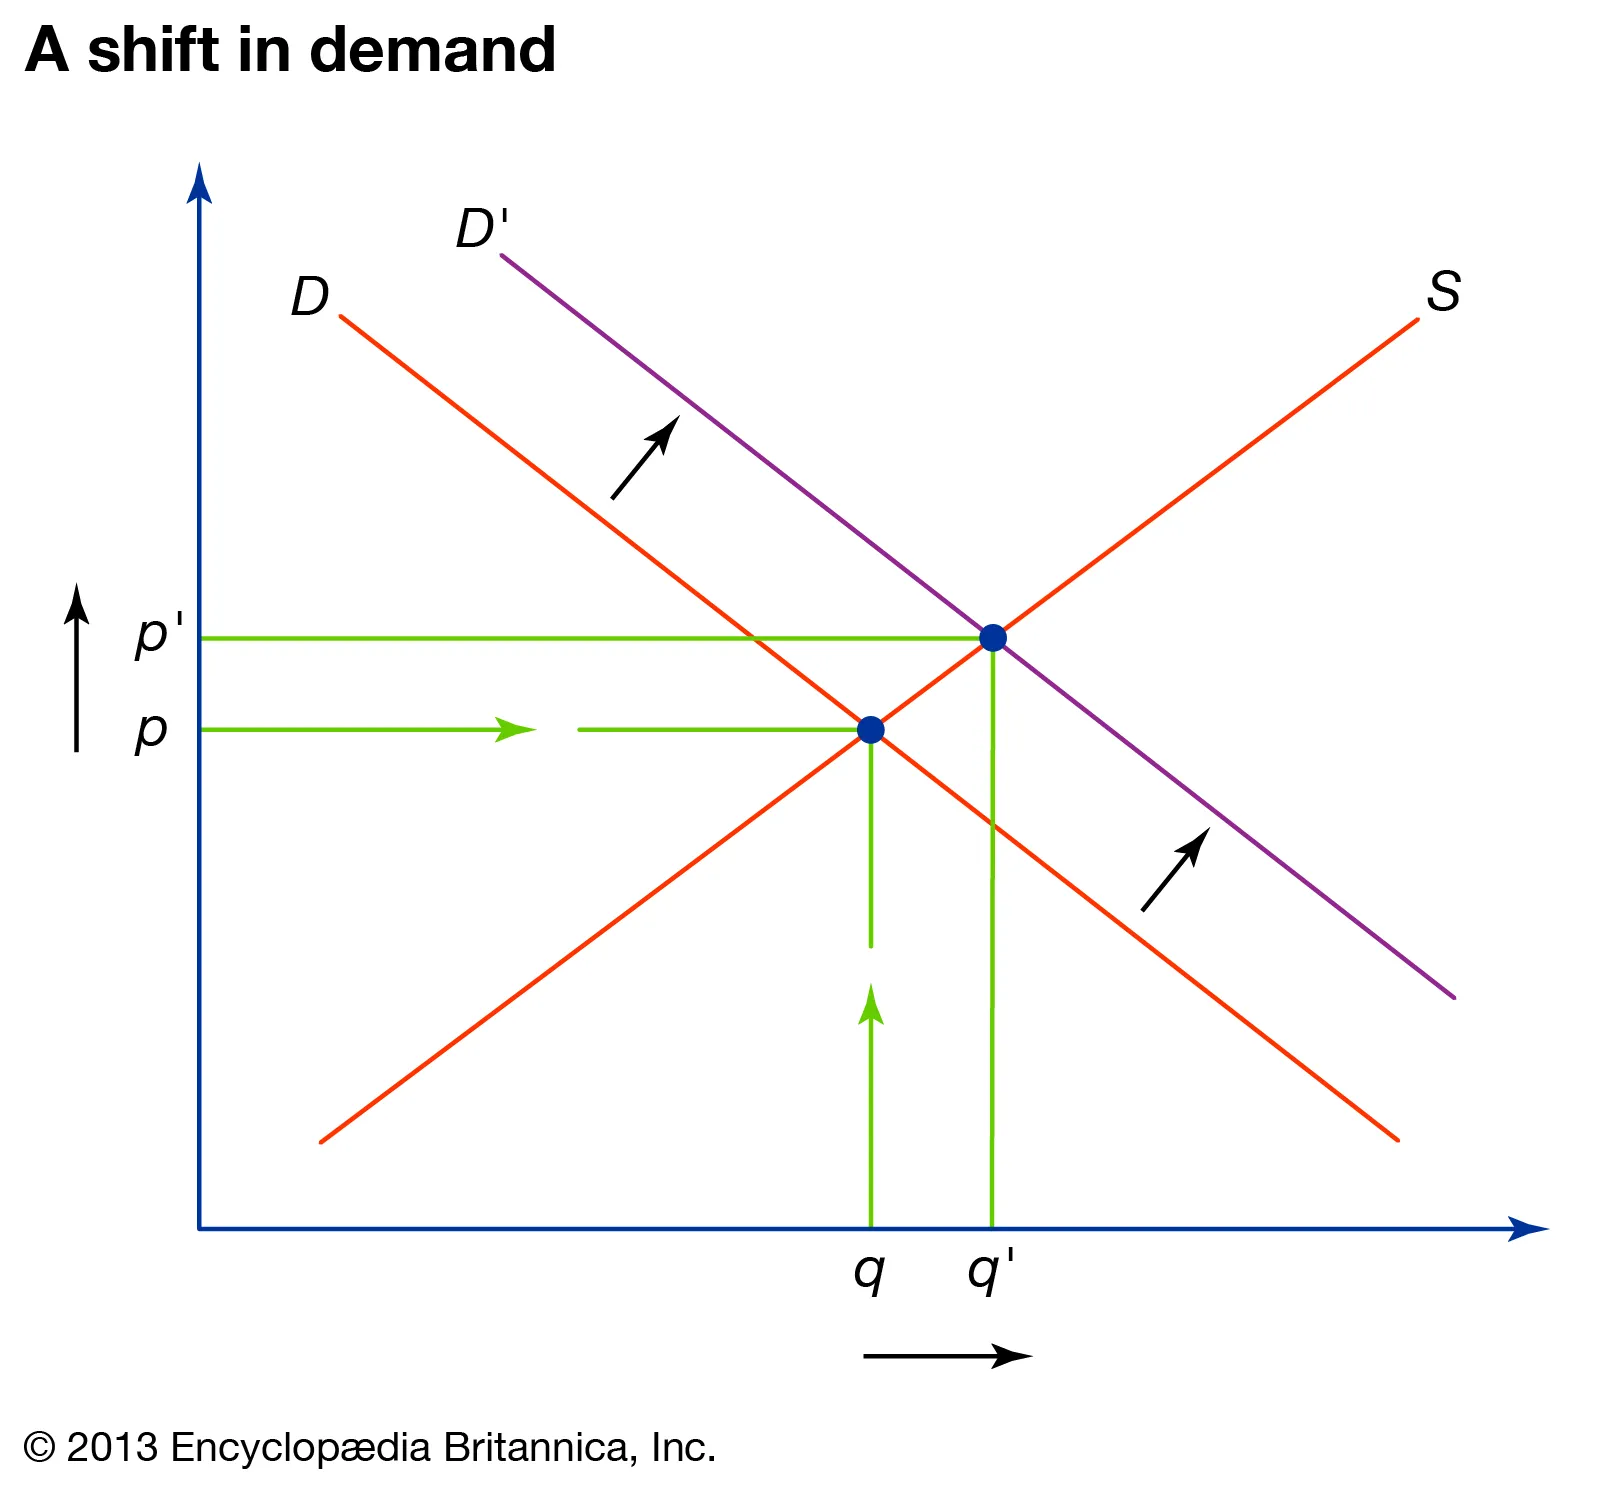
Demand increase : price and quantity increase
Demand decrease : price and quantity decrease
Supply increase : price decreases, quantity increases
Supply decrease : price increases, quantity decreases
@@Double shift@@ : either price or quantity will be unknown. This rule states that when there is a simultaneous shift in both demand and supply, either price or quantity would stay indeterminate
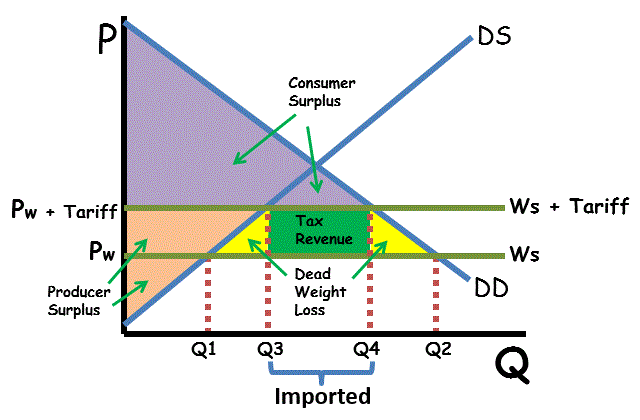
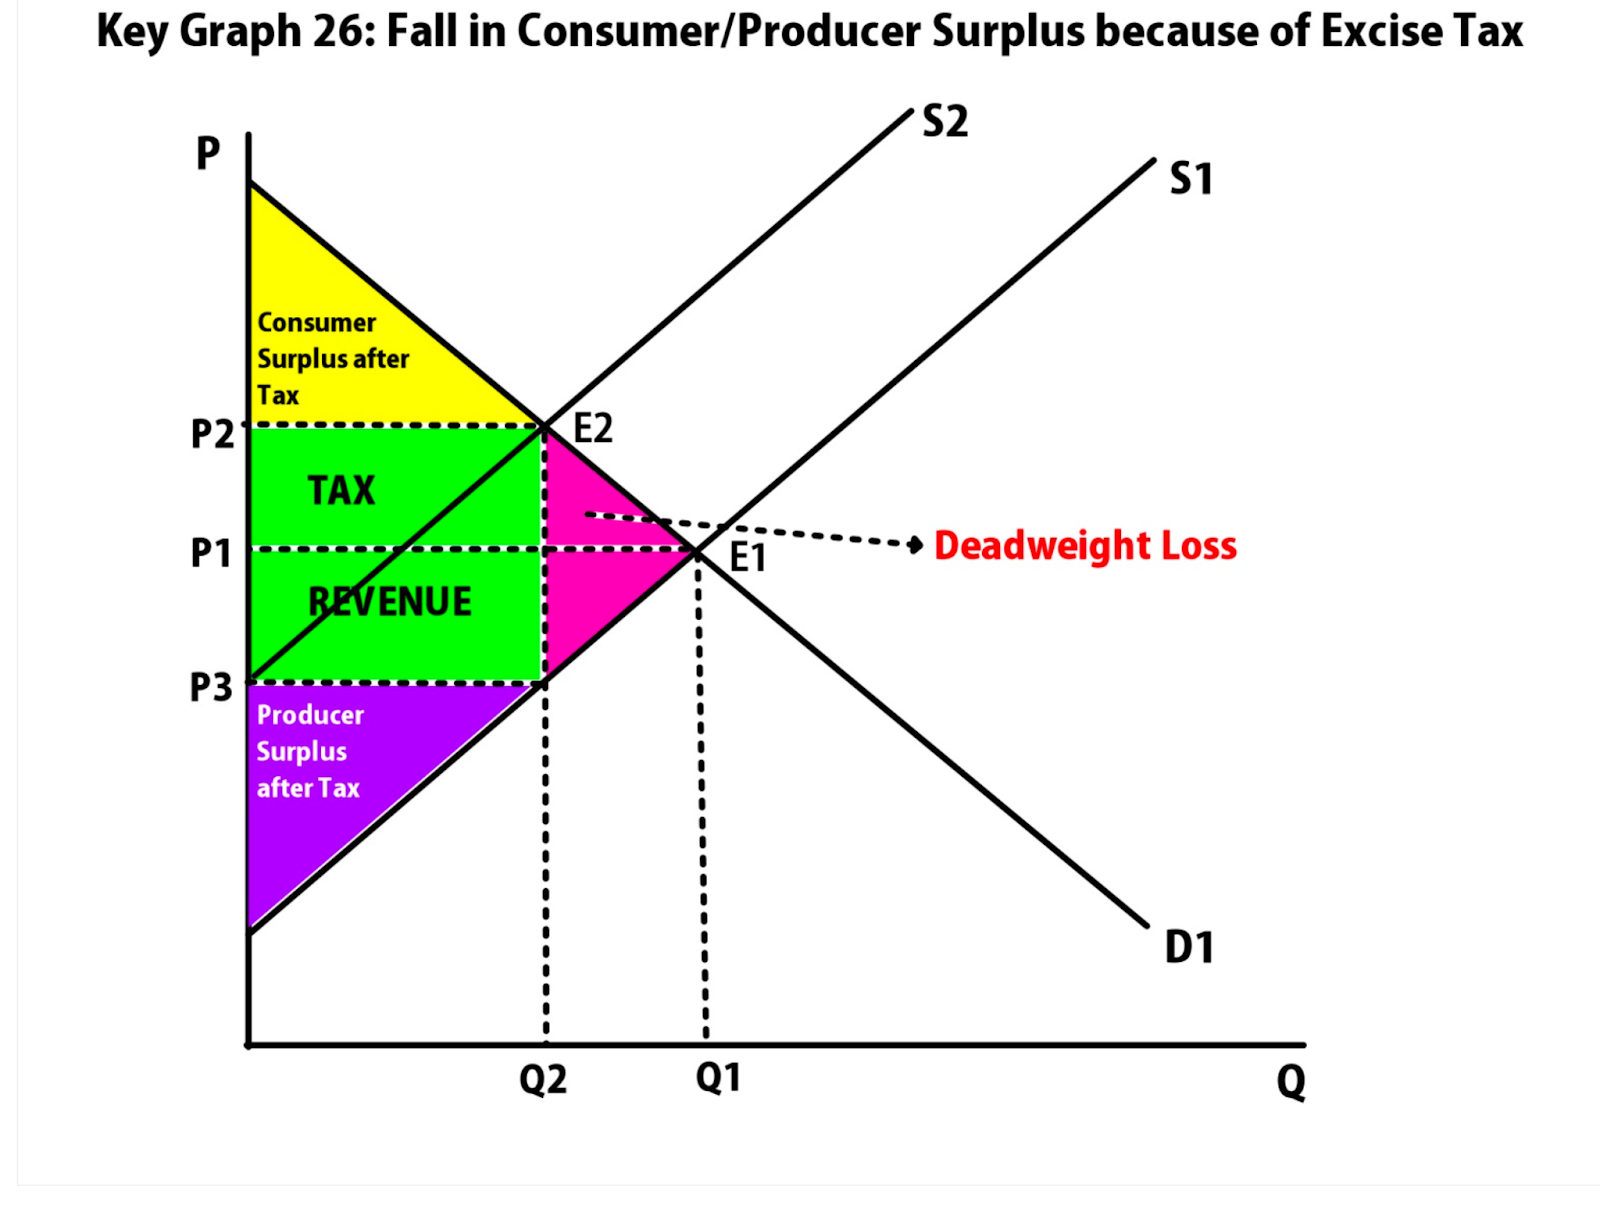
@@Deadweight loss (DWL)@@ : transactions that should occur, but don’t because of government intervention (calculate the area = triangle formula, ½(base x height)
[[2.7 - Market Disequilibrium and Changes in Equilibrium[[
[[2.8 - Government Intervention in Markets[[
@@Market Disequilibrium:@@
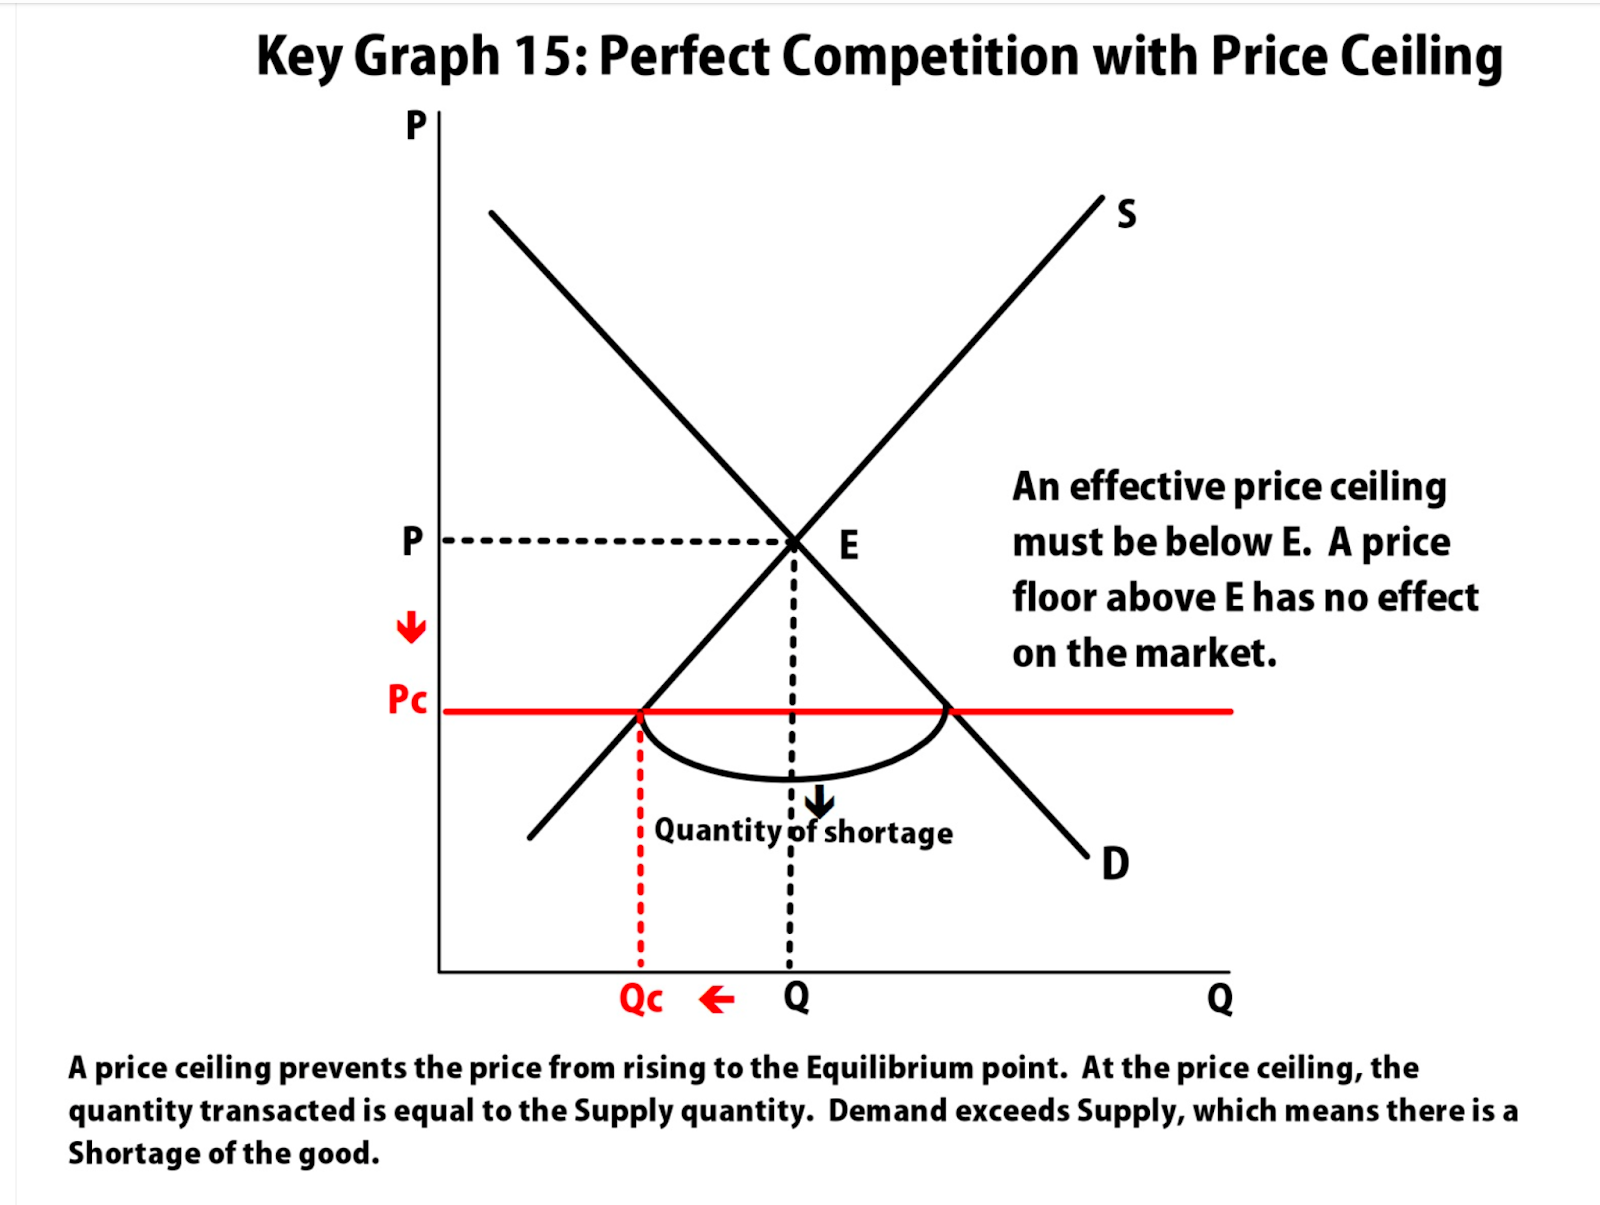
- Shortage : Qs < Qd, price is lower than equilibrium
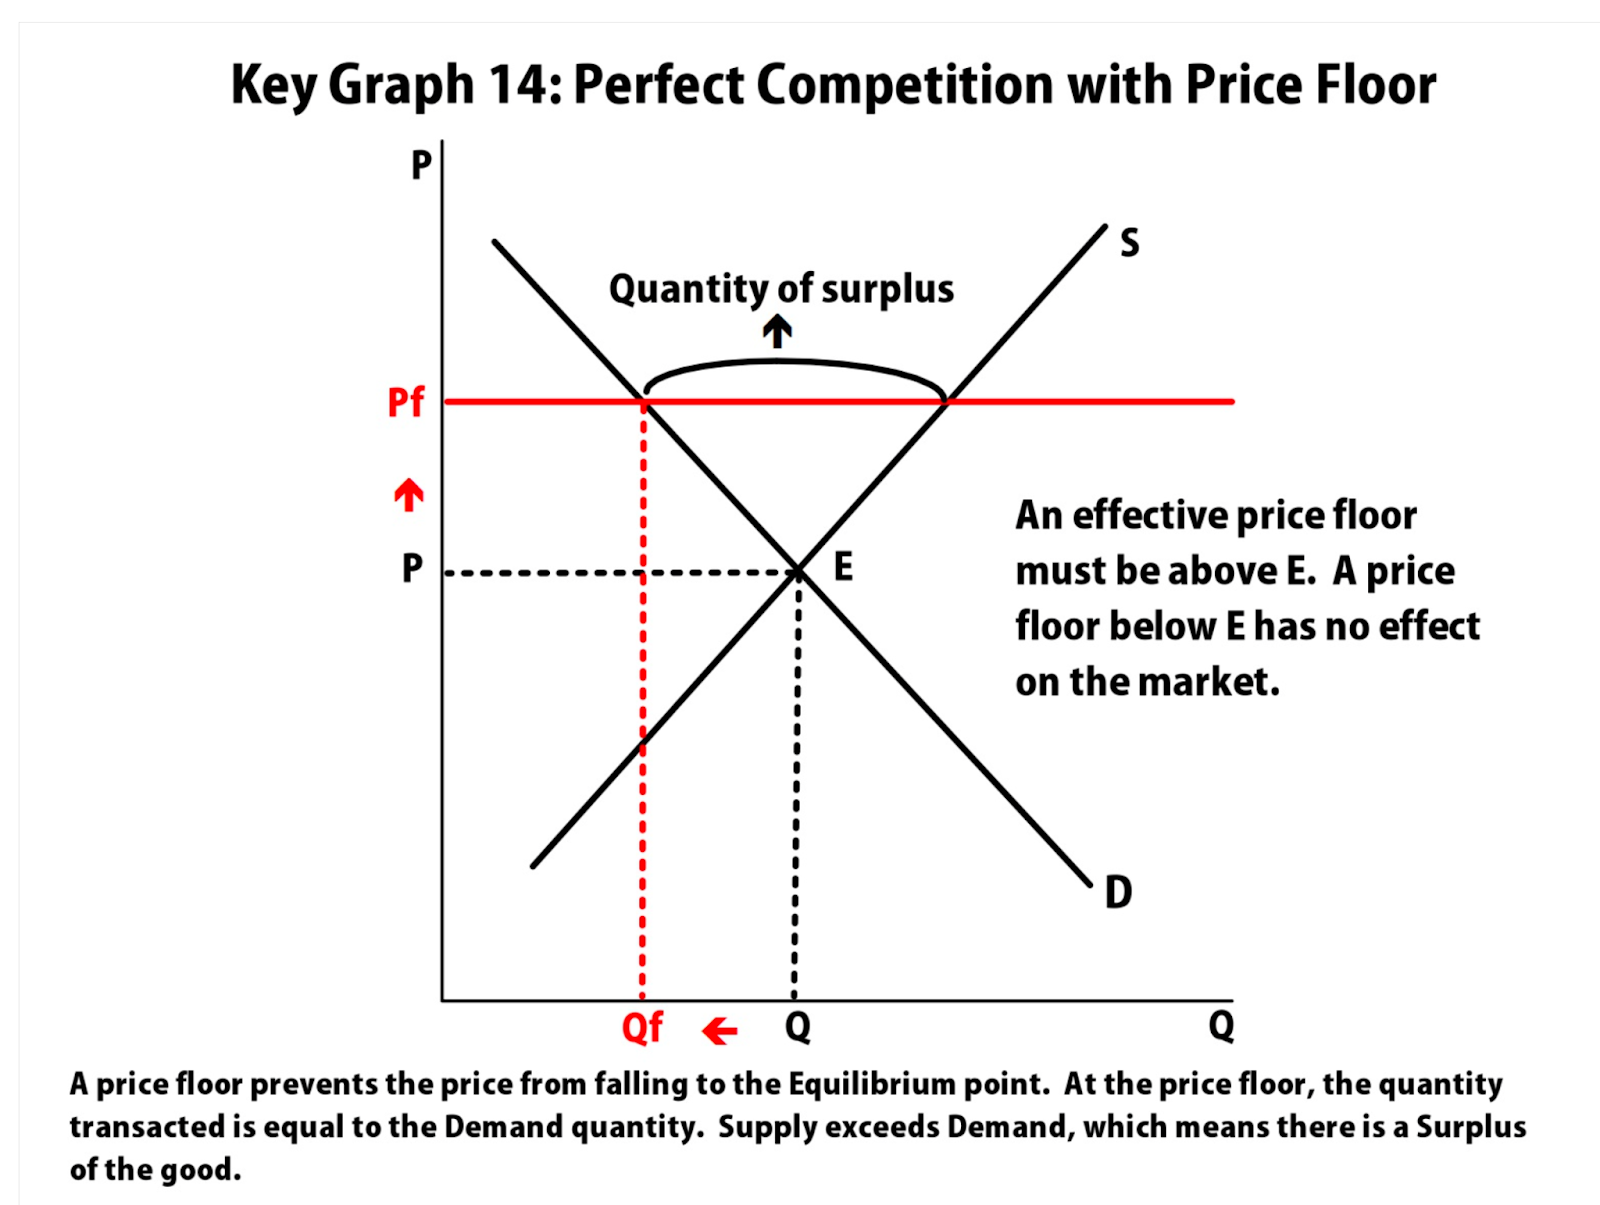
- Surplus : Qs > Qd, price is above equilibrium
Price floor : minimum price a supplier can charge, price is set above equilibrium (causes shortage)
Price ceiling : maximum price a supplier can charge, price is set below equilibrium (causes surplus)
Quota : upper limit of a quantity that can be bought or sold (known as quantity control)
License : gives an owner the right to supply a good/service
Demand price : the price at which consumers will demand that quantity
Supply price : the price at which producers will supply that quantity
[[2.9 - International Trade and Public Policy[[
Quota rent : difference between demand price and supply price
Tariffs : tax placed on a good that is imported or exported
Import quota : restriction on the quantity of a good that can be imported
