Biochem Sept. 17th
Protein Purification, Structure Determination, and Ligand Binding (Lecture Transcript)
Introduction to protein separation concepts
Separation by charge: proteins can be separated based on their charge or molecular interactions with a ligand in a chromatography column.
Affinity interactions: only proteins that can interact with the ligand on the column will bind; others flow through.
Practical use: after binding, the target proteins can be eluted for downstream studies.
SDS-PAGE: Analytical tool for analyzing protein samples
SDS stands for sodium dodecyl sulfate, an ionic detergent.
Purpose: denatures most proteins and coats them with a negative charge; used to analyze protein samples rather than purify them.
Setup: polyacrylamide gel in an electrophoresis rig; load small volumes (a few microliters) of sample.
Principle: under applied voltage, negatively charged proteins migrate toward the positive electrode; smaller proteins move faster than larger ones.
Application in purification workflow: run SDS-PAGE before purification to gauge sample purity, then re-run after chromatography to assess removal of contaminants.
Note: SDS-PAGE is an analytical method, not a preparative separation method.
Advanced analytical techniques (brief introductions)
Mass spectrometry: characterize proteins in complex mixtures; identify which proteins are present and estimate relative abundance; can reveal which proteins are more abundant.
Purpose: rapid identification and relative quantification in complex mixtures rather than just separating by size.
Protein structure determination: key techniques
X-ray crystallography
Goal: determine three-dimensional structure by measuring electron density from crystallized protein.
Requirements: purify protein to very high purity and crystallize it.
How it works: shine X-ray beams on protein crystals; diffraction patterns are collected and processed by computers to infer structure.
Pros/cons: high-resolution structures possible; not all proteins crystallize; crystallization can be a bottleneck.
Historical note: first protein structure solved about seven decades ago.
Nuclear Magnetic Resonance (NMR)
Goal: determine protein structure from solution-phase data.
Applicability: works best for small proteins; requires a very high purity sample.
Pros/cons: does not require crystallization and can provide dynamic information; generally lower resolution than X-ray.
Use case: often used to study protein dynamics in solution; can be used when crystallography is not feasible.
Comparative summary
Both X-ray crystallography and NMR require high-purity protein samples.
X-ray is capable of high-resolution structures and is suitable for large proteins; NMR is better for small proteins and provides insights into dynamics in solution.
X-ray requires crystallization; NMR does not.
In the Protein Data Bank (PDB), X-ray structures often have higher reported resolution than NMR structures.
Course context: later topics (e.g., topics beyond four) will delve deeper into X-ray crystallography and NMR.
Transition to protein function: ligands and binding
Definitions
Ligand: a molecule that binds to a protein; can be a small molecule, a peptide, or another protein.
Protein-ligand complex: when a protein and ligand form a bound state in solution.
Binding equilibrium concept
Binding forms an equilibrium: P + L ⇌ PL
Dissociation constant: K_d = rac{[P][L]}{[PL]}
Fractional saturation (binding): f = rac{[PL]}{[P]{tot}} where [P]{tot} = [P] + [PL]
Using the two equations, the fractional saturation as a function of ligand concentration becomes:
f = rac{[L]}{K_d + [L]}When using ligands like oxygen (gas), ligand concentration can be expressed as partial pressure: f = rac{PO2}{Kd + PO_2}
50% saturation occurs when the bound and free forms are equal; thus PO2 = Kd at that point (often referred to as p50).
Interpretation of Kd and fractional saturation
Smaller K_d means tighter binding (higher affinity).
Large K_d means weaker binding.
The fractional saturation curve provides a visual and quantitative sense of how much of the protein is in the bound form at a given ligand concentration.
Units and typical ranges for K_d in biology
Common units: molar (M) and submultiples like μM, nM, pM, fM.
Typical guidance ranges:
Millimolar: K_d \sim 10^{-3} \, M
Micromolar: K_d \sim 10^{-6} \, M
Nanomolar: K_d \sim 10^{-9} \, M
Picomolar: K_d \sim 10^{-12} \, M
Femtomolar: K_d \sim 10^{-15} \, M
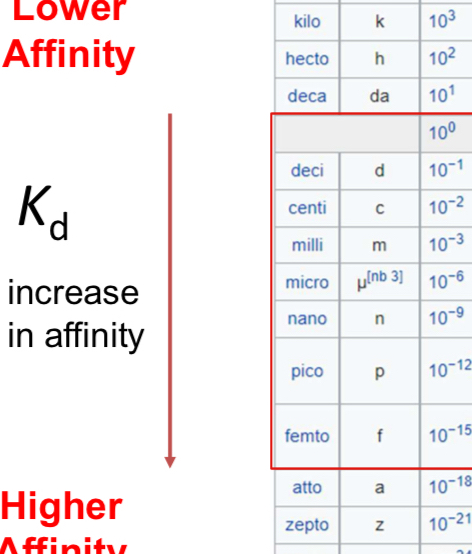
In many protein-protein interactions, affinities typically lie in the micromolar to nanomolar range; millimolar indicates weak binding; picomolar to femtomolar indicates very tight binding.
Practical exam-style notes on units
When comparing two bindings, smaller Kd indicates stronger binding (e.g., a binding with Kd = 1 \,\text{nM} is tighter than one with K_d = 1 \,\text{µM}).
In test questions, you may be asked to compare two interactions described in common units (e.g., 1 nM vs 1 µM) rather than giving full numeric values.
Quick concept check: what happens when ligand concentration equals K_d?
The fractional saturation f = rac{[L]}{Kd + [L]} yields f = 0.5 when [L] = Kd, aligning with the notion that half the protein is bound at that point.
Quick derivation reminder
Starting from Kd = \frac{[P][L]}{[PL]} and [P]{tot} = [P] + [PL], solving for f = \frac{[PL]}{[P]{tot}} leads to f = \frac{[L]}{Kd + [L]}.
Protein function and example proteins
Myoglobin and Hemoglobin: oxygen-binding proteins
Collagen: a highly abundant structural protein in tissues
Functions of proteins extend beyond catalysis to structural roles, transport, signaling, and regulation
Post-translational modifications (PTMs) add regulatory layers
PTMs can turn protein activity on/off, alter stability, solubility, or localization
Common PTMs discussed: phosphorylation, lipidation, glycosylation, etc.
Hemoproteins and heme attachment
Some proteins (e.g., myoglobin) incorporate a heme prosthetic group to enable function (e.g., oxygen binding).
Heme insertion is critical for function; the protein fold positions the heme in a specific pocket.
Myoglobin: structure, heme binding, and oxygen transport
Function: stores and/or delivers oxygen in muscle cells; helps supply oxygen for metabolism
Structure
Myoglobin is composed of eight alpha helices (labeled A–H).
The heme prosthetic group is embedded in a pocket formed by these helices.
Heme group and iron coordination
The iron atom in the heme sits at the center coordinated by four nitrogens of the porphyrin ring.
A fifth coordination bond comes from the histidine residue at the F8 position (the eighth residue of helix F) to stabilize Fe in the center.
A sixth coordination bond is formed when oxygen binds, with stabilization from another histidine (E7) nitrogens, helping to hold the O2 in place.
The exact insertion and orientation of the heme are critical; mutations in the coordinating histidines or misplacement of the heme can disrupt oxygen binding.
Oxygen binding as a ligand-binding equilibrium
The binding reaction: Myoglobin + O2 ⇌ Mb-O2
Dissociation constant for oxygen binding: Kd = \frac{[Mb][O2]}{[Mb\text{-}O_2]}
Fractional saturation and oxygen partial pressure
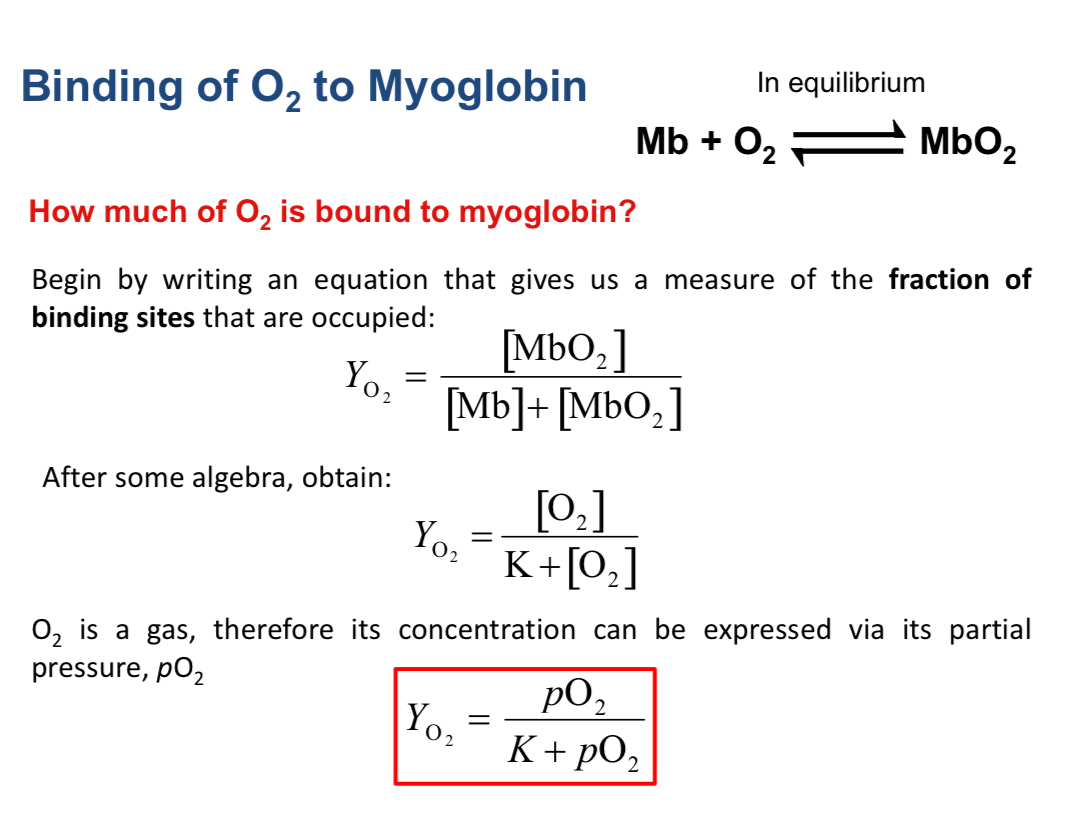
Fraction bound: f = \frac{[Mb\text{-}O2]}{[Mb]{tot}}
If expressed as a function of oxygen partial pressure (for gases): f = \frac{PO2}{Kd + PO_2}
p50 concept: at PO2 = Kd, 50% of myoglobin is bound to oxygen (the p50 value)
Practical interpretation of the binding curve
As PO2 increases, more Mb binds oxygen until approaching a plateau; the steepness of the curve reflects binding affinity (smaller Kd -> steeper rise).
The protein environment, not just the heme, determines binding affinity; the heme's environment within myoglobin ensures stability against oxidation (Fe(II) remains functional for O2 binding).
Graph interpretation and kinetic intuition
A graph of fraction bound vs PO2 typically shows that higher PO2 yields more Mb-O2 complex until saturation limit is approached.
Hemoglobin vs Myoglobin: a note
Hemoglobin is related to myoglobin but forms a tetramer and is the primary oxygen transporter in blood.
Myoglobin is more about storage/retention in muscle tissue; both rely on heme for oxygen binding, and both illustrate the importance of protein structure in function.
Collagen and structural roles
Collagen provides structural support to tissues and is used as an example of a protein with a structural function rather than catalytic activity.
Discussed later in the course in the context of structure-function relationships.
Post-translational modifications (PTMs): key ideas
Proteins can be modified after synthesis to regulate activity, stability, location, or interactions.
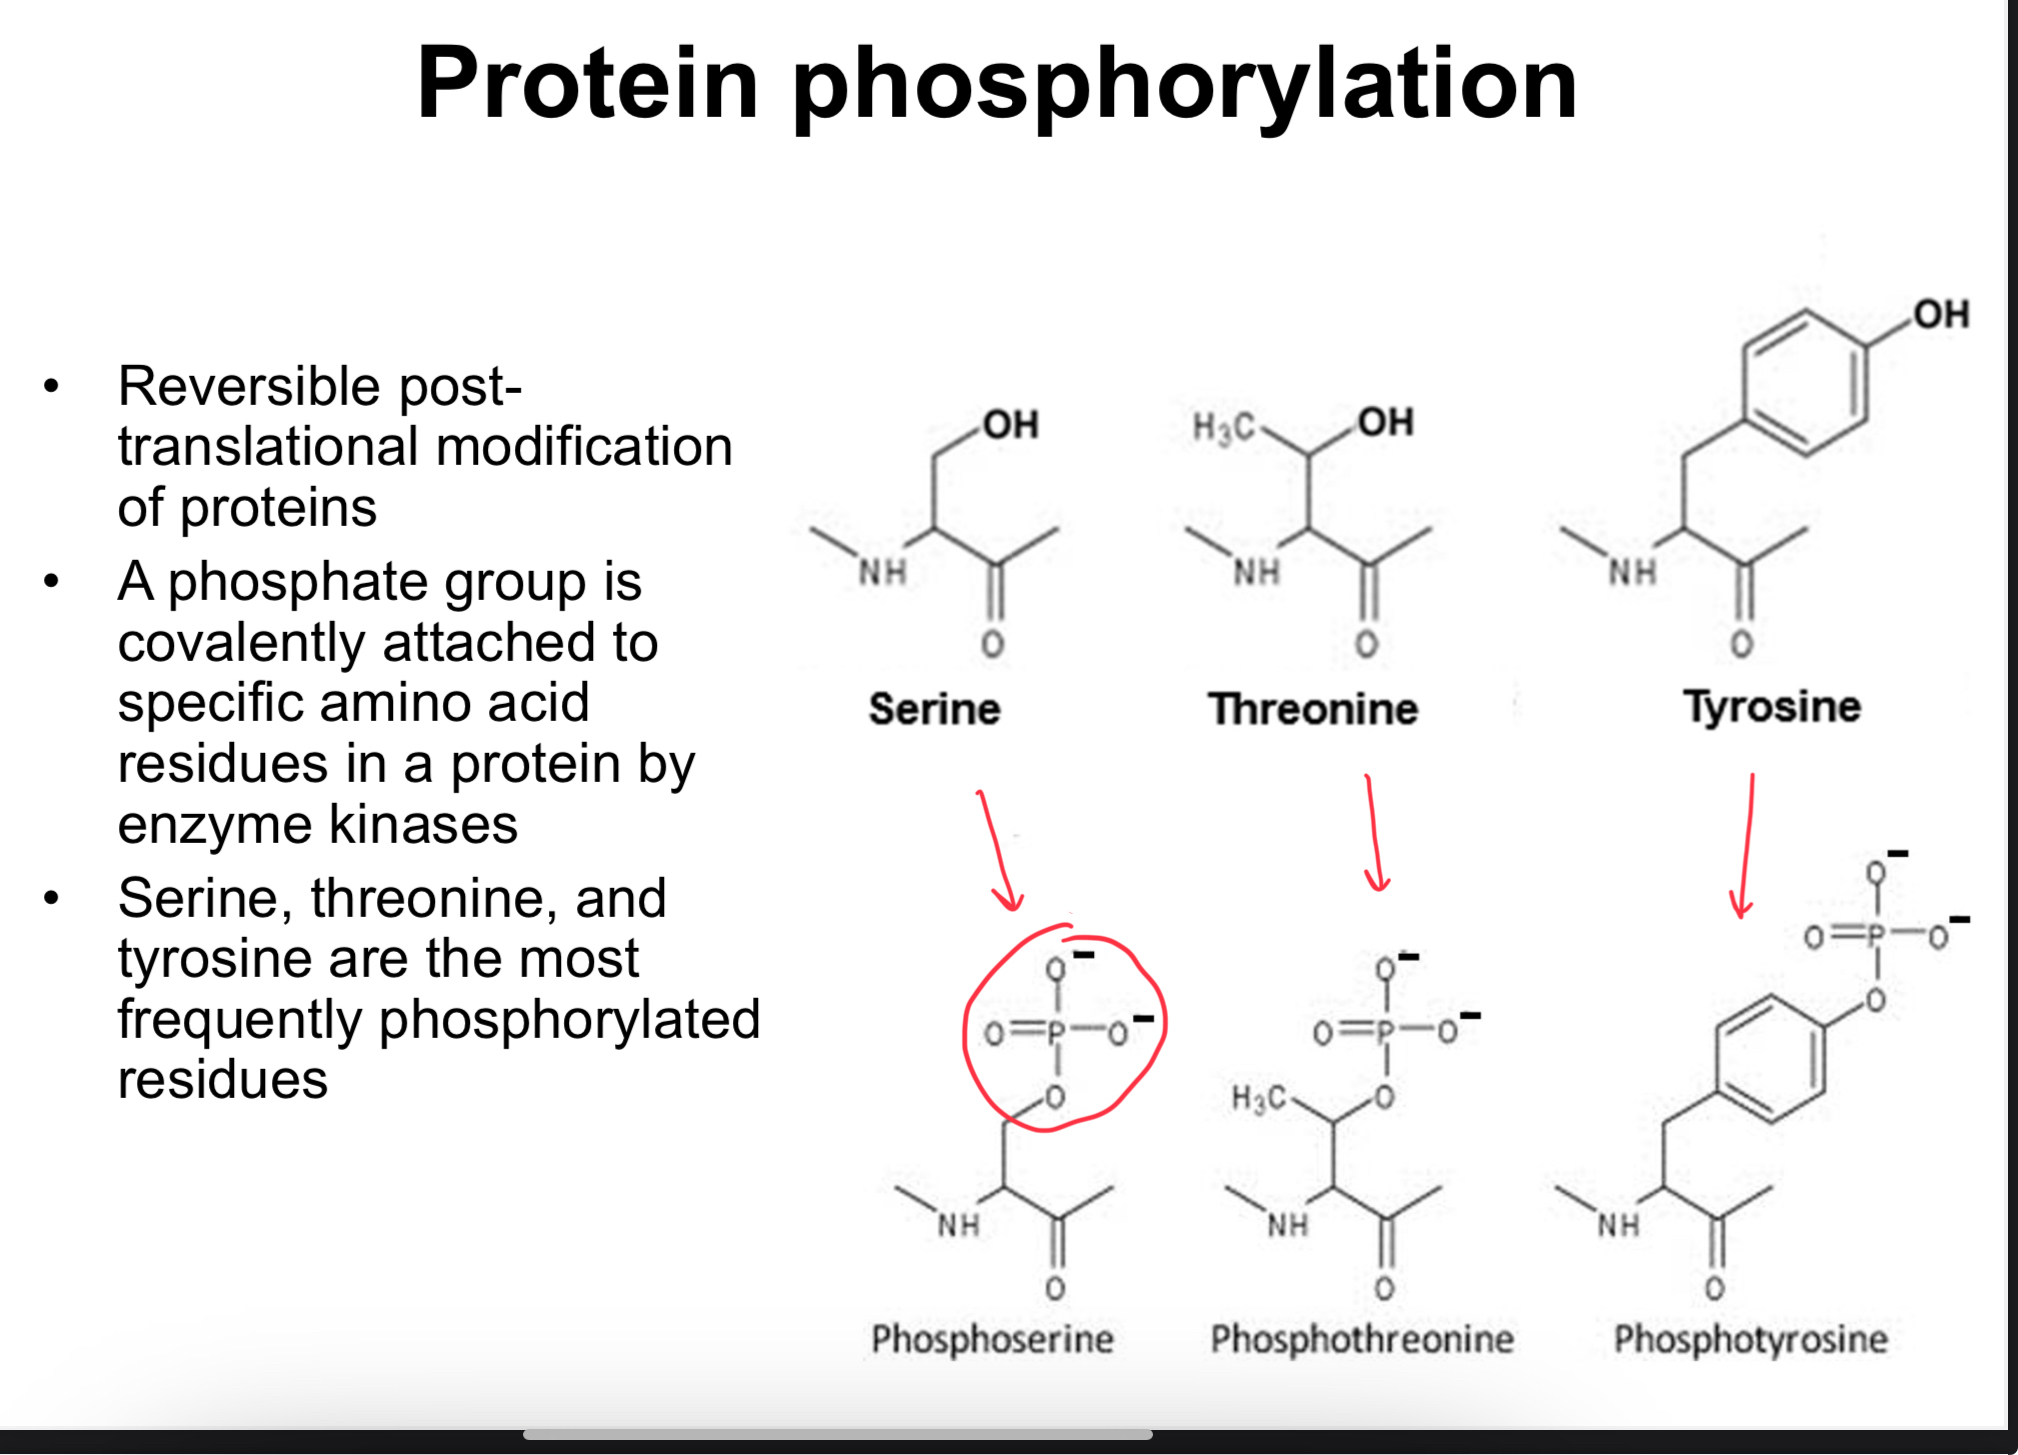
Phosphorylation (a common PTM)
Typical residues: Serine (Ser), Threonine (Thr), and Tyrosine (Tyr) that contain hydroxyl groups suitable for phosphorylation.
Example: phosphoserine adds a phosphate group to the Ser hydroxyl group.
Functional consequence: phosphorylation can switch on/off interactions with partners or ligands; acts as a regulatory switch.
Other common PTMs mentioned
Lipidation (e.g., attaching a fatty acid to a cysteine side chain) to alter membrane association or localization.
Glycosylation (adding sugars to polar side chains) to affect solubility, stability, or recognition.
Hemoproteins (heme attachment) as a modification example
The heme group is not a simple ligand; its attachment transforms the protein into a functional hemoprotein with distinct properties.
Collagen-related PTMs are cited as examples later in the course.
Quick recap of four levels of protein structure
Primary structure: amino acid sequence
Secondary structure: alpha helices and beta strands (e.g., the eight helices in myoglobin)
Tertiary structure: overall three-dimensional folding of a single polypeptide chain
Quaternary structure: arrangement of multiple polypeptide subunits (e.g., hemoglobin tetramer)
Practical learning outcomes related to ligands and binding
Describe what a ligand is and how ligands bind to proteins
Use binding equations to describe affinity and saturation
Explain and apply the concept of dissociation constant K_d and fractional saturation
Describe protein affinity as a function of ligand concentration and interpret binding strength using units (M, μM, nM, pM, fM)
Connections to the broader course and real-world relevance
Techniques discussed (SDS-PAGE, chromatography, mass spectrometry, X-ray crystallography, NMR) are foundational tools for purifying, identifying, and characterizing proteins in research and industry.
Understanding ligand binding basics is essential for drug design, enzymology, and physiological regulation.
Post-translational modifications provide mechanisms for rapid cellular responses and regulation without new protein synthesis.
Quick practice insight (example question framing)
If you are told two binding interactions have Kd values described as 1 nM and 1 µM, identify which is the tighter binding.
If given a ligand concentration equal to Kd, expect 50% saturation (f = 0.5).
Recognize typical affinity ranges in biology and interpret their biological significance.
Notable equations to memorize (LaTeX)
Dissociation constant: K_d = \frac{[P][L]}{[PL]}
Fractional saturation: f = \frac{[PL]}{[P]_{tot}}
Relationship between fractional saturation and ligand concentration (assuming total protein equals free plus bound):
f = \frac{[L]}{K_d + [L]}
Oxygen-binding form for gases (partial pressure dependence): f = \frac{PO2}{Kd + PO_2}
50% saturation condition (p50): when PO2 = Kd!
General unit guidance for binding affinity in biology: K_d \sim 10^{-3} \,\text{M} (mM), 10^{-6}\,\text{M} (µM), 10^{-9}\,\text{M} (nM), 10^{-12}\,\text{M} (pM), 10^{-15}\,\text{M} (fM)
Quick derivation reminder (for study): starting from Kd = \frac{[P][L]}{[PL]} and [P]{tot} = [P] + [PL], derive the expression for fractional saturation f = \frac{[PL]}{[P]{tot}} = \frac{[L]}{Kd + [L]}.
End of topic note: Next steps in the course will further explore protein purification workflows, quantitative binding analyses (e.g., more detailed binding models), and deeper dives into X-ray crystallography and NMR data interpretation.