unit 2 - constant velocity

graphical representations

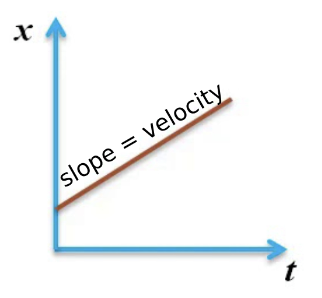
  • x vs t graph (position vs time)

    • the y-int represents the starting position (x0)

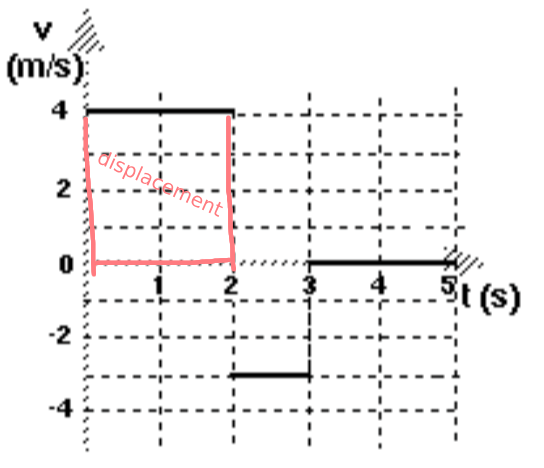
  • v vs t graph (velocity vs time)

    • area under curve is displacement (Δx)

  • motion map

    • each dot represents a time interval (ex - one second)

    • x-axis is position

mathematical representations

  • position

    • x = vt + x0

  • displacement - change in an object’s position

    • Δx = xF - xI

  • velocity - measurement of rate and direction

    • v̅ (average velocity) = Δx/Δt = slope of x

    • has direction

      • constant positive velocity

      • constant negative velocity

      • constant 0 velocity (at rest)

  • distance

    • ||Δx|| = magnitude of displacement (piece by piece)

      • || || = magnitude

  • speed - measurement of rate

    • ||v|| = distance/time = steepness of slope (piece by piece)

    • no direction

on the test

  • similar to worksheet 5 (2 pages)

  • either x vs t graph or v vs t graph given and you have to draw the blank one

  • given motion map, make x vs t graph

  • given x vs t graph, make mathematical model (equation), answer a couple question

  • given written story, make v vs t graph, and asks about distance, displacement, velocity, and speed

robot