1.1.3 Demand, Supply and the market equilibrium
The theory of demand
At higher prices, a lower quantity will be demanded than at lower prices. At lower prices, a higher quantity will be demanded than at higher prices. Basically, when the price is high demand is low and vice versa
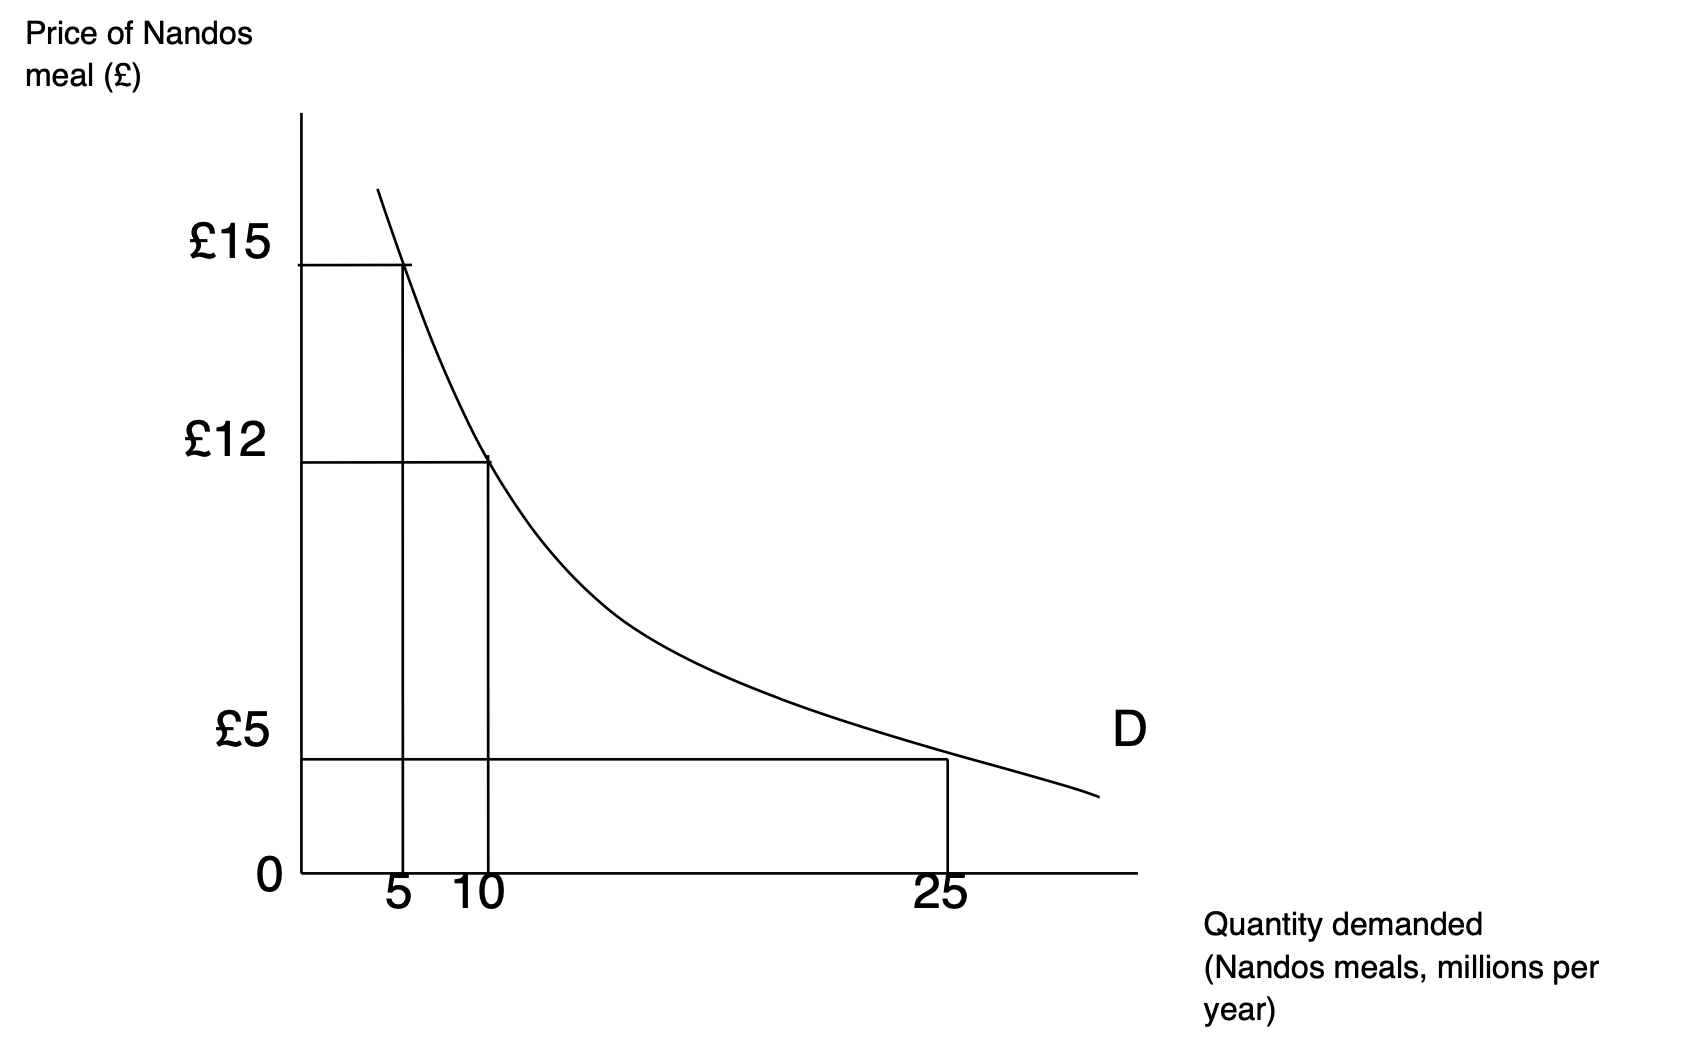
Note that I’ve drawn it as a curve, which is probably a little more realistic. Many of you will use straight line demand curves in the exam. This is perfectly OK, remember that these diagrams are only sketches that you are using to help you analyse a situation. Anyway, as you can see in the diagram above, the demand for Nandos meal is fairly low at the relatively high price of fifteen pounds, but at the bargain price of five pounds demand is much higher.
The determinants of demand (why demand will shift)
Real income. If one’s real income rose (real means ‘allowing for inflation’), one should be able to afford more meals at Nandos.
The price of complements and substitutes. Complement goods are bought together. E.g. a laptop and a laptop charger. If the price of a laptop rose significantly, the demand for laptop chargers would fall. Substitute goods are competitors. E.g. if the price of five guys decreased significantly, the demand would rise so the demand for Nandos meals would fall.
Tastes and fashions. A slightly obscure but very important determinant. More people are becoming vegetarian and vegan, these societal changes will result in a fall in demand for Nandos meals.
Advertising. Although many of you probably doubt the effectiveness of some of the appalling adverts on the TV, one assumes that these companies would not spend fortunes on these adverts if they did not expect to see a significant rise in demand for the product in question.
Population and demographic changes. Quite obviously, a significant rise in the number of people in a given area or country will affect the demand for a whole host of goods and services. Note that a change in the structure of the population (we have an ageing population) will increase the demand for some goods but reduce the demand for others.
Shifts of and movements along a demand curve
Movements along a demand curve
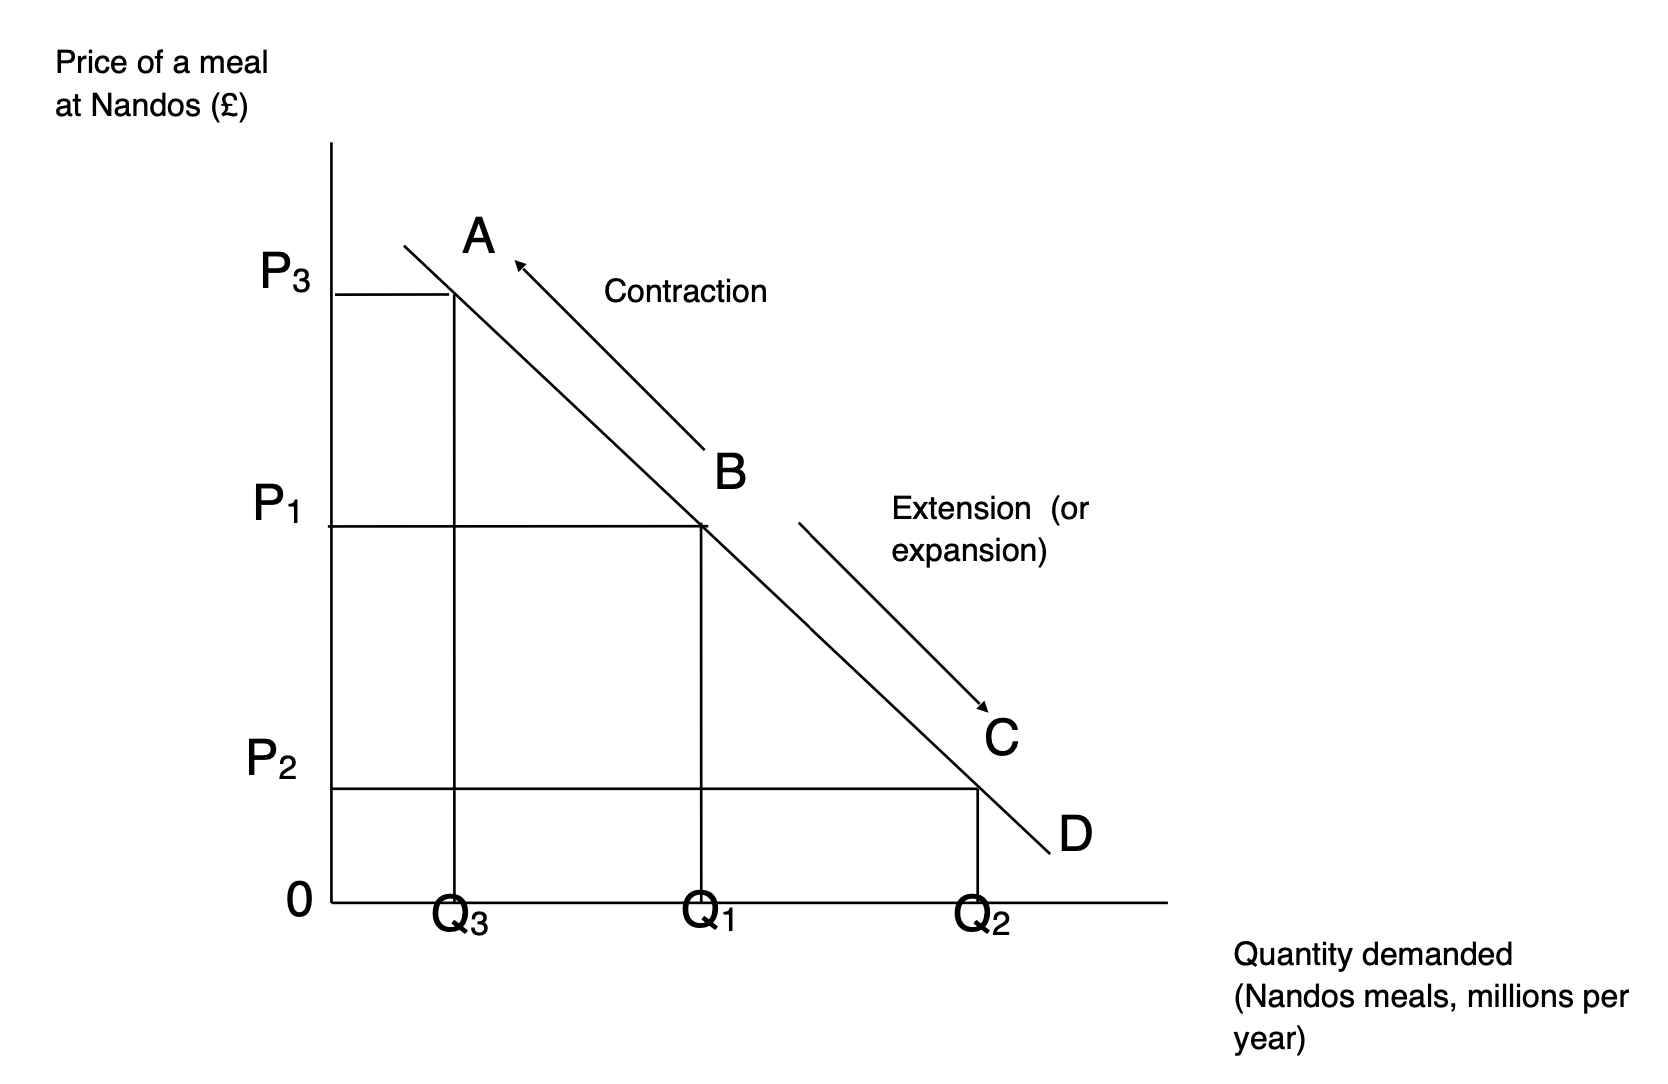
A movement along a demand curve only occurs when there is a change in the price of the good in question. Some textbooks call these movements extensions and contractions. In the diagram below (note that it is a straight-line sketch), when the price of a meal at Nandos falls (from P1 to P2) there is a rise in demand (from Q1 to Q2).The movement along the curve is from point A to point B. When the price rises (from P1 to P3) there is a fall in demand (from Q1 to Q3). The movement along the curve is from point A to point C.
Finally, note that the above diagram is not very realistic in the sense that the price would not change for no reason. Once we have studied supply as well you will see that, for a stationary demand curve, the price will only change if there is a shift in the supply curve. This may seem confusing at the moment but it will all make sense soon!
Shifts of a demand curve
A shift in the demand curve occurs if one of the ‘other’ (i.e. non-price) determinants of demand change. This means that for a given price level the quantity demanded will change. This is illustrated in the diagram below:
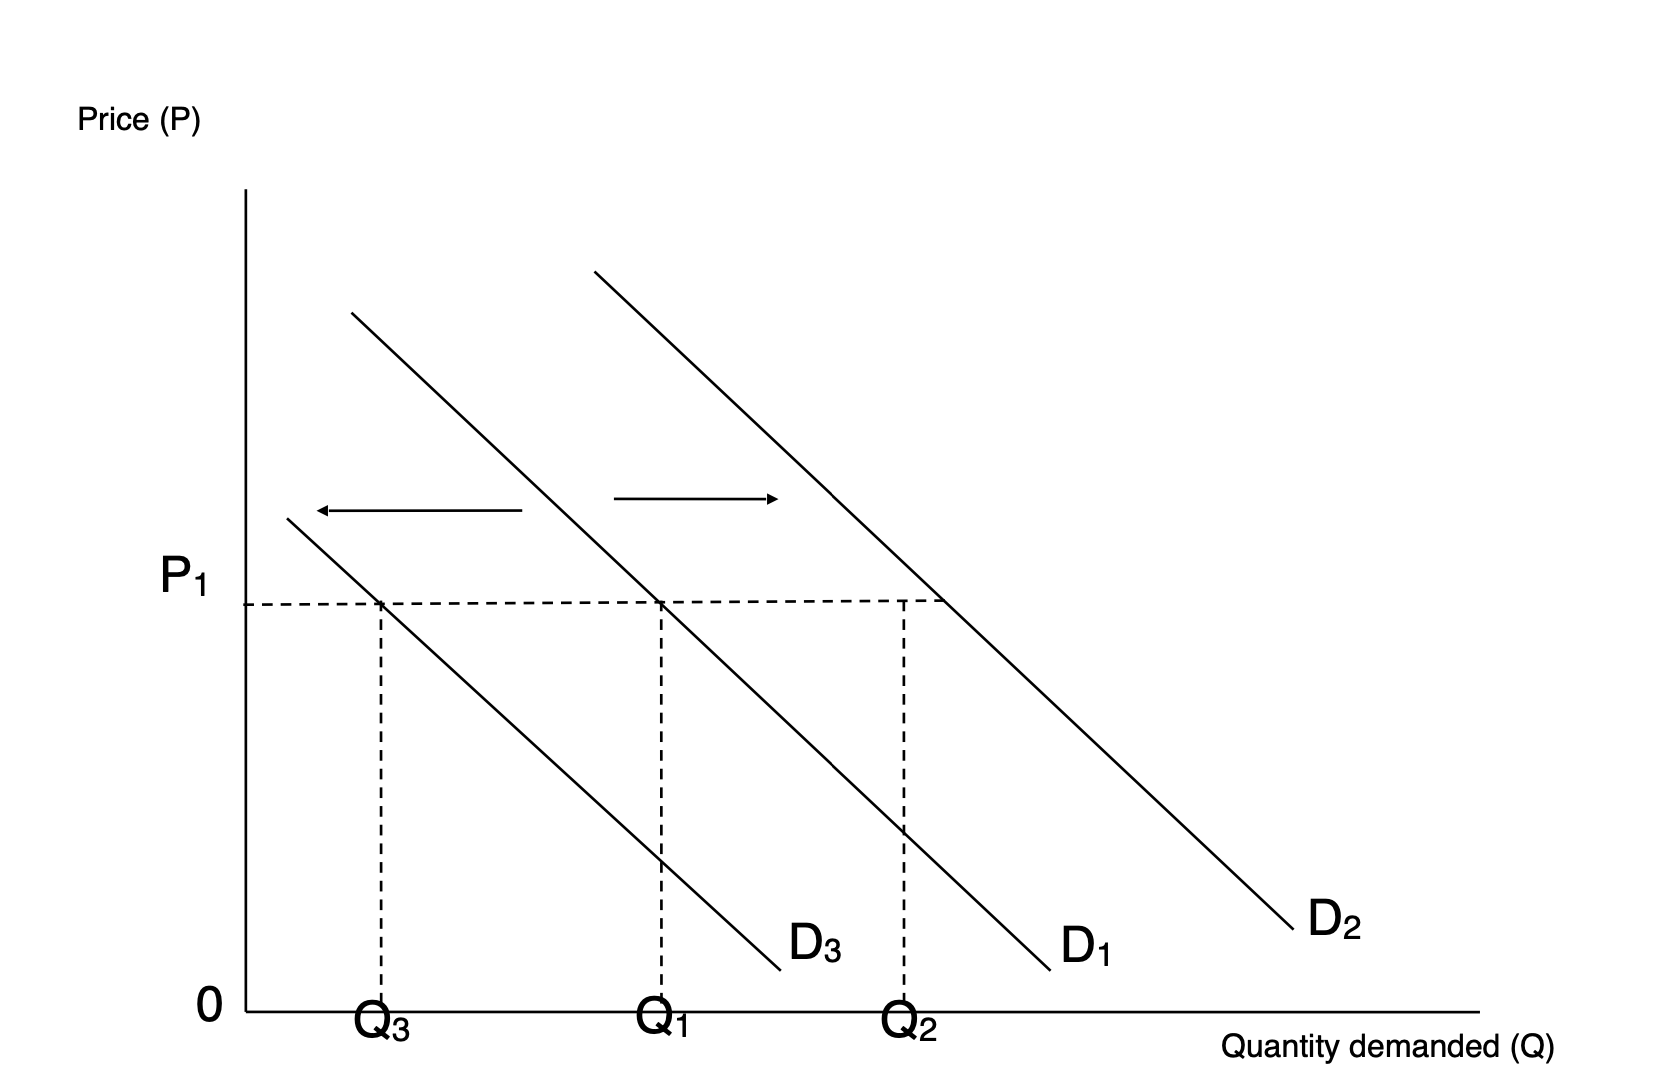
Note that the price has not changed (P1) and yet demand has increased (in the case of the shift to D2) to Q2. This could be due to a rise in real incomes (assuming the good is normal – see the ‘Elasticities’ topic), a rise in the price of a substitute good, a fall in the price of a complement, etc. (see ‘determinants of demand’ above).
The supply curve
Supply is how much of a given product the sellers, or firms, or producers are prepared to supply to the market at any given price.
Just like with demand, where it only became effective if it was backed up with the ability to pay, supply is defined as the willingness and ability of producers to supply goods and services on to a market at a given price in a given period of time. With demand, the downward-sloping curve reflected an inverse relationship between price and quantity demanded. The opposite is true of supply. In theory, at higher prices a larger quantity will generally be supplied than at lower prices and at lower prices a smaller quantity will generally be supplied than at higher prices. So this time we have higher supply at higher prices and vice versa.
The upward-sloping supply curve can be seen below:

While it is fairly obvious why the demand curve is downward-sloping, it is not so clear why the supply curve should be upward sloping. Basically, the producer will make higher profits as the price per unit sold increases. Imagine that a brewer produced a lager and an ale. Assume, not unreasonably, that the costs of production are the same per pint produced, whether it is a pint of lager or a pint of ale. If the price of lager then rose relative to the price of ale, it would seem sensible for the brewer to transfer resources from making ale towards the production of lager, thereby increasing the supply of lager as its price rises.
The determinants of supply
As with the demand curve, there are many things that affect supply as well as the price of the good in question. Notice how similar many of these factors are in comparison to the factors that affect demand. Notice also that nearly all of these factors affect the firms’ costs. Given that the firms’ supply curve is its marginal cost curve (we will come back to this in Theme 3) then it is of no surprise that a cost changing measure will shift the supply curve.
Prices of other factors of production. An increase in the price of, say, bread, will increase the costs of Nandos meals and so for any given price the firm will not be able to produce as many burgers. Hence, the firm’s supply curve will shift to the left. The same would be true for changes in wage costs or fuel costs.
Technology. The supply curve drawn above assumes a ‘constant’ state of technology. But as we know, there can be improvements in technology that tend to reduce firms’ unit costs. These reduced costs mean that more can be produced at a given price, so the supply curve would shift to the right.
Indirect taxes and subsidies. When the chancellor announces an increase in petrol tax, it is the firm who actually pays the tax. Granted, we end up paying the tax indirectly when the price of petrol goes up, but the actual tax bill goes to the firm. This again, therefore, represents an increase in the cost to the firm and the supply curve will shift to the left. The opposite is true for subsidies as they are hand-outs by the government to firms. Now the firm can make more units of output at any given price, so the supply curve shifts to the right.
Labour productivity. This is defined as the output per worker. If labour productivity rises, then output per worker rises. If you assume that the workers have not been given a pay rise then the firm’s unit costs must have fallen. Again, this will lead to a shift to the right of the supply curve.
Entry and exit of firms to and from an industry. If new entrants are attracted into an industry, perhaps because of high profit levels (much more on this in the topic ‘Market structure’ that we will cover in Theme 3 next year), then the supply in that industry will rise at all price levels and the supply curve will shift to the right. If firms leave the industry then the supply curve will shift to the left.
Natural factors – e.g. weather affects the supply of crops. Natural disasters will reduce supply
As with demand, we must now look at the difference between a movement along a supply curve and a shift of a supply curve.
Shifts of and movements along a supply curve
Movements along a supply curve
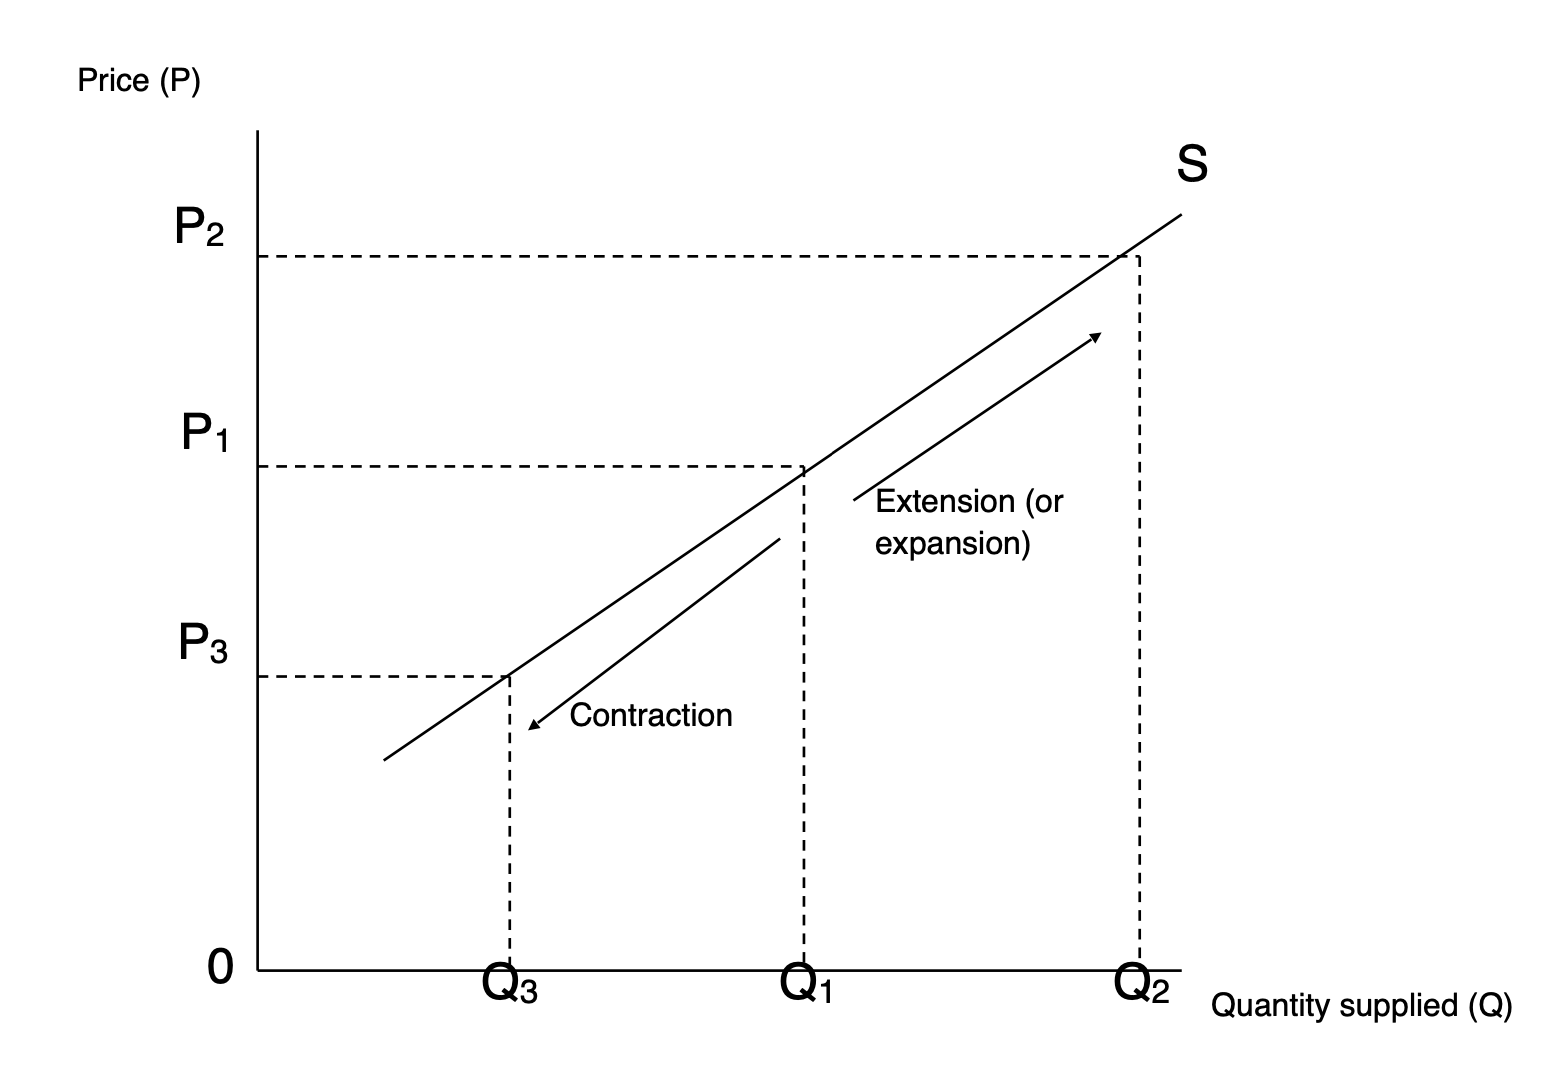
A movement along a supply curve only occurs when the price changes. In other words, the price changes but the other non-price determinants remain constant. The diagram below shows that a price rise will cause an extension up the supply curve, from point A to point B, whilst a price fall will cause a contraction back down the supply curve, from point A to point C.
Shifts of a supply curve
As with shifts of demand curves, supply curves shift, at all prices, if there is a change in one or more of the determinants of supply. As stated above, nearly all the determinants of supply affect the costs of the firm and, therefore, its supply curve, which is its marginal cost curve. Put simply, if something happens that increases a firm’s costs regardless of the price level (e.g. an increase in the wage rate, of an increase in government taxes), then the firm’s supply curve will shift to the left. If something happens that decreases a firm’s costs regardless of the price level (e.g. improved technology or a subsidy from the government), then the firm’s supply curve shifts to the right. The diagram below demonstrates these shifts:
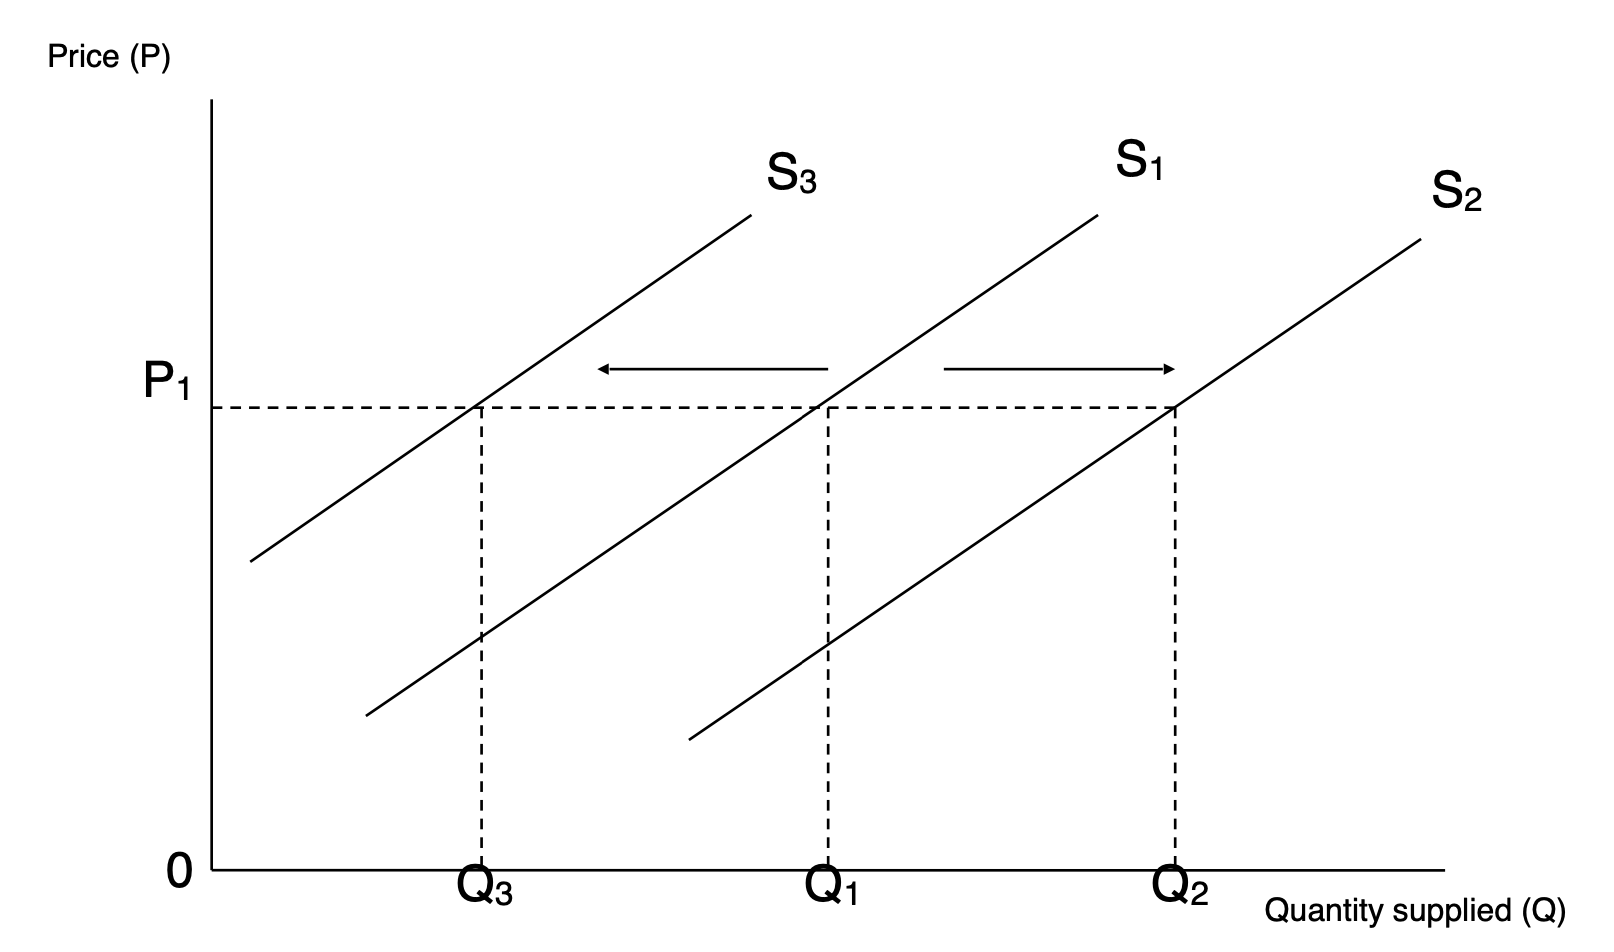
Note that the price remains unchanged at P1; the shifts in the supply curve are caused by various changes in the determinants of supply.
The equilibrium price
Having looked at the demand and supply curves in some detail, we now we need to bring these two things together to find the equilibrium price. After all, the market for any good or service needs buyers and sellers. The demand curve represents the actions, at any price level, of the buyers (or consumers). The supply curve represents the actions, at any price level, of the sellers (or firms, or producers). To find out what the price level will actually be, we need to see what happens when we combine the demand and supply curves.
The dictionary definition of ‘equilibrium’ is ‘a state of physical balance’, or put more simply, ‘a state of rest’. As you will see in the following diagrams, any given market is only ‘at rest’ when supply equals demand, which is where the two curves cross.
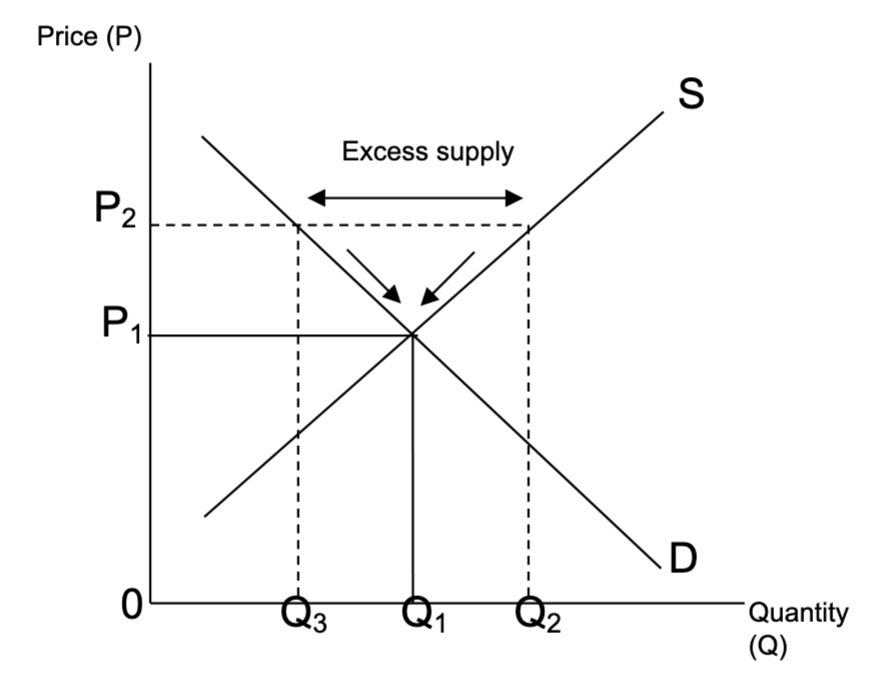
In the diagram above, let us assume that the price is P2 temporarily. At this price, demand is quite low (Q3) but firms wish to supply quite a lot (Q2). We have excess supply equal to Q2 – Q3. Firms find that they have a glut of unsold goods. This is not a ‘state of rest’. If you were one of those firms, what would you do? I would probably reduce the price a little (have a sale, maybe?) until I could sell off all my excess stock. Applying this to the diagram, the price would fall until firms reached a position where they no longer experienced excess supply. This occurs where supply equals demand, price P1, quantity Q1. You may have heard of the ‘invisible hand’, Adam Smith’s famous metaphor that tries to explain what is going on here. Nothing physically forces the price down; it just happens naturally, or ‘invisibly!
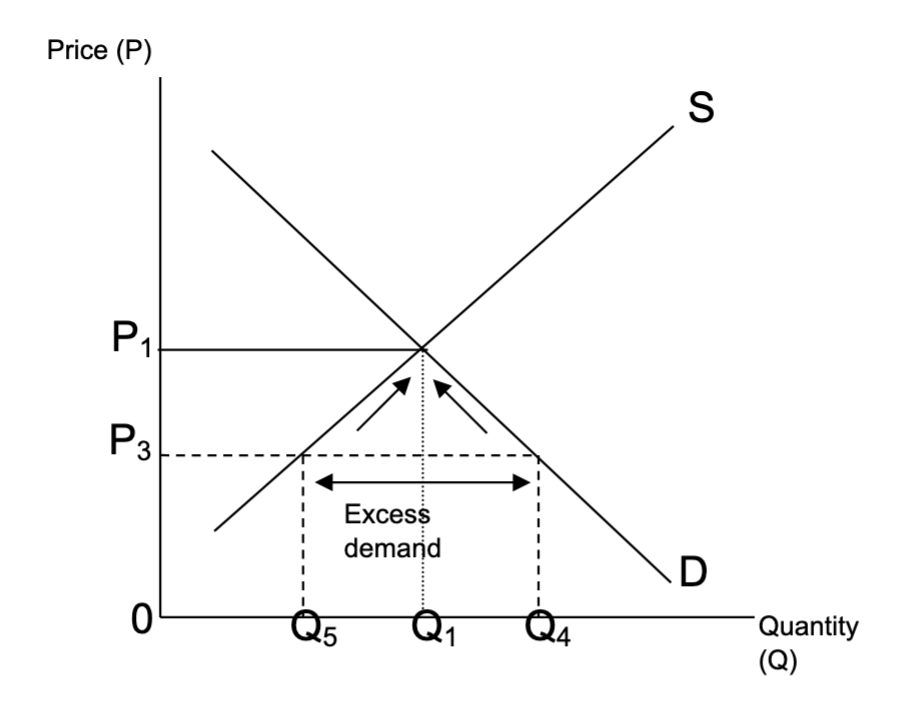
Now let us assume that the price is P3 temporarily. Now we have a situation when the price is relatively low, so the demand for the product (Q4) is much higher than the amount firms wish to supply (Q5). We have excess demand equal to Q4 – Q5. Now firms find that they sell their stock very easily and there are customers queuing at the door wanting more! What would you do this time if you were one of those firms? I would be thinking that I could get away with raising my price given the popularity of the good. I would keep doing this until there were no longer queues outside my door and the demand for my product matched the amount I supplied. Again, this will occur where supply equals demand, price P1, quantity Q1. The invisible hand is at work again!
Shifts in supply and demand
Earlier, we looked at why supply and demand curves might shift. We can now look at how these shifts can affect the equilibrium price.
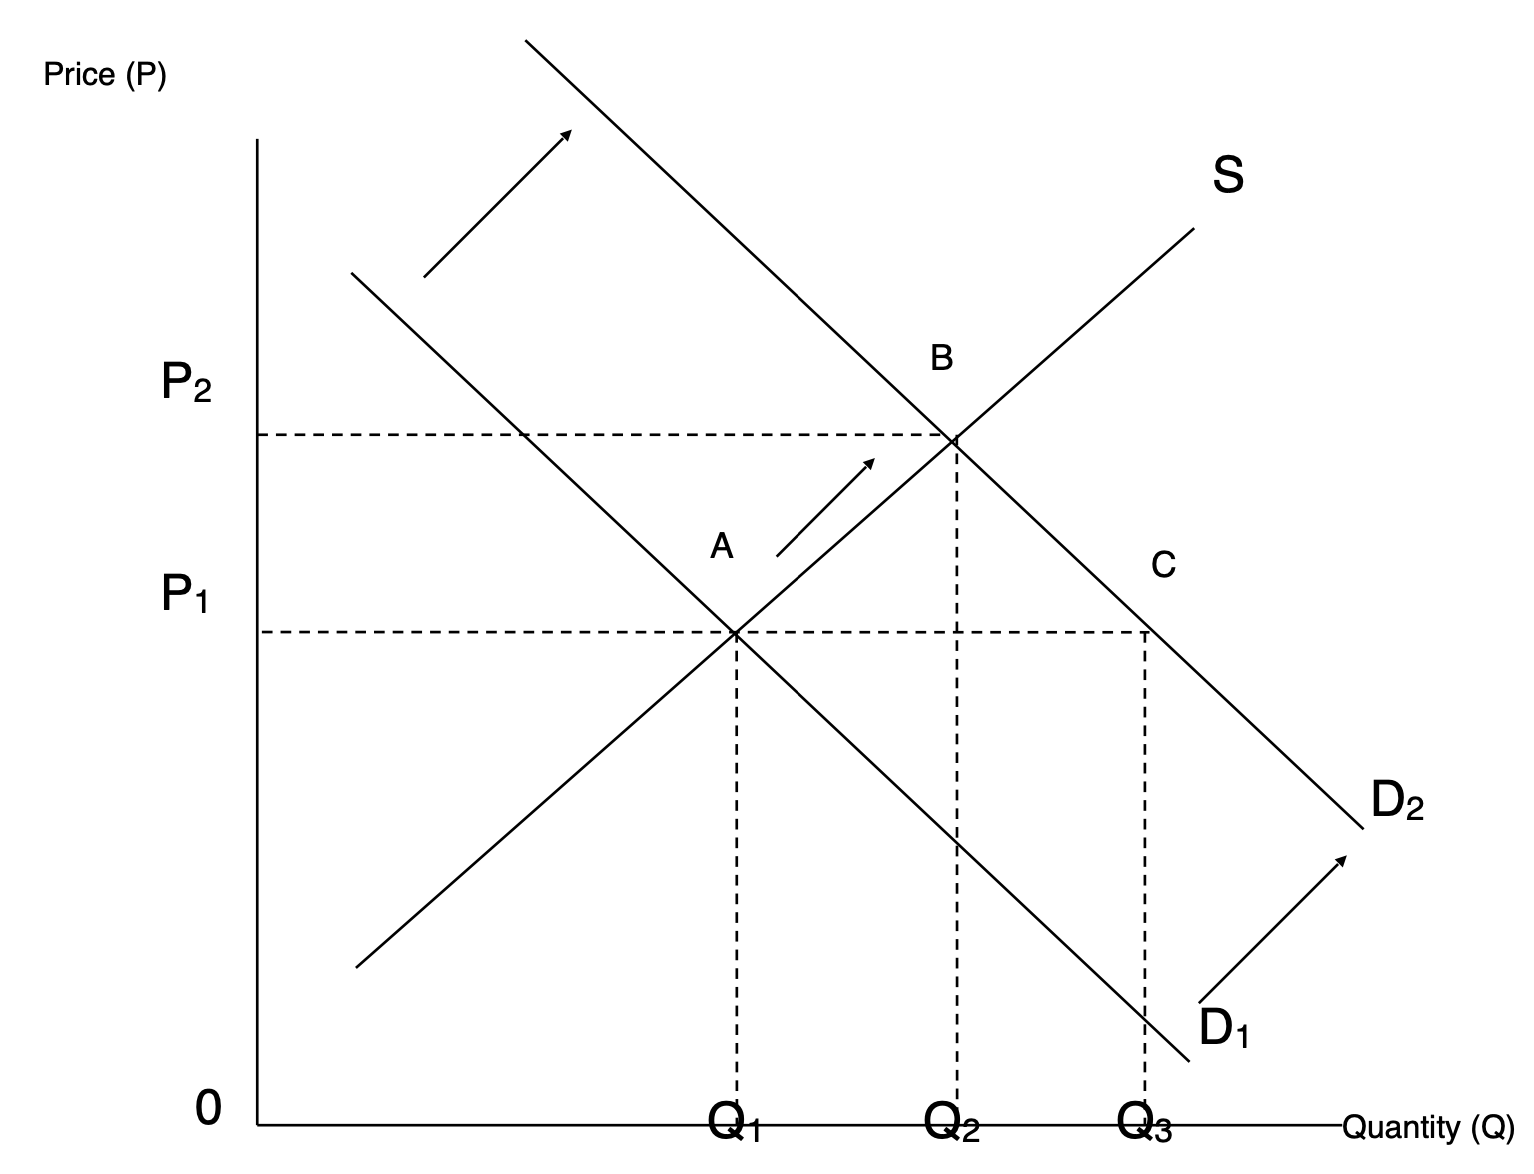
The original equilibrium price is P1, quantity Q1. We are at a ‘state of rest’. Now assume that one of the determinants of demand changes. For instance, there may have been an increase in advertising in the industry. This will shift the demand curve to the right (to D2). The price will not stay at P1 for much longer. We have an excess demand situation (A to C). As stated above, this will cause the price to be bid up, and this will keep going until we reach the new equilibrium price where the new demand curve crosses the supply curve (at point B). Note that there has been a shift in the demand curve, but only a movement along the supply curve. None of the determinants of supply have changed.
Earlier, we called this process the ‘price mechanism’. From the analysis above, we can see that the price itself has the most important role. The rising price has acted as a signal to possible new firms who might want to join this expanding industry. It acted as an incentive, encouraging existing firms to produce more (the movement along the supply curve). It also acted as a sort of rationing device in the sense that it put off some existing buyers and helped make sure that demand matched supply. (More on this in 1.2.7)
You can probably see that there are three other diagrams that I could draw: a shift to the left of the demand curve; a shift to the right of the supply curve and a shift to the left of the supply curve. You should be able to think of reasons why any one of those curves might shift and then draw the appropriate diagram yourself. Come and see me if you are unable to do this.