Lecture 6 Dividend Payout Policy and Imputation Tax System
How many types of dividends are there?
Types of Dividends
Regular Dividends: Paid twice a year in Australia; interim and final. Quarterly in US.
Special Dividends: One-off additional dividends.
Stock Dividends: Paid in shares, increasing shares outstanding and reducing stock price.
Reporting Methods:
Dividend per share (DPS)
Dividend yield
Dividend payout ratio (DPR)
What are some important dates for dividend holder?
Chronology of Cash Dividends
Declaration Date: Announcement of the dividend.
Ex-Dividend Date: First day shares are traded without the right to the dividend (you are still eligible for dividend as long as you hold the share between the declaration date and ex-div date).
Record Date: Date shareholders are recorded for dividends.
Payment Date: Date dividends are paid.

Why are there dividend policy and how many types are there?
Dividend Policy Overview
Definition: Decision to pay out net profits as dividends or retain them.
Types of Dividend Policies:
Regular Dividend Policy: company pays dividends at consistent rate.
Stable Dividend Policy: pay a stable or slowly increasing dividend overtime despite volatility (gradual adjustment towards a target payout ratio based on sustainable earnings).
Residual Dividend Policy: pays out dividends after all capital expenditures are met.
Hybrid Policy: combination of all above.
No Dividend Policy: reinvest everything
How can investment decision affect share price?
Impact on share price depends on investment profitability, using these two criteria:
Net present value of a project.
Decision of dividend payout.
growth rate is not one of the reasons, because it is driven by the investment decision (g = [1-DPR] *ROE)
One way to see this is comparing the ROE and the re, if ROE >, the investment is making positive NPV, and vice versa.
E.g. if a firm decided to reinvest 25% of its earnings, we would likely see an increase in share price (cutting DPR can be a double-sided blade).
How to calculate share price when firms change their regular dividend policy?
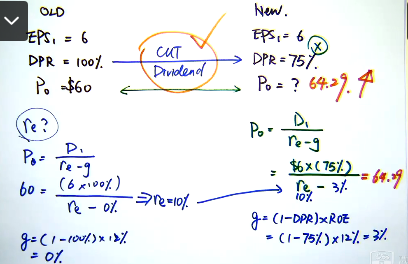
Write out the equation for share price calculation (green part)
Write out the dividend amount of the first term, times with the DPR
find the sustainable growth rate, we will have return on equity rate left to calculate.
Using the old period, we have growth rate of 0, and able to find the return on equity rate (blue part); remember: dividend amount times with the DPR.
using the return on equity rate (same for every timeline) and plug in the share price calculation.
How the dividend payout ratio influences dividend policy?
Dividend Payout Ratio (DPR) Influence
High DPR indicates a focus on returning earnings to shareholders.
Low DPR suggests reinvestment in growth, sometimes companies may priorities reinvestment than paying dividends.
Mature companies often have higher DPR.
The DPR can indicate a company’s financial health and future prospects.
How do companies decide the dollar amount of dividends?
Lintner's Findings (1956)
Executives set long-run target payout ratios.
Focus on changes in dividends based on long-term forecasts.
Reluctance to cut dividends (depends on whether firm have good investment opportunity or not).
What is the stable dividend policy formula?
Stable Dividend Policy
Gradual adjustment towards a target payout ratio based on sustainable earnings.
this gradual change in dividend prices may send a market a more easing and relaxing news rather than regular dividend policy which cause large change.
adjustment factor is the period ratio. e.g. 5 years = 1/5

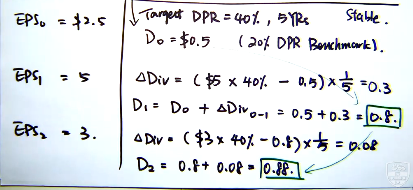
calculate the previous dividend for time 0 with given DPR.
find the change in dividend
Constant dividend payout ratio vs Stable dividend policy
Constant dividend payout ratio makes an assumption that dividend must fluctuate with earnings in the short term which can send mixed signals to the market.
Stable dividend policy does not reflect short-term volatility in earnings. Even if earnings are temporarily decreased over the short term, it still expected to gradually increase its dividend.
What is the Impact of Dividend Policy on Shareholder Wealth?
Miller and Modigliani (1961) argue dividend policy does not affect shareholder wealth under certain assumptions.
Shareholder’s wealth = share price + dividend (as of current)
The Modigliani-Miller Theorem | Overview, Formula & Examples - Lesson | Study.com
Capital Structure Theories - 3 - Modigliani - Miller Theory - MM Hypothesis on Capital Structure (youtube.com)
When does the dividend policy doesn’t affect shareholder’s wealth?
Conditions for Dividend Policy Irrelevance
No tax
No transaction costs.
Equal information among market participants.
Absence of personal or corporate taxes.
MM Theory in actions
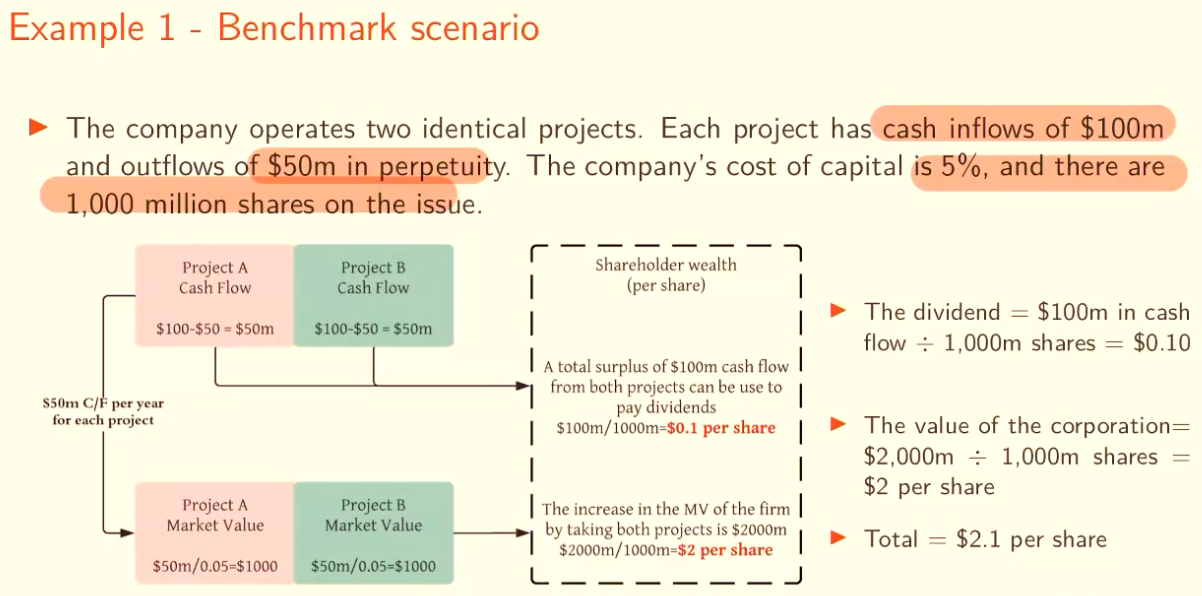
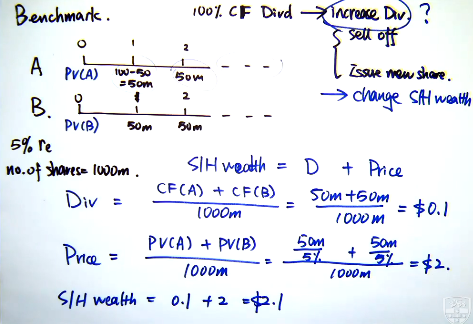
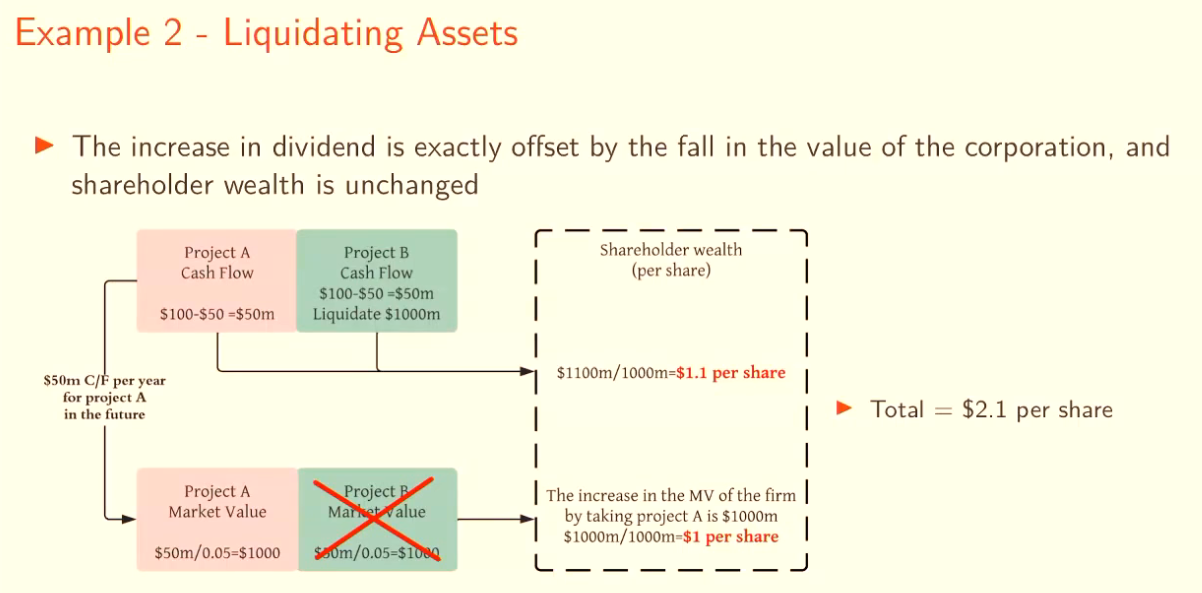
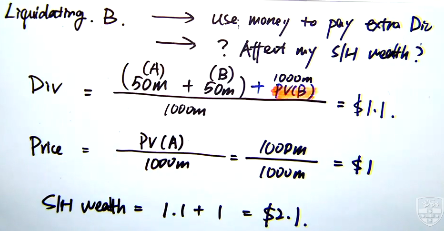
Steps:
Find the new price after liquidating an asset
Find new company value by taking off the project value and add up the profit made from lay off a project from the initial company’s value.
Find the new price per share from taking the new company value divided for the number of shares remaining.
Find the new dividend per share
Sum the new dividend per share and the new price per share to get the new shareholder’s wealth.
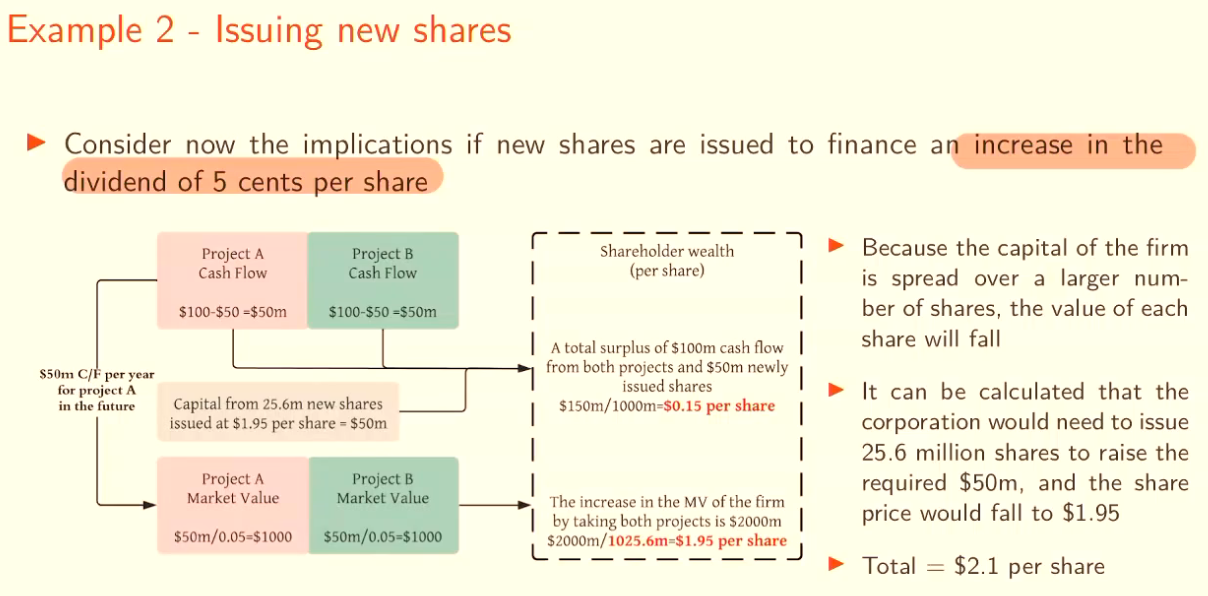
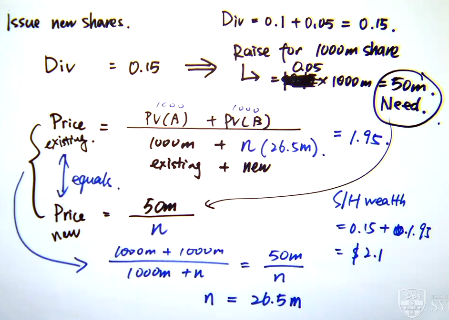
Steps:
Calculating the amount of money to pay for higher dividend.
Calculate the cost of issuing new shares on top of the required amount of money to pay for higher dividend
Find the company’s worth and its current price per share.
Find the new number of shares issued by dividing the cost of issuing new share by the current price per share.
Find the total number of shares by summing the new share amount and the company’s share pay out.
Find the new price per share by dividing the company’s value to the new number of shares.
Find the new dividend per share by summing the old dividend and the changing amount.
Sum the new price per share and new dividend per share to get the new shareholder’s wealth.
What are the differences between classical tax system and imputation?
Taxation Systems
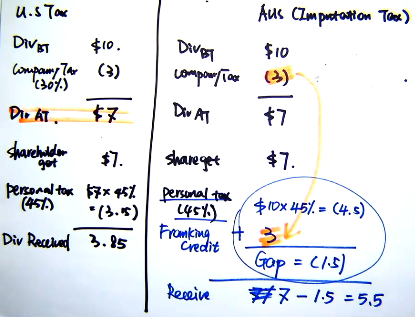
Classical Tax System (US): Double taxation on dividends.
company pay tax at the corporate level income.
shareholders pay tax at their personal rates on the dividends.
shareholders receive their dividends.
Imputation Tax System (AUS, NZ): Dividends come with franking credits, reducing effective tax burden.
companies pay at corporate level income.
shareholders pay tax at their personal rates on the subtraction of the cash dividend and franking credit.
shareholders receive their dividends (so pay the gap).
What is a franking credit?
Franking Credit
Represents tax already paid by the company, preventing double taxation for shareholders.

tc: the corporate tax rate
tp: personal tax rate
Div AT: dividend after corporate tax
Companies can adjust the ‘frank’ level: unfranked, partial franked, fully franked.
Note: if the question says [DPS value] franked, this mean the corporate tax has been paid on the dividend.
Who is eligible of franking credit?
residency status
corporation based in Australia/NZ
What is the market value of franking credit?
Market Value of Franking Credit (φ)
Measures market value of distributed credits; varies between 0.3 to 0.57.

 Knowt
Knowt
