128- Manage Quality
Manage Quality
Previously known as "Quality Assurance." Now, "Managed Quality" encompasses quality assurance and more.
Job: Ensure processes followed are correct to produce a quality product, service, or result.
Monitoring Processes
Observe the team's work (e.g., painting, coding) to ensure adherence to quality standards and policies.
Question: Are they following the right standards and procedures to get good quality?
Focus: Managing the process to produce quality products and services.
Translation and Objectives
Translating quality management plan activities into executable quality activities.
Make sure steps and procedures lead to quality outcomes.
Increases the probability of meeting quality objectives.
Identify ineffective processes and causes of poor quality.
Addressing Ineffective Processes
If original processes are ineffective, fix them.
Confirm quality processes meet objectives.
Poor quality is unacceptable; meet quality requirements.
Inputs & Outputs
Inputs: (Covered previously)
Tools: Design for X, quality audits.
Outputs: Quality reports, test, and evaluation documents (unique to this process).
Quality Tools
Affinity Diagram
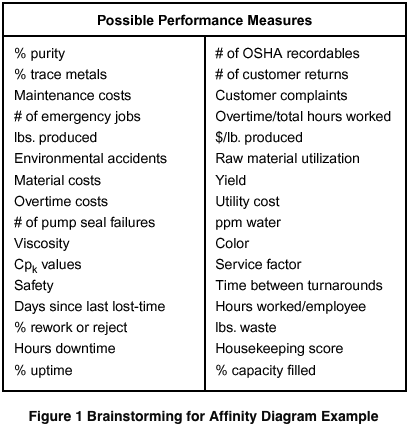
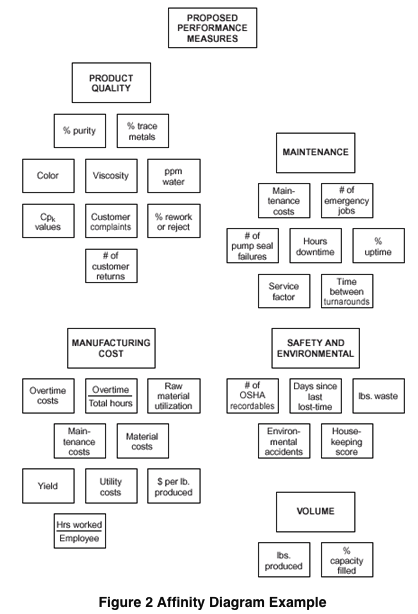
Used to group data.
Mentioned in the planning section.
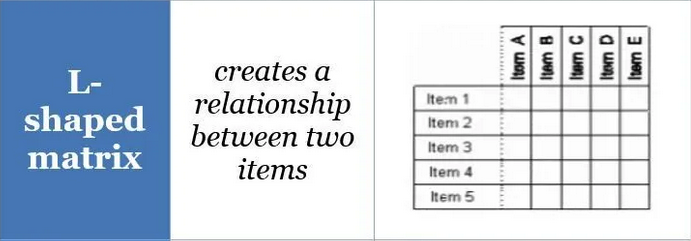
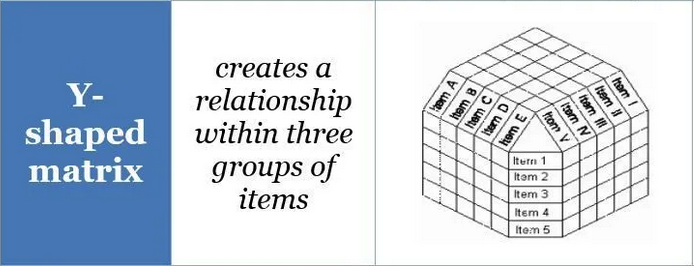
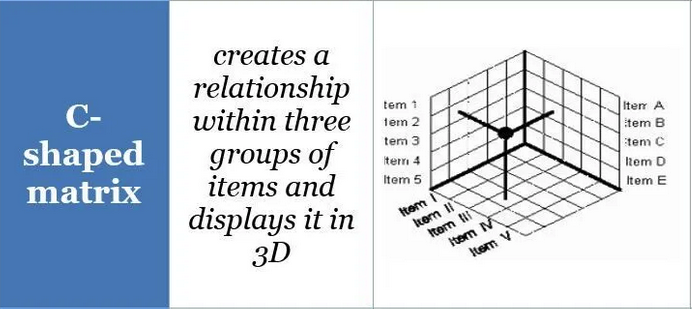
Matrix Diagram
A matrix diagram is a project management and planning tool for displaying and analyzing the relationships between two or more data sets.
Controls how processes are related.
Visualizing complex relationships
Identifying problems and growth opportunities
Comparing potential solutions
Reviewing performance
Type of Matrix Diagrams
L Shaped
T Shaped

Y Shaped
C Shaped
X Shaped

Cause and Effect Diagram
Also known as Ishikawa or fishbone diagram
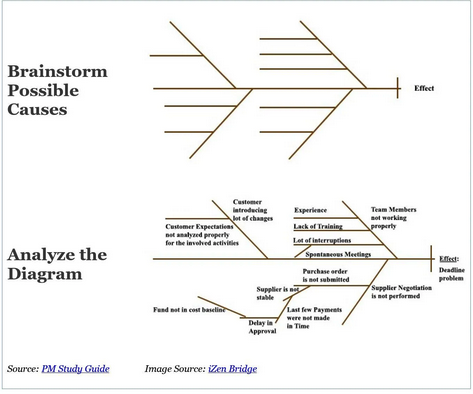
Identifies all causes for defects or customer dissatisfaction.
Example: Causes for failing a PMP/CAPM exam.
Categories: Work/family, exam related, study related, dedication.
Work/Family: Distractions from studying due to work or family obligations.
Exam: Exam anxiety affecting memory and recall.
Study: Lack of studying, using wrong materials.
Dedication: Insufficient dedication to the study process.
Flow Chart
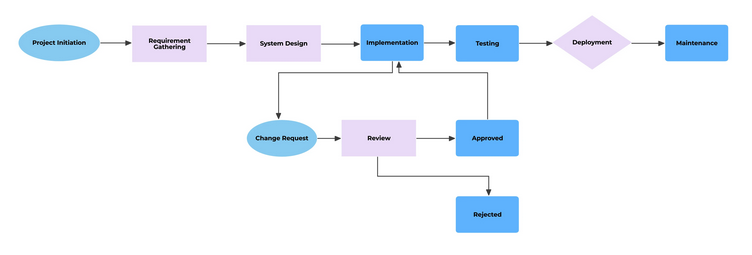
Shows how to follow a process.
Graphical representation of a process.
Histogram
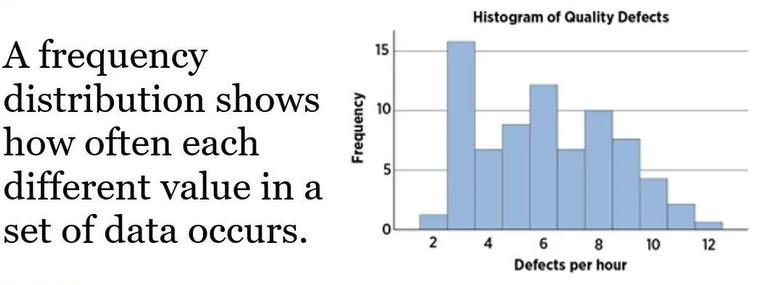
Shows frequency of events over time (bar chart).
Histogram is a type of bar graph that visually represents the distribution of numerial data. It's used to analyze data, identify patterns, and make informed decisions about project activities. For the PMP exam, understanding how to interpret and apply histograms is important, especially in quality management.
Pareto Chart
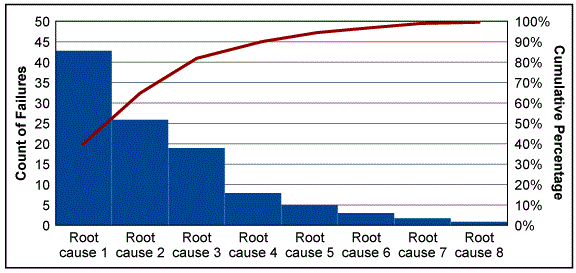
A powerful tool for showing the relative importance of problems. It contains both bars and lines, where individual values are represented in descending order by bars, and the cumulative total of the sample is represented by the curved lineIllustrates Pareto law (80/20 rule).
80% of effects come from 20% of causes.
Examples:
80% of crime from 20% of criminals.
80% of revenue from 20% of products.
80% of debts come from 20% of reasons.
Application to project management:
80% of project problems from 20% of causes.
Example: HR problems (absences, lack of knowledge) and vendor issues consume 80% of problems.
Example: 80% of project budget goes to salary and contractors.
Scatter Diagram
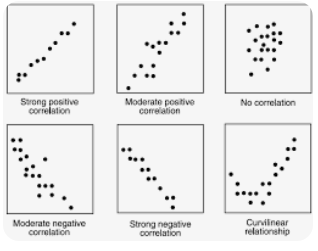
Scatter diagrams help discover correlations between variables and guide quality control in project management. Shows if a trend is forming.
Two variables to show a trend.
Example: Weeks (time) vs. number of defects.
Upward trend indicates increasing defects over time.
Quality Audits
Ensure the team is following the right processes.
Verify processes are best practices.
Identify shortcomings or gaps in processes.
Design for X
"X" represents what you are designing for (safety, cost, etc.).
Example: Designing a safety harness.
Design for safety: Prioritize safety regulations over cost.
Design for cost: Look for cheaper materials to be cost-effective.
Meet quality requirements for the designed product.
Problem Solving
Finding solutions to quality problems.
Identify the problem.
Determine the cause.
Look for solutions.
Address poor quality incidents.
Was the defect in the process, or how it was followed?
Quality Improvement Method
Consistently find ways to improve processes.
Look at new methods and industry standards.
Outputs
Quality Reports
Information on quality issues and recommendations.
Evaluating team's work and processes.
Identifying problems with quality processes and solutions.
Test and Evaluation Documents
Checklist to verify if deliverables meet quality requirements.
Example: Checklist for wall paint quality or application quality.
Summary
Manage quality processes.
Ensure team follows quality processes.
Identify and address wrong or improvable processes.
Strive for high-quality products, services, and results.