EnvirSt 371 Midterm Exam (copy)
Theory of Remote Sensing
Basics
Definitions:
Remote Sensing: The science of deriving information about the Earth from satellite images and aerial photographs - class of images taken from an overhead perspective by means of reflected or emitted electromagnetic energy, including those based on non-visible radiation.
Aerial Photographs: Photographs taken from an airborne perspective, such as from a kite, plane, or balloon.
Aerial Photography: the field concerned with taking aerial photographs
Image Interpretation: deriving information from images using visual elements
Satellite Imagery: photos from orbiting satellites - cover large areas of Earth’s surface in multiple spectra with modest detail. Consistent return times and paths allow for data collection over time and space as well as across spectra.
Landsat: first earth-orbit satellite designed for observing land. Made spectral, spatial, temporal data of Earth’s surface available and analyzeable on a new scale
Spurred innovation of digital analysis tools now that regular, useful digital images were being produced
MSS: Multispectral Scanner System - became the primary sensor for Landsat 1 after its primary sensor failed. Produced reliable, high-quality, multispectral imagery that became the model for later Landsats.
UAV: unmanned aerial vehicles
Uses: aerial mapping, aerial photography, wildlife counts, infrastructure monitoring,
Photo-Interpretation: the field of analyzing photographs to derive information. precursor to remote sensing, which includes readings from nonphotographic sensors.
Photogrammetry: the practice of making accurate measurements from photographs
Scales of Remote Sensing:
Neighborhood Scale: high res, 4m pixels, detailed but small footprint
City Scale: Medium res, 30m pixels
Regional/Global Scale: coarse res, 500-1000m pixels, loss of detail but large footprints, daily coverage
History of Remote Sensing:
Foundation: the partnership of aerial photography with the airplane! Previously, aerial photography using kites and balloons, but the airplane allowed for more controlled, more expansive coverage of the earth.
WW1 marked the use of aerial photography systematically, and cameras designed for aerial use. Aerial photography was used for military reconnaissance.
Military applications drove rapid development. Photogrammetric instruments were developed, and aerial photography was used for civil applications as well.
WWII: use of the EM spectrum extends beyond the visible range - IR and microwave radiation becomes known
Cold War: photo interpretation of aerial photography, stereoscope viewing
Robert Colwell applies color infrared film, previously used to detect camoflauged enemies, to aerial agriculture and forestry. His research explored applying the NIR spectrum to monitor vegetation health!
Remote Sensing Imagery vs Maps: Maps are man-made, inherently annotated and made to be accessible to the viewer. Remote Sensing Imagery is raw sensor data that needs to be processed, annotated, corrected, etc before achieving the same level of accessibility
Energy
Energy Definition: the ability to do work. cannot be created or destroyed. can be absorbed, reflected, emitted
Radiation: transfer of energy in the form of EM waves or particles
Types:
Conduction: body transfers kinetic neergy to another body through collision
Convection: transfer of energy by circulation through gas or liquid
EM Radiation: emitted by all objects. energy generated by changes in E levels of electrons, radioactive decay, thermal motions of atoms and molecules, etc.
Nuclear reactions in the sun produce a full spectrum of EM radiation
Consists of an electrical field and a magnetic field at right angles to each other, perpendicular to the directrion of the radiation’s movement.
The EM Spectrum
Wavelength: Distance from one wave crest to the next
Frequency: The number of crests passing a fixed point in a given period of time - often measured in hertz, which = 1 cycle per second, and multiples of hertz.
Amplitude: The height of each peak. Often measured as E levels (spectral irradiance) in watts per square meter per micrometer
Phase: the extent to which the peaks of one waveform align with another. “in phase” = aligned perfectly.
Quanta: A quantum is the smallest unit of energy
Photons: Quantums of light - tiny units of light energy
Theorys of EMR:
Wave Theory: dependent on the frequency of radiation
velocity of emr - speed of light
Particle Theory: energy as a stream of particles (photons), moving in a straight line. size of particle proportional to radiation frequency. particles striking metal cause e- emission, generating electrical current.
Q (radiant E) = h (planck constant) * v (frequency)
EMR Spectrum and Properties/Importance: (Raging Martians Invaded Venus Using Xray Guns)
Radio: see below
Micro: especially significant in active remote sensing using radar, and aircraft+satellite sensors. penetrates haze, rain, smoke, clouds, etc.
active or passive sensing modes
two regions:
radar: up to 100cm
radio: longer
Infrared: hotter objects emit more IR. lower frequency, longer wavelengths
Thermal IR: conveys temperature information
SWIR: not subject to atmos. scattering, effective in mapping minerals, fires, crop health, and surface moisture
NIR: Not subject to atmospheric scattering, effective in detecting and monitoring vegetation (high reflection by leaf structure). Behaves analagous to visible light.
Visible: range defined by the human visual system. Films, sensors, and imagery built around this. Percieved colors reflect an object’s physical characteristics and circumstances.
objects only emit visible light at VERY high temperatures
higher frequency, shorter wavelengths
UV: almost completely absorbed by ozone in atmos. sun observed in extreme UV. In special cases, plants can absorb UV radiation and emit visible light.
X-Rays: completely absorbed by atmos. sense earth’s aurora (charged particles from the sun energize e-s in earth’s magnetosphere, give off x-rays)
Gamma: smallest, most energy, highest frequency. Completely absorbed by the upper atmosphere, so not available for terrestrial sensing, but can be used for sensing celestial bodies, stars, planets, galaxies.
History of Vis. Wavelengths:
Newton conducts prism study, finds white light split into wavelengths, finds that red light alone can’t become white again, but that rainbow can be condensed back to white - white light as a combination of colors.
Laws:
All objects above absolute zero have a temperature and emit energy. As temperature increases, E emitted increases, wavelength becomes shorter.
c = λv : speed of light = wavelength * frequency
c is only constant in a vacuum, changes by medium
Radiant Flux: Rate at which photons strike a surface, in Watts. Measure of E delivered to surface in a given time.
Irradiance: radiant flux per unit area (Watts/square meter) Measure of radiation striking a surface.
Radiant Exitance: Rate at which radiation is emitted from a unit area, also Watts/sq meter
Atmospheric Transmittance: amount of radiation that reaches earth’s surface. transmitted rad/incedent rad
Atmospheric Windows: wavelength ranges in the atmosphere where energy is allowed to pass through
Water Absorption: highest at “dips” on spectrum at 1.4, 2, 2.6 in vegetation (SWIR)
Atmospheric Constituents of Bands:
Ozone: absorbs short wavelengths, UV
CO2: absorbs mid and infrared wavelengths
Water Vapor: absorbs 80% in two main regions: 5.5-7, 27+
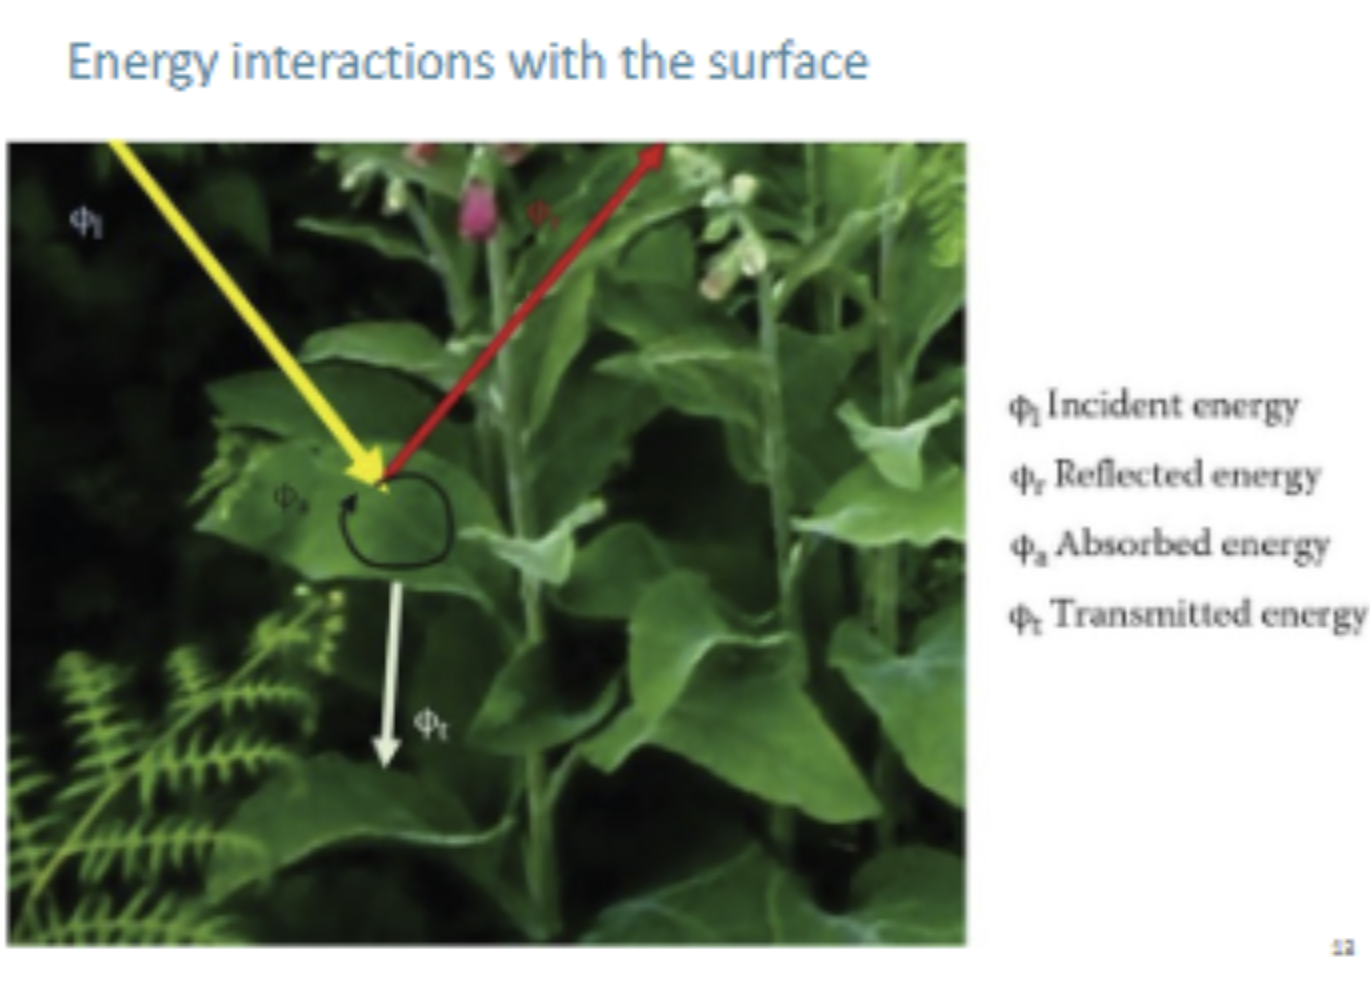
Atmosphere-Surface Interactions:
Refraction: incoming (incedent) radiation is bent from its trajectory as it travels from one atmospheric layer to another.
Index of Refraction = c(vacuum)/c(medium)
Absorption: atmosphere prevents transmission of radiation or its E thru the atmosphere - constituents absorb radiation and E.
Reflection: photons “bounce off” surface - actually simultaneously absorbed and re-emitted
Specular: reflection off a flat surface, all reflected photons leave at the same angle
Diffuse: reflection off a complex surface (like a tree), photons leave at all different angles.
Transmission: radiation passes through a substance without significant alteration.
ability to transmit energy = transmittance = transmitted rad/incident rad.
transmittance of films, filters, extremely important in remote sensing to capture EMR accurately.
plant leaves tend to reflect visible radiation but transmit significant amounts of IR.
a yellow object may reflect OR transmit green and red light while absorbing blue.
Atmospheric Scatter: Blue and UV regions most impacted
Scattering: EM field is disturbed by atmospheric constituents which redirect EM energy and alter the spectral distribution of energy in the beam.
Rayleigh: EM wave interacts with very small particles - occurs in pure air, caused by even fine dust or large gas molecules. particles are smaller than the wavelength of incoming flux. shorter wavelengths are scattered much more than longer - more energy = hit molecules emit more photons
Mie: EM wave interacts with particles a similar size to incedent flux wavelength. ie aerosols, suspended salts, small dust particles. Influences longer wavelengths than rayleigh. Produces hazy white light seen in mist and fog. stronger effect than rayleigh.
Non-selective scatter: particles very large compared to wavelength of incedent energy. ice crystals, water drops, large dust. all wavelengths impacted equally.
Scatter Effect on Image:
Brighter
Less contrast
lower resolution
cooler colors
Non-Selective Active vs Passive Remote Sensing:
Passive Remote Sensing: detects radiation reflected by objects due to naturally generated energy sources, like the sun. Also detects radiation emitted by objects in the thermal IR spectrum (warm vs cool objects)
Active Remote Sensing: detects radiation reflected by objects due to artificially generated energy sources, like radar, sonar
Remote Sensing of Vegetation
Levels of Organization: Interaction of Light at Each Level:
Pigments: molecules that absorb radiation in visible wavelengths
pigment color = visible emr not absorbed
absorbed emr causes e-s in pigments to jump to higher E levels, emitting IR radiation
Chlorophyll Absorption and Reflection (Chloroplasts):
Chlorophyll is a green pigment, located in the chloroplasts.
they recieve light passing into the leaf and use it to fuel reactions within the plant
chloroplasts also contain “accessory pigments” like carotenoids which also absorb light, and pass its energy to chlorophyll.
chlorophyll a: most important photosynthetic agent in most green plants
chlorophyll b: slightly different structure, found in green leaves, algae, and bacteria
chlorophyll preferentially absorbs blue and red light, and reflects green, as well as emitting heat and light.
Photosynthesis: light absorbed by chloroplasts, used to synthesize carbs from CO2 and H2O
Fluorescence: object illuminated with radiation at one wavelength emits radiation at another. Some sulfide minerals and chlorophyll emit visible radiation when illuminated with UV. In plants, fluorescence can be a measure of photosynthesis and indicate health.
Leaves: green and NIR scattered by chloroplasts/spongy mesophyll
Palisade Parenchyma: contains the largest chloroplasts - specialized for photosynthesis. amt of chlorophyll affects absorption/reflectance of visible light
Spongy Mesophyll Parenchyma: irregularly shaped cells surrounded by openings, with a large surface area. impact amount of NIR reflected or absorbed
Epidermis: cells close together without gaps. upper epidermis covered by cuticle, a waxy layer preventing water loss. The lower epidermis holds stomata which regulate movement of co2 into the leaf, and water out, which alters the thermal signature of the plant.
Stomata: regulate co2 and water levels
Reflectance Controlled By
Leaf Pigments: pigments reflect visible light
Cell Structure: palisades contain high chlorophyll, mesophyll reflects NIR, stomata regulates water content and CO2
Water Content: drier plants have higher reflectance in IR, especially SWIR where water absorption bands lie
Canopy: treetops. IR reflectance increases with leaf area, while visible light reflectance decreases.
this decrease in the visible may be due to the shadowing of lower leaves by upper leaves in the canopy.
the same is not true for NIR, which can be transmitted through upper layers, reflected by lower leaves, and retransmitted back through the upper leaves, enhancing NIR signal
absorption is directly tied to leaf area, or LAI
Albedo: reflectance of surfaces. varies depending on species, canopy structure. Snow has a very high albedo. Grass has a relatively high albedo for vegetation.
Leaf Area Index: LAI - ratio of leaf area to ground area. NIR reflectance is very sensitive to LAI, because leaves have high NIR transmission.
Spectral Vegetation Curve:
Red Edge: the contrast in vegetation reflectance between low red (chlorophyll absorption) and high NIR (mesophyll scattering) creates an "edge”
Red Shift: as crops approach maturity, the chlorophyll absorption edge shifts towards longer wavelengths due to an increase in chlorophyll a
Vegetation Reflectance Factors:
Water: Lowers SWIR reflectance
Soils: lower moisture content and lower organic matter content = higher reflectance
Phenology: the study of periodic biological events as influenced by the environment - ie sprouting, flowering. changes in phenology can indicate changing climates.
Health: a stressed plant will lose IR reflectance due to deterioration of cell walls.
Soil Reflectance Factors:
most energy incident on soils is reflected or absorbed - low transmittance.
main controlling factors:
moisture content (#1!)
organic content (#2!)
soil texture
soil structure
iron oxide content
Applications of Vegetative Sensing:
tracking health of wild and agricultural vegetation
determining ripeness of crops
determining soil moisture and organic content
assessing LAI of forested areas
distinguishing between species on a broad scale, biodiversity surveys.
Methods of Remote Sensing
Principles of Air Photos
Resolution: the ability to separate two adjacent objects in an image spatially
Grain: film resolution. smaller grain size, higher res
Pixel: digital resolution. smaller pixel size/more pixels, higher res
Vertical:
Advantages: use shadows to measure height, consistent scale
Disadvantages: Not intuitive, unfamiliar perspective, no view of sides of structures
Oblique:
Low: cannot see the horizon
High: can see the horizon
Advantages: 3-dimensional view, can easily see relative heights and sides of features, “intuitive perspctive”
Disadvantages: harder to calculate objective height and position
Air Photo Components:
Fiducial Marks: index marks attached to camera so that they are recorded on each photograph. where they intersect is the principal point.
Principal Point: optical center of the image - where a line perpendicular to the center of the camera lens would intersect the focal plane
Conjugate Principal Point: the location of one image’s principal point in an adjacent image in a stereopair.
Nadir:
Ground Nadir: point vertically below the center of the camera lens
Photographic Nadir: the intersection betweeen the line between the ground nadir and lens center on the actual image.
Flight Characteristics/Flight Lines:
Flight Line: line running through centers of aerial photos that marks the vehicle’s flight path
Altitude: “H” higher altitude allows for larger area captured, less detail
Overlap: overlap between images along the direction the plane is moving. typically 60%
Sidelap: overlap between images along parallel paths of the plane. 20-30%.
Drone lap is greater when there is greater distance between drone and ground.
Laps: avoid missing data between images, help align images together into a mosaic
Mission Planning: consider safety of site, evaluate site beforehand, assign points and flight path of drone, establish ground control station.
Camera-Ground Relationship: higher altitude = wider IFOV
Lens of Angle View: wider angle = wider IFOV
Focal Length: “f,” the optical distance from point where light rays converge (in lens) to the digital sensor (back of camera)
a shorter focal length means a more zoomed-out image, a wider angle
a longer focal length means a zoomed-in image, a narrow angle
Scale: relationship between size of image and area of earth surface portrayed
Small Scale: large area covered, low detail
Large Scale: small area covered, high detail
Representative Fraction: map scale/true scale
small RF = small scale image
large RF (closer to 1) = large scale image
Photo Scale Equation: RF = f/H
Calculating Scale: RF = PD (distance in photo between objects)/GD (distance on ground between objects)
Viewing Perspective: perspective of camera
Central Projection: top-down, map style
Orthographic Projection: 3-d perspective
Orthophotos and Orthomaps:
Orthophoto: corrected form of an aerial photograph, without errors of tilt and relief displacement
Orthomap: maps made from orthophotos, with place names, symbols, and geographic coordinates. can be made up more quickly and cheaply than maps
Stereovision:
Stereoscopy: deriving distance information (and/or height information) from two images of the same scene slightly offset.
Principles:
the stereoscope holds two low-power lenses that create parallel lines of sight to allow each eye a different image of the scene
stereoscopic photos are taken in sequences to get overlapping views of the terrain.
the photos are aligned so that the flight path passes from left to right
the interpreter identifies a destinctive feature present in the zone of overlap, and position the images so that the feature is 2.5 inches (the distance between the eyes) apart.
images should merge into a single 3d image
Advantages: pick up on subtle features not noticeable in a single image. view 2d images in 3 dimensions, allowing an enhanced interpretation of distance, texture, pattern.
Stereoscopic Parallax: differences in the appearance of objects from one eye to the other (when a scene is viewed with only the right eye, it looks slightly different than when viewed with only the left, or both).
Scale:
Small Scale: larger area per pixel, less detail, smaller RF
Large Scale: smaller area per pixel, more detail, RF closer to 1
3 Ways To Represent Scale:
Representative Fraction: the map scale over the true scale on the ground.
3 Photo Scale Equations for Representative Fractions:
RF = focal length/altitude
RF = photo distance between objects/ground distance between objects
RF = 1/(map distance between objects)(map scale denominator)/photo distance between two objects
Photo-Interpretation
Recognition Elements:
Tone/Color: an object’s ability to reflect radiation depends on its materials, wetness, internal structure, pigments
black and white: tonal contrasts
color: hue, chroma, value
Size:
Absolute: calculate using photo scale
Relative: unknown object compared to known object
Shape: cultural objects (buildings, crop circles) vs natural objects (lakes, rivers) can have distinctive shapes
Texture: apparent roughness or smoothness of region - pattern of highlighted and shadowed areas
Pattern: arrangement of individual objects into distinctive recurring forms - orchard-planted trees, street grid, etc
Shadow: can reveal aspects of size and shape. best when image is taken while sun is at a low angle, to maximize shadow. also marks objects that may otherwise be too small or camouflaged to be seen in their environment.
Site: topographic position. ie, sewage treatment plants positioned near flowing water, orchards near large water bodies.
Association: associating features with a larger context - a tractor implies farm work is being done nearby, etc
Context: it’s important to understand the perspective and orientation of images to avoid confusion, such as percieving images as inverted when lit from an unexpected direction, as well as the larger cultural, temporal, and topographical context the image is taken in.
Collateral Information: also ancillary information; non-image info used to assist in image intepretation. may be maps, field data, as well as intuitive knowledge of the interpreter.
Image Interpretation Keys: reference materials designed for rapid ID of features in aerial images. Consist of a collection of captioned images or stereograms, and a graphical or text description. Used especially in botany and zoology, such as the key of tree species crowns from lab 2.
Natural-Color (True-Color): Red, green, and blue bands represent the image as it is seen in the visible spectrum.
Color-Infrared (False-Color): NIR, red, and green bands, with NIR signal being represented in the red band. This allows a visual representation of how NIR signal varies across the image’s features, as well as red and green signal. Especially useful in observing vegetation and soil reflectance.
Additive and Subtractive Color Theory:
Additive: mixing light. intermediate colors formed when two or more primaries are reflected by an object, creating “yellow” (red+green) or “purple” (red+blue), etc.
relevant in film exposures, matters concerning radiant E
equal portions of all 3 make white light (complete reflection)
additive primaries: red/blue/green
Subtractive: mixing light absorbing substances. objects with subtractive primaries each absorb 1/3 of the visible spectrum, ie, yellow absorbs blue and reflects red and green, cyan absorbs red and reflects blue and green, magenta absorb green and reflects red and blue.
representations of colors in films and paintings formed by subtractive. matters concerning pigments, dyes, reproductions of color.
equal portions of all 3 make black (complete absorption)
Subtractive primaries: yellow/cyan/magenta
Use in Multiband Intepretation (Color Mixing for Interpretation):
understand what wavelengths are being absorbed or reflected based on image color and brightness
Photogrammetry:
Definition: The practice of making accurate measurements from photographs
Basics:
Example measurements, tasks:
Factors that Impact Interpretation and Measurements:
Perspective:
Projection:
Distortion:
Film/print shrinkage
atmospheric refraction
haze, clouds
lens imperfections
Aircraft movements:
Roll: turning around nose-tail axis. (tilting head)
Tilt: displacement of the focal plane (plane behind camera lens that image is projected onto) so that one side is higher than another.
Yaw: turning around top-bottom axis (shaking head)
pitch: turning around left-right axis (nodding)
Crab: failure to orient camera to flight line - camera is pointed skewed from direction of flight line.
Drift: shift of aircraft from flight line due to wind, etc. camera is still pointed with flight line
Radial Displacement: objects appear to be leaning away from focal point, especially taller objects
Relief Displacement:
if surface isn’t flat, photo scale will not be uniform
objects above nadir elevation displaced outward
objects below nadir elevation displaced inward!
distance between where object appears in photo and where it is on the ground
Vertical Exaggeration:
type of relief displacement
worse as flying height gets lower
stretches image vertically
Measuring Height in Air Photos:
Shadow Length:
if we know solar altitude angle at time of image
h = I (shadow length) * tan(a) (solar altitude angle)
Displacement:
h = altitude * displacement / distance between object and principal point
Image Correction:
DN = Digital Number
Radiometric Correction: corrects for distortion related to EMR: atmospheric effects, sensor noise, etc
Geometric Correction: corrects for spatial distortions, aligning image to a map or coordinate grid
How To Tell Which Is Needed:
Geometric Preprocessing:
3 Conceptual Approaches
Georectification (concept, method):
Orthorectification (concept, method):
Statistics For Digital Data:
Histograms:
What are they?
figures that tell you the frequency of each value in a data set
Why do we use them?
can tell you the frequency of pixel values in an image, across bands - show you the darkness/lightness of an image
Look Up Tables:
What are they?
What is interpolation?
Important Statistics:
Max: highest value
Min: lowest value
Mean: average value
Standard Dev: square root of the average of squares of deviations about mean of dataset — tells you how much variation there is from the mean
Enhancement Techniques:
Image correction vs enhancement:
Correction:
Fix imperfections
remove sensor error, atmospheric correction, geometric (spatial) corrections
Enhancement:
Enhance contrast, make information clearer
spatial, spectral, temporal
Types of Stretches:
Linear: new minimum and maximum applied to the data, old intermediate values scaled proportionally to new values. distribute clustered values further.
Linear 2%: trims lowest and highest 2% from histogram
Linear 5% (aka saturation linear): trims lowest and highest 5%
Preconcieved Notion Stretches:
Gaussian: outputs normal distribution, bell curve. enhances contrast by distributing pixels more evenly. mean set to 128, 66% of data within ± stand dev, at 86 and 170
Histogram Equalization: 10% of histogram within 0 - 25.5, etc, divided into 10% bins from 0 to 255.
Piece-Wise: analyst chooses breakpoints, sets segments of histogram to chosen values. can be used to deal with difficult characteristics, match images for display purposes.
Bit Depth: more bits, more gradient between black and white
Density Slicing: dividing band into intervals, assigning each interval a color, applying to original image - emphasizes features. creates crude classification.
Threshholding: density slicing with one cutoff point - all above x is black, all below white, etc. single threshhold.
Color Mapping: color density slicing. ie, DN 10 - 85 = red, DN 85 - 255 = blue. more crude classification
Masking: remove information from image by setting portions of image to 0 or 1, etc. can mask water, clouds, out of image to focus on other features. removes variance in selected portions, making them uniform.
Building:
Applying:
Image Transforms - Band Arithmetic:
What are they? perform mathematical operations on bands
Why do we use them? enhance particular features, remove radiometric distortion, reduce illumination effects from topography
Applications:
Addition: reduce noise, increase signal to noise ratio. normalization, averaging, smoothing.
Subtraction: change detection - before/after events
Division: image ratios! depict dominance of certain features
Vegetation Indices:
What are they?
What is the theory behind them?
Why do they work so well?
Common Slope-Based Indices:
Simple Ratio: Red/Nir or Nir/Red (mostly)
NDVI: nir - red/nir + red
Applications, examples of uses
Compare/contrast with other transforms, indices
Why are so many vegetation indices available?
Kauth-Thomas Tasseled Cap Transform:
Orthogonal Transforms:
Theoretical explanation, migration of pixel through growing season:
Brightness (relative components, intepretation, for all):
Greenness:
Wetness:
What it can tell you, why it’s used:
Compare to NDVI and vegetation indices:
Classification:
Classification: assigns labels to pixels, or, a semi-automated method to categorize data into specific classes or themes
Pattern Recognition:
Spatial: who are the pixels in your neigborhood? group pixels by their proximity in shapes like rectangles (buildings, fields).
Examples:
Spectral: where pixels fall on scatter plots comparing bands; finding pixels with similar spectral signatures in the same bands and grouping them. ie, green vegetation will have low red and high NIR
Finds the mean spectral signatures across classes, then determines key spectral bands to use for classifcation
Examples: vegetation high in NIR, low in red. water low in both. soil and human activity high in both, soil higher in red.
Temporal: compare spectral signatures across readings from multiple times - multitemporal
Examples: find when different crops ripen - distinguish crop cover by comparing signals at time when one has ripe signals and another doesn’t
Classification Steps:
Preprocessing:
What is it? correcting, enhancing, transforming initial image
Common types:
Choose classification scheme: could be ecology-based (many vegetation classes, one class for non-vegetated) or urban-oriented (classify residential vs commercial, high-density vs low-density)
Collect in situ data:
Ancillary data sources: other maps, field data, etc
Image Correction: correct for distortions, atmospheric interference
Image Enhancements: improve contrast, visual interpretation
Image Transforms (as necessary):
Thematic Classification:
Definition:
Continuous: each pixel is an individual, not homogenous with its neighbors
Discrete: pixels divided into specific classes, values
Purpose of classification:
First Steps:
Goal:
Class Scheme:
Imagery:
Ancillary Data:
Types of Classification Schemes:
Land Use vs Land Cover: FUNCTION vs PHYSICAL ATTRIBUTES
Unsupervised Classification:
Method:
data aggregated into clusters
analyst labels clusters
Advantages: good for finding patterns in the data, doesn’t require knowledge of the image initially
Disadvantages: algorithm has no intent, can’t focus on a desired subject. requires interpretation after processing
Supervised Classification:
Method:
analyst provides examples of classes - training samples
each pixel of the full image is compared to the training samples and labeled based on similarity
Advantages: more focused on analyst’s goal
Disadvantages: based on prior knowledge, requires image interpretation at beginning
Spectral Classes: groups of pixels sharing similar spectral properties
Thematic Classes: classes determined by analyst, like forest, grassland
Training Samples: examples of thematic classes given by analyst to train supervised classification algorithm
Generalization:
Types of Response Patterns or Spectral Signatures:
Why Are These Important:
Unsupervised Classification:
k-means algorithm:
analyst chooses number of clusters
arbitrary points are chosen
pixels are assigned to two classes
mean is calculated for each group
initial classes are reassigned to the means of each group
all pixels are reassessed for how they compare to the new means
pixels assigned to new groups
repeats until means stop moving.
euclidean distance algo:
clusters vs classes: clusters are the groupings produced by unsupervised classification, while classes are what the analyst wants as their output - clusters will be refined inti classes
Interpretation:
mixed clusters: grouping of pixels containing 2 or more thematic classes
problem resolution: rerun, allowing for more clusters
mask out problems
constrain classificstion to small area
hierarchical unsupervised classification:
(masking out some classes and rerunning classifier)
masks out some classses and reruns classifier to get more clusters in the same area
ex: deermine forest class, then mask out, rerun, tog et more detailed classification of non-forest areas
Supervised Classification:
supervised classification algorithms:
min. distance to means
no unclassified pixels, runs fast
maximum likelihood classifier:
no decision boundaries
probability of pixel’s class calculated, assigned to class with highest
assumes class samples are normally distributed
most accurate, most widely used
computarially intense
relies on normal distribution
statistical techniques:
probability:
finds means, variance, covariance of training data
assumes class samples are normally distributed
computes probabilities for each pixel
decision rules: pixels classified by comparing pixel value to upper and lower limits such as: min, max for each band, the mean ± std. dev, or user-defined boundaries
minimum distance to means: calculates spectral distance between a pixel and the mean for each class, assign to class with lowest distance
Sensors and Data Types
Introduction to Digital Imagery
Platforms
Satellites:
Smallsats:
Aircraft:
UAVs:
Ground Networks:
Air Photos:
Advantages: closer to subject, control over flight path
Disadvantages: can be dangerous and time-consuming to cover areas, plan and enact missions
Satellite Images:
Advantages: consistent return time, always updating
Disadvantages: expensive to send up and repair, expensive to fix
Orbits (characteristics, altitudes):
Geosynchronous: match earth’s rotation, same spot. good for weather data. ex: communications satellites
Near-Polar: satellites cross both polar regions during orbit. cross at 10 and 3 for good useful shadows. low earth orbit.
Scanners:
Pushbroom (along-track):
Whiskbroom (cross-track)
Spectral Sensitivity:
Signal-to-Noise Ratio:
Digital Data:
Binary: represents data using 2 symbols, 0 and 1. one byte = 8 bits (0s and 1s)
ASCII: integers
Bits: 0, 1 in binary
Bytes: 8 bit strings
Data Storage Formats: (raster!) used to store data of multiple bands
Bip: band interleaved by pixel - each corresponding pixel from each band is written together. each value for pixel 1, then 2, then 3, etc
Bil: band interleaved by line - writes each band’s value side by side in row 1, row 2, etc
Bsq: band sequential - stores info one band at a time. all band 1, then all band 2.
Data Compression: reduces amount of data needed to store info by exploiting redundancies: if values or patterns are repeated in sequence, they can be reduced to a shorthand that can be decompressed later.
Types of Resolution:
Telemetry: the process of recording and transmitting the readings of an instrument
Spatial: measure of the smallest separation of two objects that can be identified
Instantaneous Field of View (IFOV): the ground covered by the angle through which sensor is sensitive to radiation
Mixed Pixels: pixels containing multiple ground covers
Spatial Resolution vs Swath Width: better resolution (each pixel represents a smaller area on the ground) means a narrower swath width
Spectral:
3 Components:
Bandwidth: range of wavelengths where a sensor is sensitive
Number of Bands:
Location of Bands: in the EM spectrum
Signal to Noise Ratio: image quality vs sensor quality - useful signal vs background noise
Panchromatic: single band spanning visible or false-color spectrum
Multispectral: More than 3 bands
Hyperspectral: Up to hundreds of bands - more detail, specfic analysis, distinction between closely related materials
Temporal: frequency of image collection for area
Factors affecting temporal resolutiom: altitude, orbit type, swath width, cloud/smoke cover
temporal vs spatial resolution: large swath = move quickly
Multitemporal vs Hypertemporal:
Multitemporal: more than 3 images over time
Hypertemporal: many images over time
Radiometric: sensitivity of sensor to detecting differences in signal strength, smallest brightness value
Characteristics: better = more bits, more gradient between white and black
Importance:
Resolution trade-offs, ways to overcome these limitations:
spatial vs temporal
spatial vs swath width
high spectral resolution limits swath size
launch multiple identical satellites to make up for low temporal resolution!
Available Data:
Applications of Remote Sensing
Urban, Industrial Applications
Observe traffic patterns, bottlenecks, hubs of activity
Chart urban growth and human migration
Track industrial spills and pollutants
Survey natural resources for industrial use
Disaster response - find areas of change, areas with worst damage
Urban Planning
Survey land cover, land elevation, moisture, for suitable building grounds
areas that would need to be drained, leveled, etc
Track population activity - where are more roads needed, where do most people live, eat, work, etc
Agricultural Monitoring, Mapping, Etc, Crop Type Mapping
Monitor crop health and maturity, ripeness
Distinguish between crop types
Forest Transitions
Track deforestation over time, new growth vs old growth, forest fire damage and movement, different species
Deforestation
chimpanzee habitats, eg
Land Use and Land Cover
Land use: what is being done with the land - human activity. Farming, nature preserve, city, factory, etc
Land Cover: physical features of the land, regardless of intent. Concrete, grassland, snow, water