🙀AP BIO Chapter 40 - Population Ecology and the Distribution of Organisms
Overview
40.1 Earth’s climate influences the distribution of terrestrial biomes
40.2 Aquatic biomes are diverse and dynamic systems that cover most of Earth
40.3 Interactions between organisms and the environment limit the distribution of species
40.4 Biotic and abiotic factors affect population density, dispersion, and demographics
40.5 The exponential and logistic models describe the growth of populations
40.6 Population dynamics are influenced strongly by life history traits and population density
BIG IDEAS: Species extinction rates are higher in times of ecological stress (Big Idea 1), with more risk to those populations with little genetic diversity that face decreases in the availability of free energy (Big Idea 2). Mathematical and computer models are used to study population dynamics and the vulnerabilities of at-risk species (Big Idea 4)
{{Ecology:{{
The study of how organisms interact with each other and their environment
Exploring the Scope of Ecological Research
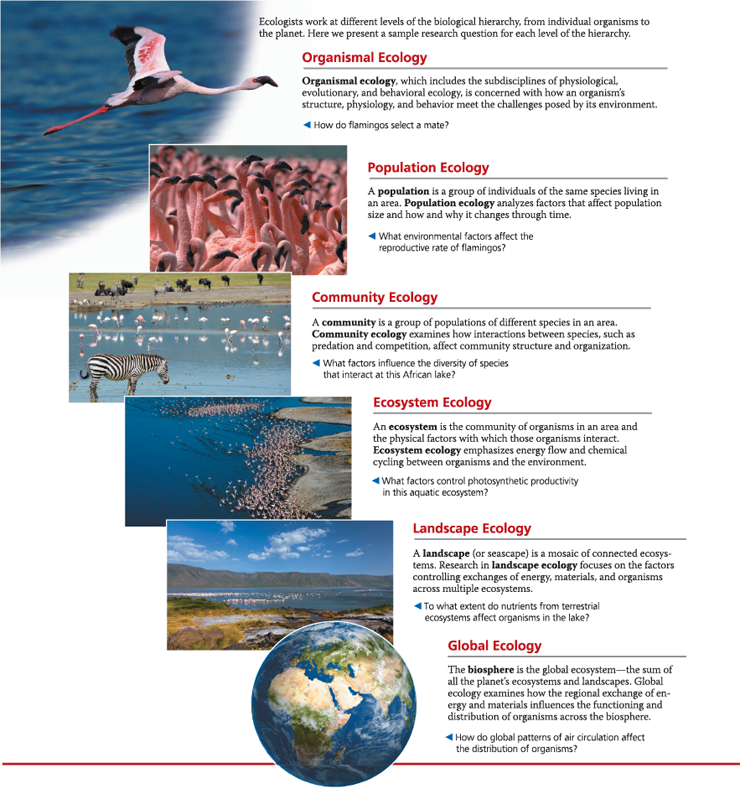
How does Earth’s climate and other factors determine the location of major life zones on land and in the ocean?
Different areas having different climates, and different species are best suited for specific temperatures and precipitation levels
What controls the distribution of species and the density and size of populations?
Food, water, shelter, resources, predation, temperature, water, oxygen, salinity, sun, rocks, and soil control population size and density. For example, otters are predators of sea urchins. High amounts of otters affect the sea urchin population and indirectly increase kelp (which sea urchins feed on) and fish (which can feed on the now larger amount of kelp) population sizes. If animals are territorial, the distribution will be unfirm. If resources are in a specific area, the distribution will be clumped. When organisms in a population aren’t reliant on each other/resources are constant, the distribution is random.
How are the words community, ecosystem, and global ecology related?
Communities can interact with each other in an ecosystem and compiled ecosystems make a landscape which have global impacts
How can the global consequences of human activities be predicted and how can biodiversity be conserved?
Human activities can destroy land that holds many organisms. For example, wetlands are very diverse, so for wetlands that are destroyed new ones should be made in place. Some areas are preserved by human destruction, however. Fields may be burned by lightning or by hand which gets rid of trees and shrubs. This burning there preserves the fields and its unique organisms at the expense of other organisms.
%%40.1 - Earth’s climate influences the distribution of terrestrial biomes%%
Global climate patterns are largely determined by the input of solar energy and Earth’s revolution around the sun
The changing angle of the sun over the year, bodies of water, and mountains exert seasonal, regional, and local effects on climate
Climographs show that temperature and precipitation are correlated with biomes. Other factors also affect biome location
Terrestrial biomes are often named for major physical or climatic factors and for their predominant vegetation. Vertical layering is an important feature of terrestrial biomes
{{Climate:{{
The long-term prevailing weather conditions at a given place
List four physical factors of climate
temperature, precipitation, sunlight, and wind
{{Abiotic:{{
Nonliving; referring to the physical and chemical properties of an environment
{{Biotic:{{
Pertaining to the living factors—the organisms—in an environment
Exploring Global Climate Patterns
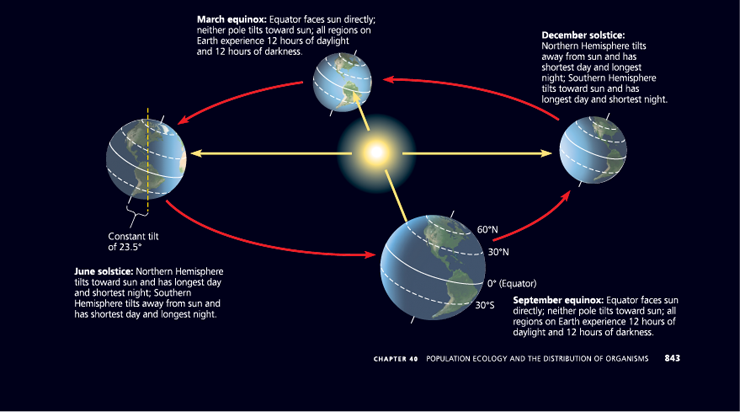
Seasonal variation in sunlight intensity - Because Earth is tilted on its axis relative to its plane of orbit around the sun, the intensity of solar radiation varies seasonally. This variation is smallest in the tropics and increases toward the poles
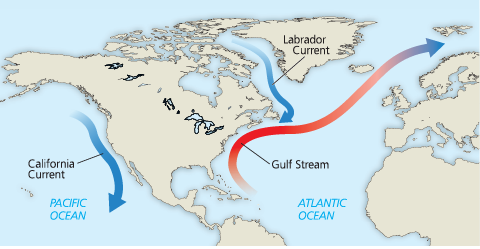
Ocean currents influence climate along the coasts of continents by ___ overlying air masses that pass across the land
heating or cooling
Circulation of surface water in the oceans around North America - The California Current carries cold water southward along the western coast of North America. Along the eastern coast, the Labrador Current carries cold water southward, and the Gulf Stream moves warm water toward northern Europe
Water has a (high/low) specific heat
high
When land is warmer than the water, air over the land heats up and rises, drawing a (cool/warm) breeze from the water across the land
cool
Because temperatures drop more quickly over land than over water at night, air over the now warmer water rises, drawing cooler air from the land back out over the water and replacing it with ___ air from offshore
warmer
How large bodies of water and mountains affect climate - This figure illustrates what can happen on a hot summer day
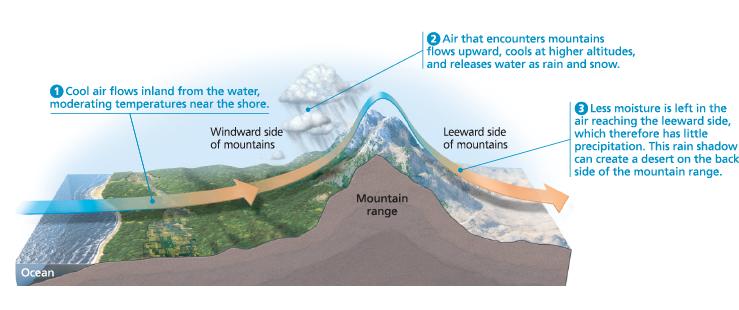
When warm, moist air approaches a mountain, the air expands and ___ as it rises, releasing moisture on the windward side of the peak
cools
How are rain shadows produced?
On the leeward side of mountains, cooler, dry air descends, absorbing moisture and producing a “rain shadow”
{{Rain Shadow:{{
A patch of land that has become a desert because mountain ranges block much of the rainfall necessary for plant growth
South-facing slopes in the Northern Hemisphere receive more sunlight than north-facing slopes and are therefore ___
warmer and drier
{{Biome:{{
Any of the world’s major ecosystem types, often classified according to the predominant vegetation for terrestrial biomes and the physical environment for aquatic biomes and characterized by adaptations of organisms to that particular environment
{{Climograph:{{
A plot of the temperature and precipitation in a particular region
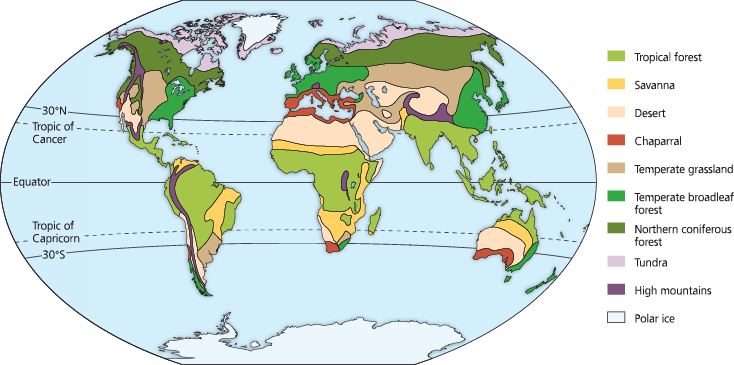
The distribution of major terrestrial biomes
A climograph for some major types of biomes in North America - The areas plotted here encompass the ranges of annual mean temperature and precipitation in the biomes
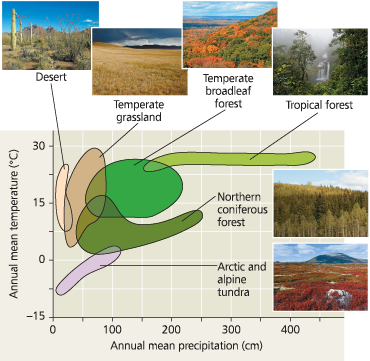
Climographs are based on __*, but the *** of climatic variation is often as important
annual averages; pattern
{{Disturbance:{{
A natural or human-caused event that changes a biological community and usually removes organisms from it. They play a pivotal role in structuring communities
List examples of a disturbance
A storm, fire, or human activity
{{Canopy:{{
The uppermost layer of vegetation in a terrestrial biome
{{Ecotone:{{
The transition from one type of habitat or ecosystem to another, such as the transition from a forest to a grassland
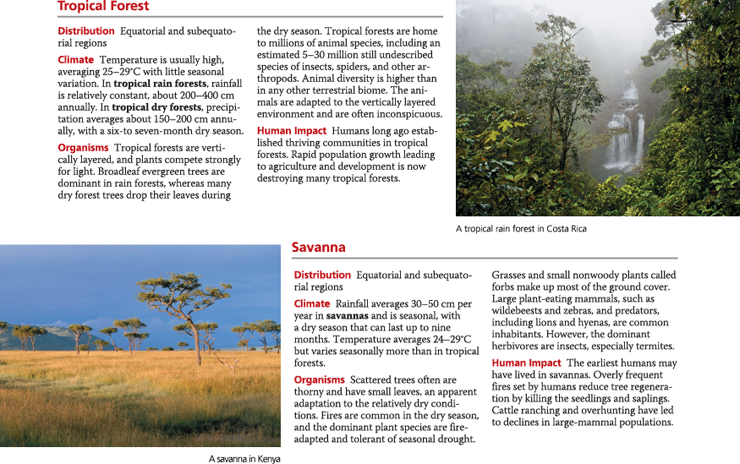
Exploring Terrestrial Biomes - Tropical Forest and Savanna
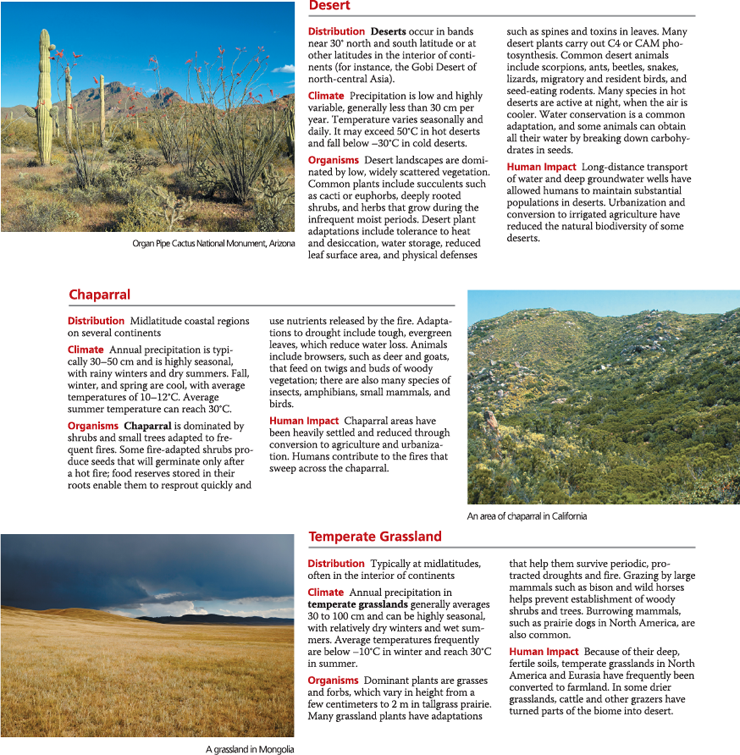
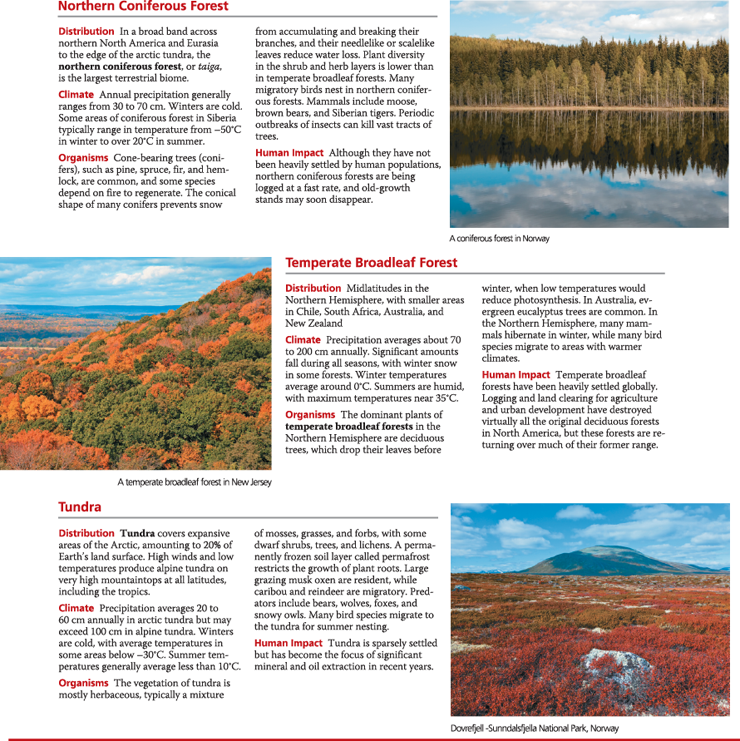
Exploring Terrestrial Biomes - Desert, Chaparral, and Temperate Grassland
Exploring Terrestrial Biomes - Northern Coniferous Forest, Temperate Broadleaf Forest, and Tundra
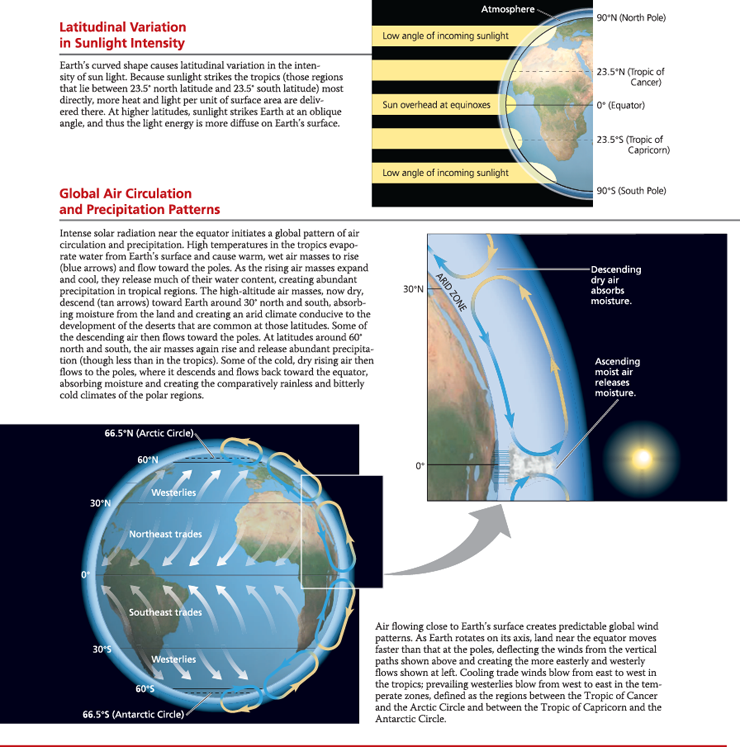
%%Explain how the sun’s unequal heating of Earth’s surface leads to the development of deserts around 30° north and south of the equator%%
In the tropics, high temperatures evaporate water and cause warm, moist air to rise. The rising air cools and releases much of its water as rain over the tropics. The remaining dry air descends at approximately 30° north and south, causing deserts to occur in those regions
%%Do abiotic and biotic characteristics reflect your actual surroundings?%%
How much your local area has been altered from its natural state will influence how much it reflects the expected characteristics of your biome, particularly the expected plants and animals
%%If global warming increases average temperatures on Earth by 4°C in this century, predict which biome is most likely to replace tundra in some locations as a result%%
Northern coniferous forest is likely to replace tundra along the boundary between these biomes. To see why, note that northern coniferous forest is adjacent to tundra throughout North America, northern Europe, and Asia (see Figure 40.7) and that the temperature range for northern coniferous forest is just above that for tundra
%%Suppose global air circulation suddenly reversed, with most air ascending at 30° north and south latitude and descending at the equator. At what latitude would you most likely find deserts?%%
Because dry air would descend at the equator instead of at 30° north and south latitude (where deserts exist today), deserts would be more likely to exist along the equator
%%40.2 - Aquatic biomes are diverse and dynamic systems that cover most of Earth%%
Aquatic biomes are characterized primarily by their physical environment rather than by climate and are often layered with regard to light penetration, temperature, and community structure
In the ocean and in most lakes, an abrupt temperature change called a thermocline separates a more uniformly warm upper layer from more uniformly cold deeper waters
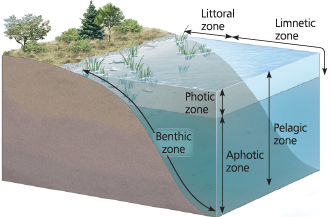
{{Photic Zone:{{
The narrow top layer of an ocean or lake, where light penetrates sufficiently for photosynthesis to occur
{{Aphotic Zone:{{
The part of an ocean or lake beneath the photic zone, where light does not penetrate sufficiently for photosynthesis to occur
{{Pelagic Zone:{{
The open-water component of aquatic biomes
{{Oceanic Pelagic Zone:{{
Most of the ocean’s waters far from shore, constantly mixed by ocean currents
{{Benthic Zone:{{
The bottom surface of an aquatic environment
{{Benthos:{{
The communities of organisms living in the benthic zone of an aquatic biome
{{Littoral Zone:{{
In a lake, the shallow, well-lit waters close to shore
{{Limnetic Zone:{{
In a lake, the well-lit, open surface waters far from shore
Zonation in a lake - A lake environment is generally classified on the basis of three physical criteria: light penetration (photic and aphotic zones), distance from shore and water depth (littoral and limnetic zones), and whether the environment is open water (pelagic zone) or bottom (benthic zone)
{{Thermocline:{{
A narrow stratum of abrupt temperature change in the ocean and in many temperate-zone lakes
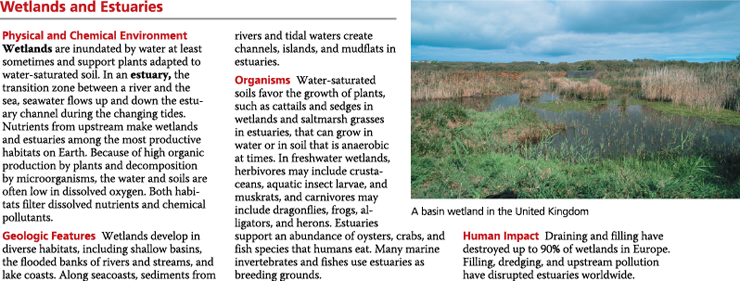
Exploring Aquatic Biomes - Wetlands and Estuaries
Exploring Aquatic Biomes - Lakes, Streams, Rivers, and Intertidal Zones
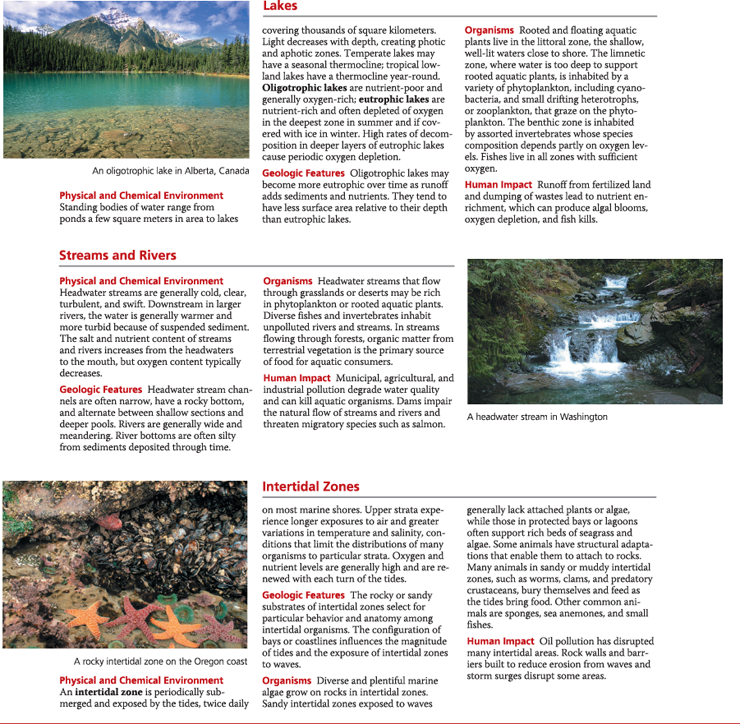
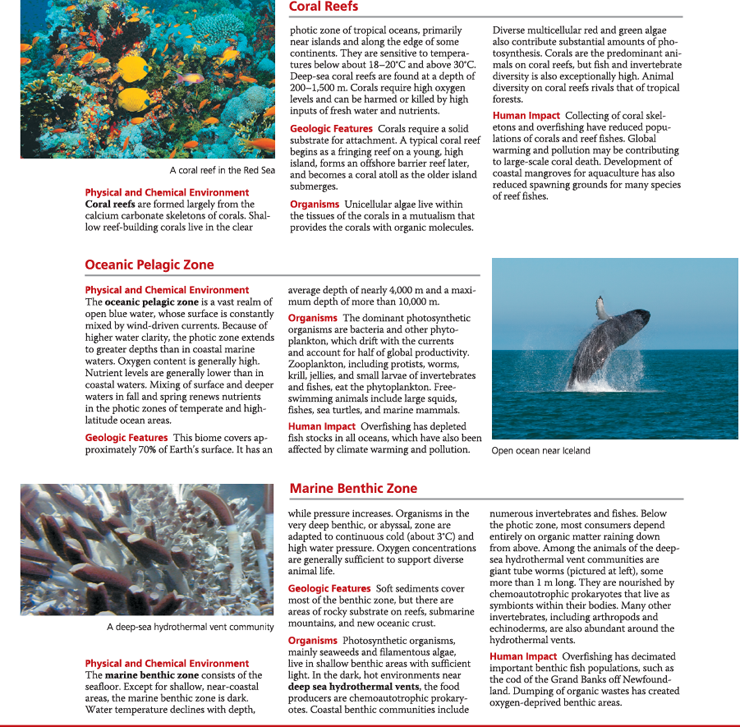
Exploring Aquatic Biomes - Coral Reefs, Oceanic Pelagic Zone, and Marine Benthic Zone
%%Why are phytoplankton, and not benthic algae or rooted aquatic plants, the dominant photosynthetic organisms of the oceanic pelagic zone?%%
In the oceanic pelagic zone, the ocean bottom lies below the photic zone, so there is too little light to support benthic algae or rooted plants
%%Many organisms living in estuaries experience both freshwater and saltwater conditions each day with the rising and falling of tides. Explain how these changing conditions challenge the survival of these organisms%%
Aquatic organisms either gain or lose water by osmosis if the osmolarity of their environment differs from their internal osmolarity. Water gain can cause cells to swell, and water loss can cause them to shrink. To avoid excessive changes in cell volume, organisms that live in estuaries must be able to compensate for both water gain (under freshwater conditions) and water loss (under saltwater conditions)
%%Water leaving a reservoir behind a dam is often taken from deep layers of the reservoir. Would you expect fish found in a river below a dam in summer to be species that prefer colder or warmer water than fish found in an undammed river?%%
In a river below a dam, the fish are more likely to be species that prefer colder water. In summer, the deep layers of a reservoir are colder than the surface layers, so a river below a dam will be colder than an undammed river
%%In which aquatic biomes might you find an aphotic zone?%%
An aphotic zone is most likely to be found in the deep waters of a lake, the oceanic pelagic zone, or the marine benthic zone
%%40.3 - Interactions between organisms and the environment limit the distribution of species%%
Ecologists want to know not only where species occur but also why those species occur where they do
The distribution of species may be limited by dispersal, biotic (living) factors, and abiotic (chemical and physical) factors, such as temperature extremes, salinity, and water availability
Explain how a kangaroo’s environment is limited
Nationally, they are only limited to Australia because kangaroo lineage originated there at a point in time when the continent was geographically isolated. Within Australia, they are restricted to only some habitats. The red kangaroo, for example, occurs in the arid grasslands of central Australia, but not in the tall, open forests of eastern Australia. Such observations can lead us to ask whether food availability, predators, temperature, or other factors cause red kangaroos to be found in some regions but not others
What questions do ecologists ask
Where do species occur, and why there
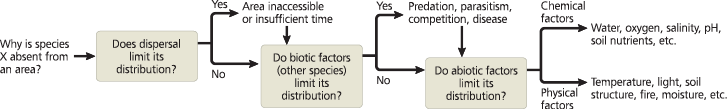
Flowchart of factors limiting geographic distribution - An ecologist studying factors limiting a species’ distribution might consider questions like these. As suggested by the arrows leading from the “yes” responses, the ecologist would answer all of these questions because more than one of these factors can limit a species’ distribution
%%How might the importance of various abiotic factors differ for aquatic and terrestrial ecosystems?%%
Some factors, such as fire, are relevant only for terrestrial systems. At first glance, water availability is primarily a terrestrial factor, too. However, species living along the intertidal zone of oceans or along the edge of lakes also suffer desiccation (drying out). Salinity stress is important for species in some aquatic and terrestrial systems. Oxygen availability is an important factor primarily for species in some aquatic systems and in soils and sediments
{{Dispersal:{{
The movement of individuals or gametes away from their parent location. This movement sometimes expands the geographic range of a population or species
How do ecologists determine potential and actual range?
Ecologists observe the transplant of a species to where it was absent. If some of the organisms must not only survive in the new area but also reproduce there sustainably. If a transplant is successful, then we can conclude that the potential range of the species is larger than its actual range; in other words, the species could live in certain areas where it currently does not
Do ecologists intentionally transplant species, or do they observe ‘accidental’ transplants?
Species introduced to new geographic locations can disrupt the communities and ecosystems to which they have been introduced. Consequently, ecologists rarely move species to new geographic regions. Instead, they document the outcome when a species has been transplanted for other purposes, as when a predator is introduced to control a pest species, or when a species has been moved to a new region accidentally
How do biotic factors (other species) limit the distribution of a species?
Often, the ability of a species to survive and reproduce is reduced by its interactions with other species, such as predators (organisms that kill their prey) or herbivores (organisms that eat plants or algae)
W. J. Fletcher, of the University of Sydney, Australia, reasoned that if sea urchins are a limiting biotic factor in a particular ecosystem, then more seaweeds should invade an area from which sea urchins have been removed. To isolate the effect of sea urchins from that of a seaweed-eating mollusc, the limpet, he removed only urchins, only limpets, or both from study areas adjacent to a control site
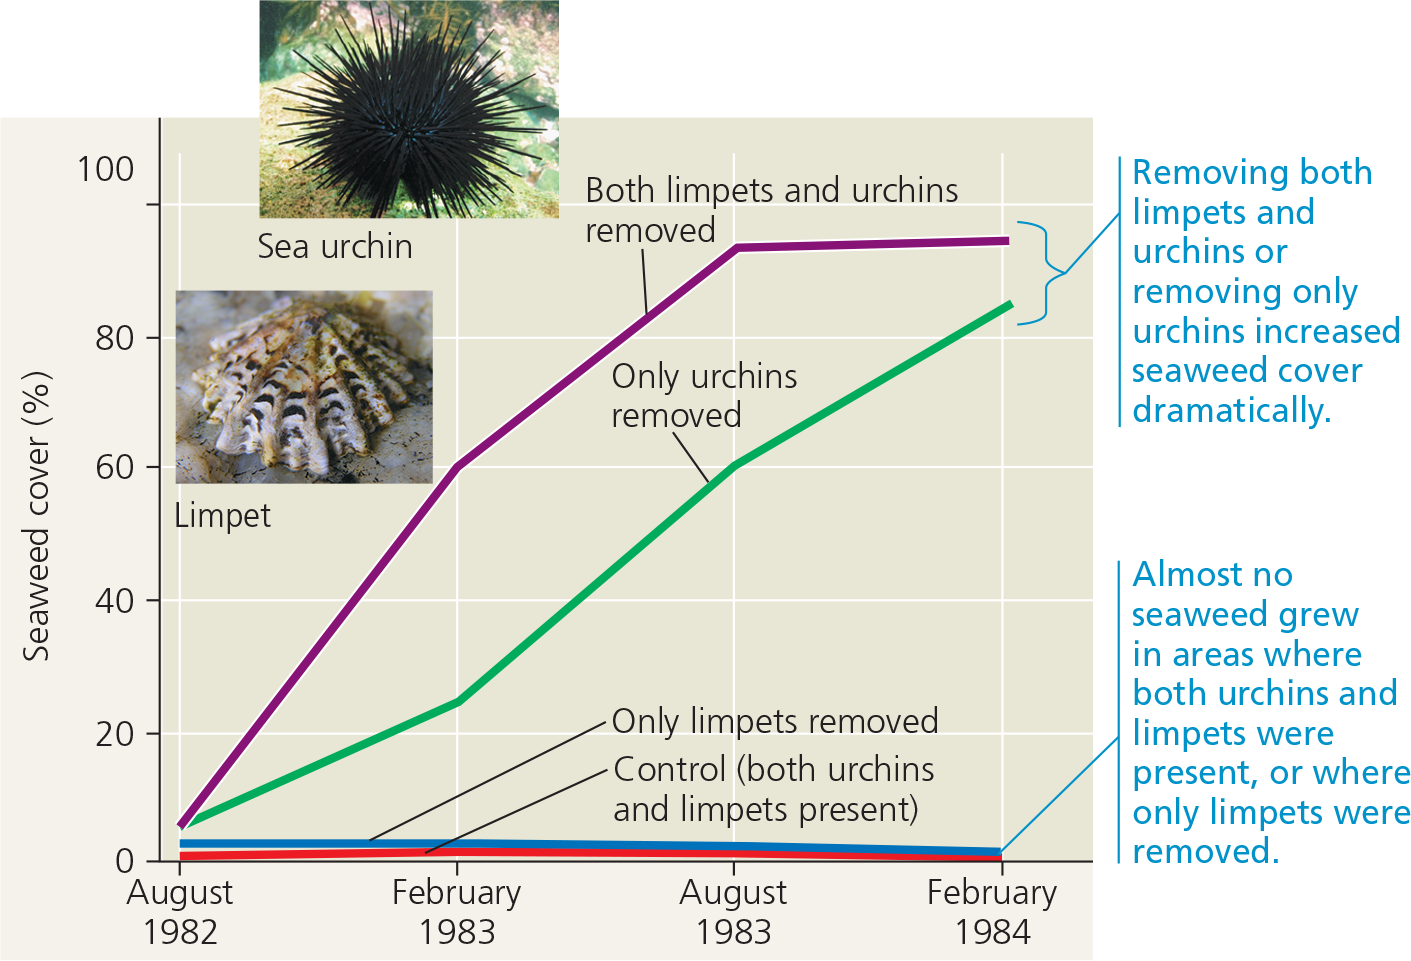
Removing both limpets and urchins resulted in the greatest increase in seaweed cover, indicating that both species have some influence on seaweed distribution. But since removing only urchins greatly increased seaweed growth whereas removing only limpets had little effect, Fletcher concluded that sea urchins have a much greater effect than limpets in limiting seaweed distribution
List abiotic factors that may limit a species’ distribution
Temperature, water, oxygen, salinity, sunlight, rocks and soil
Environmental temperature is an important factor in the distribution of organisms because of its effect on biological processes. Cells may ____ if the water they contain freezes (at temperatures below 0°C), and the proteins of most organisms _ at temperatures above 45°C. Most organisms function best within a (specific or broad) range of environmental temperature
rupture; denature; specific
Species living at the seashore or in tidal wetlands can ___ as the tide recedes
desiccate (dry out)
Oxygen diffuses (slowly/quickly) in water which can limit cellular respiration and other processes
slowly
Most aquatic organisms are restricted to either freshwater or saltwater habitats by their limited ability to ___
osmoregulate
Lack of sunlight can limit the distribution of ___ species
photosynthetic
In a river, the composition of rocks and soil that make up the substrate (riverbed) can affect ___
water chemistry
Describe how pH in soil affects environments
The pH of soil can limit the distribution of organisms directly, through extreme acidic or basic conditions, or indirectly, by affecting the solubility of nutrients and toxins
%%Give examples of human actions that could expand a species’ distribution by changing its (a) dispersal or (b) biotic interactions%%
(a) Humans might transplant a species to a new area that it could not previously reach because of a geographic barrier. (b) Humans might eliminate a predator or herbivore species, such as sea urchins, from an area
%%You suspect that deer are restricting the distribution of a tree species by preferentially eating the seedlings of the tree. How might you test this hypothesis?%%
One test would be to build a fence around a plot of land in an area that has trees of that species, excluding all deer from the plot. You could then compare the abundance of tree seedlings inside and outside the fenced plot over time
%%If you were an ecologist studying the chemical and physical limits to the distributions of species, how might you rearrange the flowchart in Figure 40.12?%%
You might arrange a flowchart that begins with abiotic limitations—first determining the physical and chemical conditions under which a species could survive—and then moves through the other factors listed in the flowchart
%%40.4 - Biotic and abiotic factors affect population density, dispersion, and demographics%%
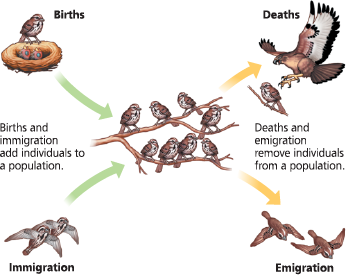
Population density—the number of individuals per unit area or volume—reflects the interplay of births, deaths, immigration, and emigration. Environmental and social factors influence the dispersion of individuals
Populations increase from births and immigration and decrease from deaths and emigration. Life tables and survivorship curves summarize specific trends in demography
What do biotic and abiotic features impact within a population?
Density, distribution, and the size
What factors can lead to more interactions between populations?
When members of a population rely on the same resources and are influenced by a similar environment
{{Density:{{
The number of individuals per unit area or volume
Density is a (static/changing) property
changing
{{Immigration:{{
The influx of new individuals into a population from other areas
{{Emigration:{{
The movement of individuals out of a population
Population Dynamics
{{Dispersion:{{
The pattern of spacing among individuals within the boundaries of a population
{{Clumped Dispersion:{{
The most common pattern; individuals are aggregated in patches
What leads to clumped dispersion?
Having similar ideal conditions, mating behaviors, or having defense
Patterns of dispersion within a population’s geographic range
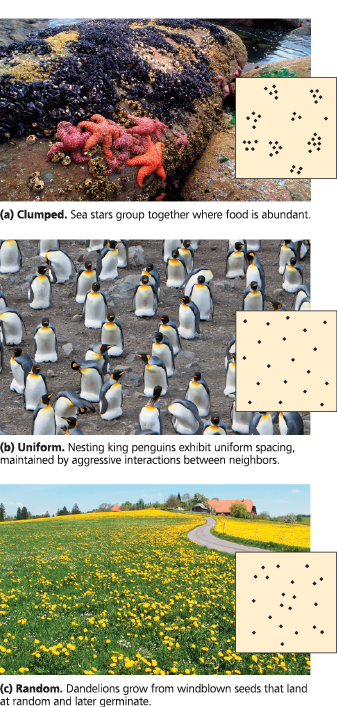
{{Territoriality:{{
A behavior in which an animal defends a bounded physical space against encroachment by other individuals, usually of its own species
{{Uniform Dispersion:{{
An evenly spaced pattern
{{Random Dispersion:{{
Unpredictable spacing
{{Demography:{{
The study of changes over time in the vital statistics of populations, especially birth rates and death rates
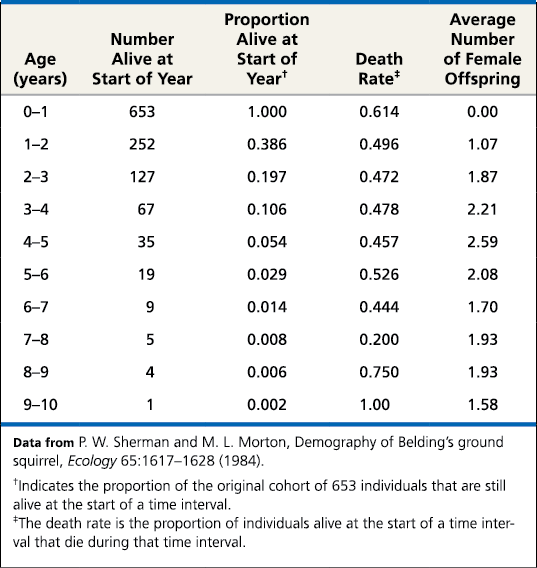
{{Life Table:{{
A summary of the age-specific survival and reproductive rates of individuals in a population
{{Cohort:{{
A group of individuals of the same age in a population
Life Table for Female Belding’s Ground Squirrels (Tioga Pass, in the Sierra Nevada of California)
{{Survivorship Curve:{{
A plot of the number of members of a cohort that are still alive at each age; one way to represent age-specific mortality
Idealized survivorship curves - The y-axis is logarithmic and the x-axis is on a relative scale so that species with widely varying life spans can be presented together on the same graph
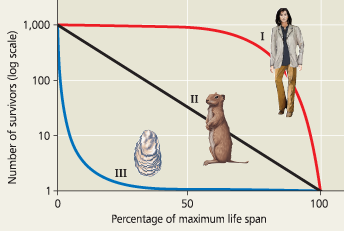
Describe Type I curves
They are flat at the start, reflecting low death rates during early and middle life, and then drops steeply as death rates increase among older age-groups (common when few offspring are reproduced, but they are taken care of well - mammals, humans)
Describe Type III curves
They drop sharply at the start, reflecting very high death rates for the young, but flattens out as death rates decline for those few individuals that survive the early period of die-off (common with multiple offspring with little care - long-lived plants, fish, marine invertebrate)
Describe Type II curves
There is a constant death rate/life span; death is just as likely at any age (common in rodents, squirrels, invertebrates, lizards, and annual plants)
Demographers often ignore the males and concentrate on the females in a population because only females ___
produce offspring
%%Each female of a particular fish species produces millions of eggs per year. Which curve is likely?%%
A Type III curve is most likely because very few of the young probably survive
%%Imagine that you are constructing a life table for a different population of Belding’s ground squirrels (see Table 40.1). If 485 individuals are alive at the start of year 0–1 and 218 are still alive at the start of year 1–2, what is the proportion alive at the start of each of these years (see column 3 in Table 40.1)%%
The proportion alive at the start of year 0–1 is 485/485 = 1.0. The proportion alive at the start of year 1–2 is 218/485 = 0.449
%%A male stickleback fish attacks other males that invade its nesting territory (see Figure 39.16). Predict the likely pattern of dispersion for male sticklebacks, and explain your reasoning%%
Male sticklebacks would likely have a uniform pattern of dispersion, with antagonistic interactions maintaining a relatively constant spacing between them
%%Gray whales (Eschrichtius robustus) gather each winter near Baja California to give birth. How might such behavior make it easier for ecologists to estimate birth and death rates for the species*?*%%
Ecologists can potentially estimate birth rates by counting the number of young whales born each year, and they can estimate death rates by seeing how the number of adults changes each year
%%40.5 - The exponential and logistic models describe the growth of populations%%
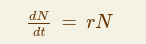
If immigration and emigration are ignored, a population’s growth rate (the per capita rate of increase) equals its birth rate minus its death rate
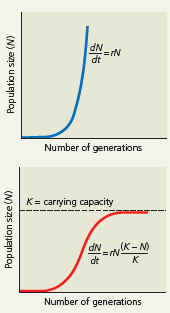
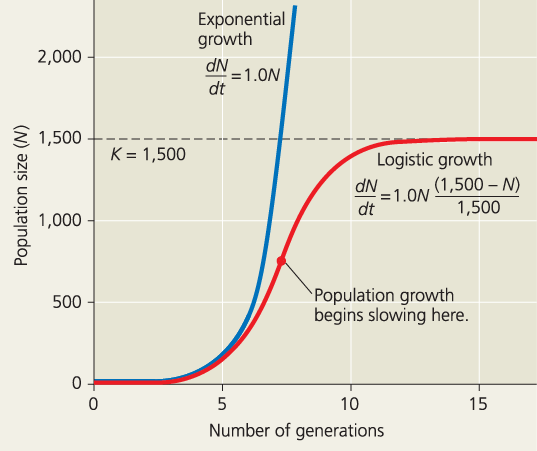
The exponential population growth equation dN/dt = rN represents a population’s growth when resources are relatively abundant, where r is the (per capita) intrinsic rate of increase and N is the number of individuals in the population
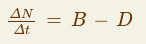
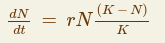
Exponential growth cannot be sustained for long in any population. A more realistic population model limits growth by incorporating carrying capacity (K), the maximum population size the environment can support. According to the logistic population growth equation dN/dt = rN (K – N )/K, growth levels off as population size approaches the carrying capacity
The logistic model fits few real populations perfectly, but it is useful for estimating possible growth
What is the verbal equation for change in population size?
Births - deaths + immigration - emigration
What’s the formula for change in population? (R = B-D)

{{Exponential Population Growth:{{
Growth of a population in an ideal, unlimited environment, represented by a J-shaped curve when population size is plotted over time
What’s the formula for exponential growth?
{{Intrinsic Rate of Increase:{{
In population models, the per capita rate at which an exponentially growing population increases in size at each instant in time
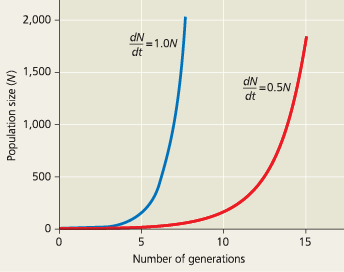
Population growth predicted by the exponential model
{{Carrying Capacity:{{
The maximum population size that can be supported by the available resources, symbolized as K
What factors can limit carrying capacity
Energy, shelter, refuge from predators, nutrient availability, water, and suitable nesting sites
{{Logistic Population Growth:{{
Population growth that levels off as population size approaches carrying capacity
What is the formula for logistic growth?
Population growth predicted by the logistic model
%%Explain why a constant rate of increase (r) for a population produces a growth curve that is J-shaped%%
Though r is constant, N, the population size, is increasing. As r is applied to an increasingly large N, population growth (rN) accelerates, producing the J-shaped curve
%%Explain why a population that fits the logistic growth model increases more rapidly at intermediate size than at relatively small and large sizes%%
When N (population size) is small, there are relatively few individuals producing offspring. When N is large, near the carrying capacity, the per capita growth rate is relatively small because it is limited by available resources. The steepest part of the logistic growth curve corresponds to a population with a number of reproducing individuals that is substantial but not yet near carrying capacity
%%Many viruses are pathogens of animals and plants. How might the presence of pathogens alter the carrying capacity of a population?%%
If a population becomes too crowded, the likelihood of disease and mortality may increase because of the effects of pathogens. Thus, pathogens can reduce the long-term carrying capacity of a population
%%As an ecologist who manages a wildlife preserve, you want to increase the preserve’s carrying capacity for a particular endangered species. How might you go about accomplishing this?%%
There are many things you can do to increase the carrying capacity of the species, including increasing its food supply, protecting it from predators, and providing more sites for nesting or reproduction
%%40.6 - Population dynamics are influenced strongly by life history traits and population density%%
Life history traits are evolutionary outcomes reflected in the development, physiology, and behavior of organisms
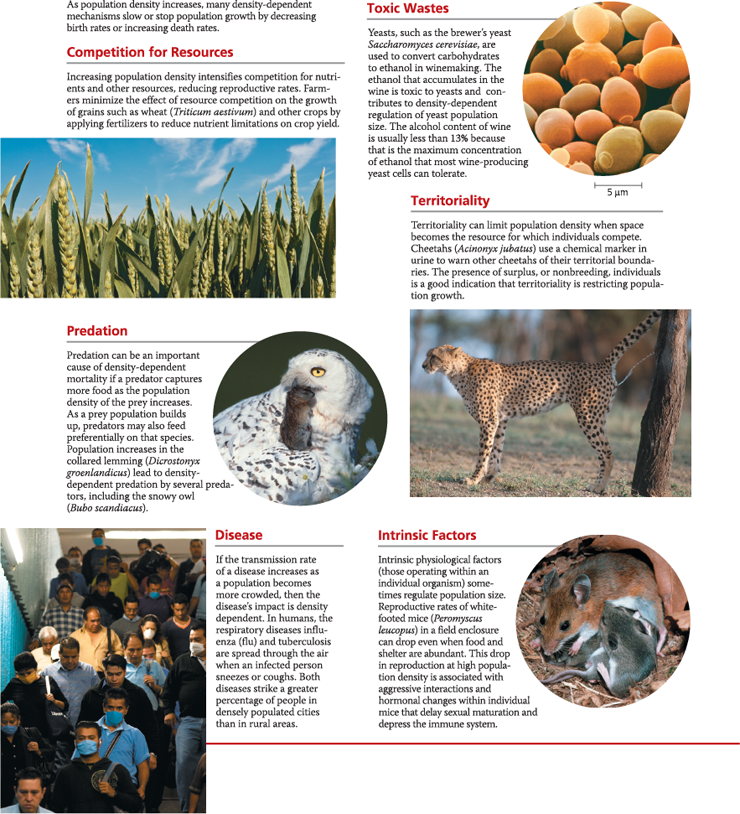
Density-dependent changes in birth and death rates curb population increase through negative feedback and can eventually stabilize a population near its carrying capacity. Density-dependent limiting factors include intraspecific competition for limited food or space, increased predation, disease, intrinsic physiological factors, and buildup of toxic substances
All populations exhibit some size fluctuations, and many undergo substantial changes in size that are influenced by complex interactions between biotic and abiotic factors. A metapopulation is a group of populations linked by immigration and emigration
{{Life History:{{
The traits that affect an organism’s schedule of reproduction and survival
What three traits makeup life history?
The age of reproductive maturity, how often reproduction happens, and how many offspring are produced each episode
Describe the trade-offs between survival and reproductive traits
No organism could produce unlimited numbers of offspring and provision them well. For instance, researchers in Scotland found that female red deer that reproduced in a given summer were more likely to die the next winter than were females that did not reproduce
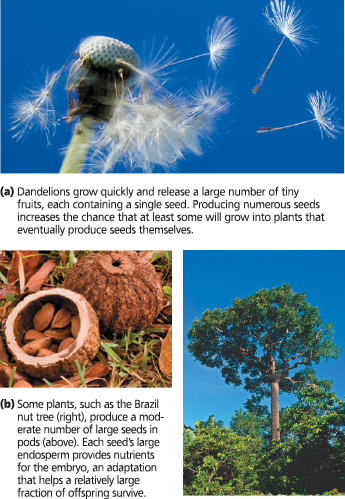
Variation in the number and size of seeds in plants
{{K-Selection:{{
Selection for life history traits that are sensitive to population density; also called density-dependent selection
{{r-Selection:{{
Selection for life history traits that maximize reproductive success in uncrowded environments; also called density-independent selection
{{Density Independent:{{
Referring to any characteristic that is not affected by population density
{{Density Dependent:{{
Referring to any characteristic that varies with population density
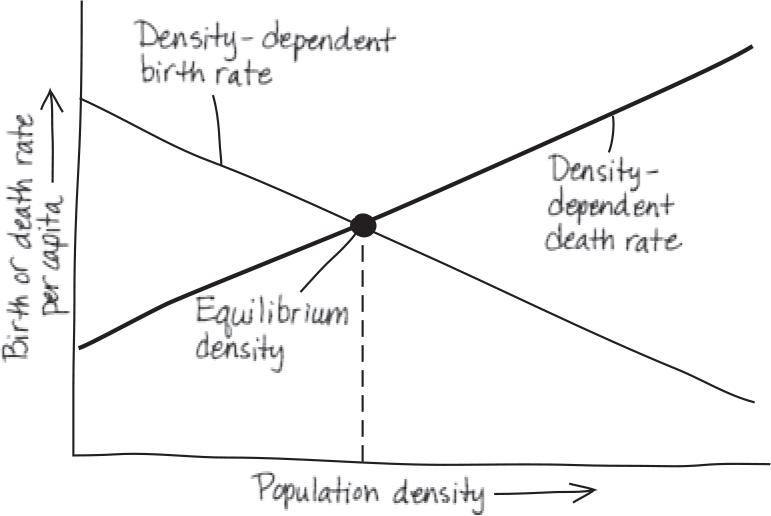
Determining equilibrium for population density - This simple model considers only birth and death rates. (Immigration and emigration rates are assumed to be either zero or equal.) In this example, the birth rate changes with population density, while the death rate is constant. At the equilibrium density (Q), the birth and death rates are equal
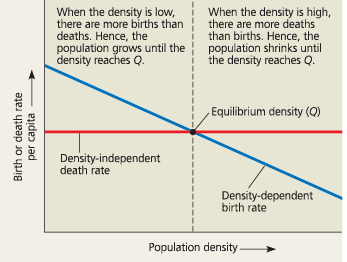
%%Redraw this figure for the case where the birth and death rates are both density-dependent, as occurs for many species%%
List density-dependant factors
Competition, resources, toxic wastes, predation, territoriality, disease, and intrinsic factors
Exploring Mechanisms of Density-Dependent Regulation
{{Population Dynamics:{{
The study of how complex interactions between biotic and abiotic factors influence variations in population size
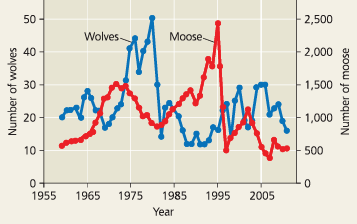
List two sets of animals that are “built to be against each other”
Wolves vs deer, lynx vs hare
Fluctuations in moose and wolf populations on Isle Royale, 1959–2011
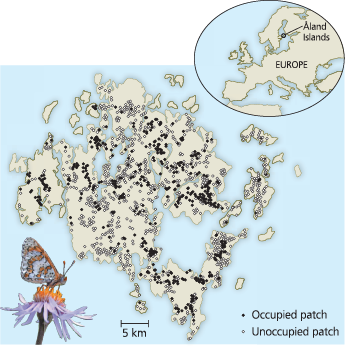
{{Metapopulation:{{
A group of spatially separated populations of one species that interact through immigration and emigration
The Glanville fritillary: a metapopulation - On the Åland Islands, local populations of this butterfly (filled circles) are found in only a fraction of the suitable habitat patches (open circles) at any given time. Individuals can move between local populations and colonize unoccupied patches
%%In the fish called the peacock wrasse (Symphodus tinca), females disperse some of their eggs widely and lay other eggs in a nest. Only the latter receive parental care. Explain the trade-offs in reproduction that this behavior illustrates%%
By preferentially investing in the eggs it lays in the nest, the peacock wrasse increases the chance those eggs will survive. The eggs it disperses widely and does not provide care for are less likely to survive, at least some of the time, but require a lower investment by the adults. (In this sense, the adults avoid the risk of placing all their eggs in one basket.)
%%Mice that experience stress such as a food shortage will sometimes abandon their young. Explain how this behavior might have evolved in the context of reproductive trade-offs and life history%%
If a parent’s survival is compromised greatly by bearing young during times of stress, the animal’s fitness may increase if it abandons its current young and survives to produce healthier young at a later time
%%Negative feedback is a process that regulates biological systems. Explain how the density-dependent birth rate of dune fescue grass exemplifies negative feedback%%
In negative feedback, the output, or product, of a process slows that process. In populations that have a density-dependent birth rate, such as dune fescue grass, an accumulation of product (more individuals, resulting in a higher population density) slows the process (population growth) by decreasing the birth rate
%%Name one biotic and one abiotic factor that could contribute to yearly fluctuations in the size of the human population in a given region%%
An example of a biotic factor would be disease caused by a pathogen; natural disasters, such as earthquakes and floods, are examples of abiotic factors