knowt logo

Unit 3 Managing human population

3.1 Human population dynamics & structure

Calculations

  • Population density: total population/land area

    • # of ppl per km²

    • Low density: low marriage (low birth rate), fewer jobs in rural areas (causes urbanisation), lack of available healthcare

  • Intrinsic growth rate: dN/N0

    • dN = (births + immigration) - (deaths + emigration)

    • N0 = original population

  • Doubling time: period of time required for a population to double in size

    • Rule of 70: 70/percent

Factors that influence population density & distribution:

  • Environmental: natural resources, geographic & climatic factors

    • Large, flat lowland plains are easier to access + better for food production than mountainous areas

    • Areas w/ few extreme weather events are more appealing

    • Areas w/ fertile soil like river deltas tend to have higher populations than areas with high rainfall (leached soil) & cold areas with permafrost

    • A secure water supply

    • Areas w/ a wealth of natural resources

  • Economic:

    • Agriculture is a primary industry & is manufactured by a secondary industry

      • These increase job opportunities & standard of living, causing population growth

    • Areas w/ good transport links are often more densely populated due to trade links

  • Political:

    • Government policies have an impact on population density

      • Can encourage/discourage investment in an area

      • War is a ‘push’ factor & causes out migration + decrease in food production

Factors affecting changes to a population:

  • Population change: # of people b/t the start and end of a given time period

  • Birth rate: # of live births per thousand ppl in a population per year

    • High birth rate = increased population & vice-versa

    • High infant mortality rate in LICs → high birth rates

      • Due to: spread of disease & lack of both medical care + access to clean water

  • Death rate: # of deaths per thousand ppl in a population per year

    • Influenced by: climate, medical facilities, living standards, & social conflict + crime rates

  • Life expectancy increases due to: increased standards of living, access to both clean water & nutrition, & education improvements

  • Overall population change: annual population change of an area

    • (birth rate - death rate) + net migration

Population Differences in HICs & LICs

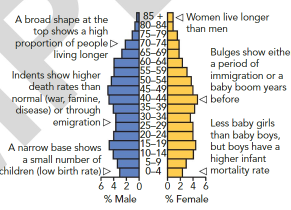
  • Stage 1 pyramid (pre-industrial): high birth & death rate w/stable population

    • Rarely found & low life expectancy

  • Stage 2 pyramid (transitional): declining death rate (due to medicine, better nutrition, & clean water)

  • Stage 3 pyramid (industrial): birth rate declines from stage 2, death is still declining/low

    • Less population growth than stage 2; birth rates can typically be controlled by contraceptives

    • Avg. life expectancy increases & mortality rates stabilize

  • Stage 4 pyramid (late-industrial): low birth & death rates

    • Population size fluctuates due to economic conditions; slow growth

  • Stage 5 pyramid (post-industrial): birth rate is lower than death rate

    • Older population reaches full life expectancy

  • Analyzing a population pyramid:

Dependency ratio: relationship b/t a country’s working & non-working populations

  • Dependent: ages 0 to 14 (young)& 65+ (old)

  • Independent: age 15-64

  • Total dependency ratio: [young population (0 to 14) + old population (65+)] × 100 / population aged 15 to 64

    • Expressed as # of dependents per hundred ppl in the workforce

    • Considered high when it’s above 62%

  • Decreases due to: young population reaching working age, anti-natalist policy, immigration of working age ppl, & lower birth rate

3.2 Impacts of human population change

Ageing populations: population w/ a high percentage of older people

  • Occur when birth rates decline & life expectancy increases — typically stage 5

  • Average age is increasing due to: better nutrition, sanitation, standard of living, & care

  • Impacts of an ageing population:

    • Shrinking workforce impact economy

    • Pensions may be insufficient to care for older populations - higher spending

    • Health care systems have more pressure since older ppl need more care

    • Increased retirement age, so gov’ts can collect extra taxes

3.3 Managing human population change

Global organizations

  • The Club of Rome: aims to alert the world about consequences of a rapidly growing population → focused on sustainable economic growth + limited population growth

  • UN Agenda 21: plan of action to limit human impact on the environment

  • Both are concerned w/ issues related to human population growth

Government policies:

  • Pro-natalist: encourage ppl to have children & increase birth rates

    • Shrinking populations pressure a country’s workforce + financial stability

    • Monetary incentives, childcare assistance, free schooling, & monthly grants

  • Anti-natalist: discourage ppl from having children & decrease birth rates

    • Increasing populations that cause declining mortality rates & high rates of poverty

    • e.g) China’s One Child Policy

    • Other policies include:

      • encouraging marriage later in life

      • increasing access to contraceptives & family planning

      • improving education + employment opportunities for women

      • making abortions legal + safe

    • Limitations as a population stabilizes: an ageing population + declining workforce

robot