hypothesis
HYPOTHESIS TESTING
}Statistics, as a mathematical tool, is designed to help the researcher or statistician in different fields to make decisions about the outcomes of potentially important body of knowledge for planning, development, and evaluation. Inferential statistics is most appropriate in situations that call for testing, comparing, and predicting outcomes. One crucial process in conducting inferential statistics is hypothesis testing. In this topic, you will explore the applications of hypothesis testing.

Definition of Terms
}Hypothesis
▪ is an assumption, a claim, or a proposed explanation for an observation or phenomenon
Null Hypothesis
▪ is a claim that indicates the absence of relationship or difference between two values, denoted by symbol Ho
Alternative Hypothesis
▪ is a claim that indicates the presence of relationship or difference between values, denoted by symbol Ha or H1
}Hypothesis Testing
▪ is a decision-making process for evaluating or testing claims about a population based on information obtained from sample.
Level of Significance
▪ is the maximum probability of committing type I error, denoted by the Greek alphabet alpha (𝛼)
Type I Error
▪ occurs when a true null hypothesis is rejected, a.k.a. Alpha error
Type II Error
▪ occurs when a false null hypothesis is accepted or not rejected, a.k.a. Beta error One-
Tailed Test
▪ is a test that indicates that the null hypothesis should be rejected when the test statistic value is in the critical region on one side of the mean, a.k.a. directional test
Two-Tailed Test
▪ is a test that indicates the null hypothesis should be rejected when the test statistic value is in either of the two critical regions, a.k.a. non-directional test
Confidence Level
▪ is the probability that a parameter lies within the specified interval estimate of the parameter
Critical Value
▪ is a value that separates a critical region (rejection region) from acceptance region in a hypothesis test, usually presented in tables
Statistic
▪ is a value obtained by using all data value of a sample from a population

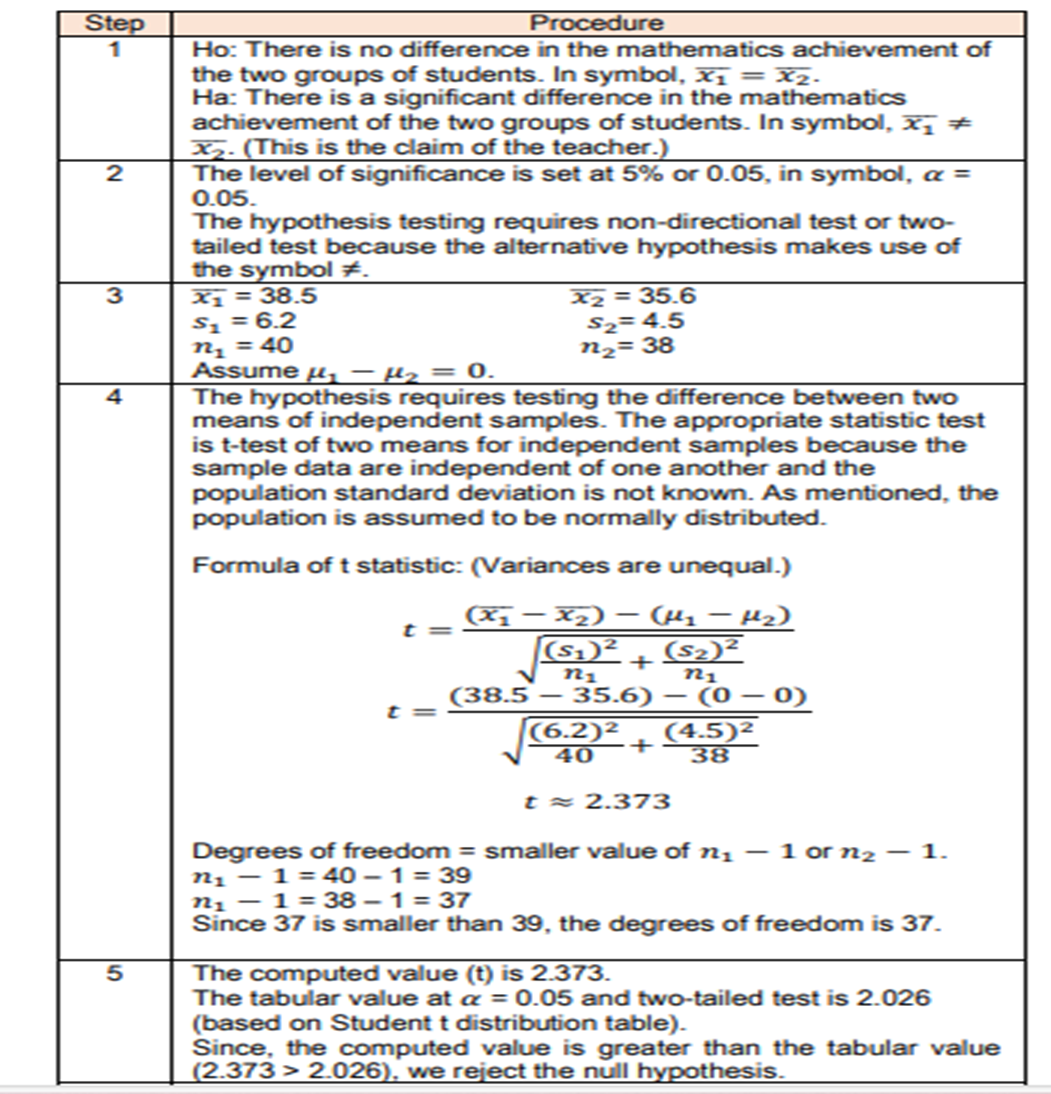
Steps in Hypothesis Testing
}Steps in Statistical Hypothesis Testing
}1 State the null hypothesis and alternative hypothesis
}2 Set the level of significance and determine the direction of the tests
}3 Collect data
}4 Calculate a test statistic and determine the critical value
}5 Decide on the rejection or acceptance of null hypothesis 6 Draw a conclusion

STATISTICAL TESTS
Normal distribution - is a probability distribution whose graph is continuous, bell-shaped, and symmetric.
Some Properties of a Normal Distribution
▪ A normal distribution curve is bell-shaped.
▪ The mean, mode, and median are equal and located at the center of distribution.
▪ A normal distribution has only one mode.
▪ A normal distribution curve is symmetric about the mean.
▪ A normal distribution curve is continuous and never touches the x-axis.
▪ The total area under a normal distribution is equal to 1 or 100%.
▪ The area under the part of a normal distribution curve that lies within 1 standard deviation of the mean is approximately 0.68, within 2 standard deviations, about 0.95, and within 3 standard deviations, about 0.997.
Parametric Tests
▪ Z-test for one sample mean
▪ T-test for one sample mean
▪ Paired t-test
▪ Independent t-test
▪ Pearson product moment correlation coefficient or Pearson’s r
▪ Analysis of variance (ANOVA)
▪ Linear regression
Nonparametric Tests
▪ Chi-square test
▪ Spearman rank correlation
▪ Wilcoxon sign-rank test
▪ Sign test