Principles of Microeconomics Chapter 7 Consumers, Producers, & the Efficiency of Markets
Principles of Microeconomics Chapter 7 Consumers, Producers, & the Efficiency of Markets
Ch. 7 - Consumers, Producers, and the Efficiency of Markets
Welfare economics: study of how the allocation of resources affects economic well-being
Equilibrium of S and D maximizes the total benefits received by all buyers and sellers combined
7-1 Consumer Surplus
Willingness to Pay
Willingness to pay: a buyer’s maximum; measures how much that buyer values the good
Price > WTP: won’t buy | Price < WTP: will buy | Price = WTP: fine with buying or keeping the $
Consumer surplus: amt a buyer is willing to pay for a good MINUS the amt the buyer actually pays for it; measures the benefit buyers receive from participating in market
Total consumer surplus = adding consumer surpluses of all participants
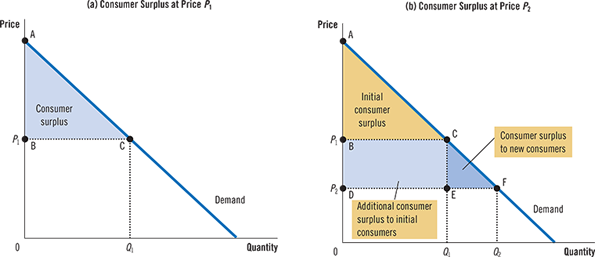
Using the Demand Curve to Measure Consumer Surplus
At any qty, the price given by the demand curve shows the WTP of the marginal buyer (buyer who would leave market 1st if price were any higher)
Area below the demand curve and above the price measures the consumer surplus in a market
How a Lower Price Raises Consumer Surplus
When price falls, increase in consumer surplus of EXISTING buyers is the rectangle that is still at Q1 and between P1 and P2
When price falls, the consumer surplus of NEW buyers is the new triangle formed from Q1 to Q2 between P1 and P2
What Does Consumer Surplus Measure?
Consumer surplus is a good measure of economic well-being if policymakers want to satisfy BUYERS
Policymakers can disregard CS if they do not respect preferences that drive buyer behavior (ex. drugs)
7-2 Producer Surplus
Cost and the Willingness to Sell
Cost in this case: opportunity cost = willingness to sell
Price > WTS: will sell | Price < WTS: won’t sell | Price = WTS: fine with getting the job or spending time/energy elsewhere
Producer surplus: amt a seller is paid MINUS the cost of production; measures the benefit sellers receive from participating in a market
Total producer surplus = adding producer surpluses of all participants
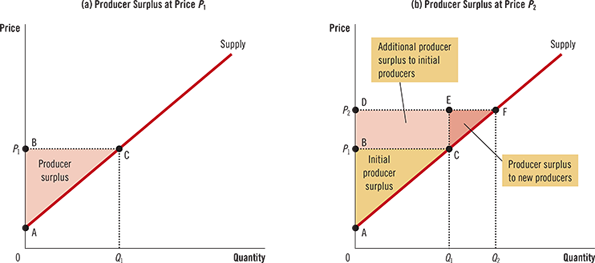
Using the Supply Curve to Measure Producer Surplus
At any qty, price given by supply curve shows cost of the marginal seller (seller who would leave market if price were any lower)
Area below price and above supply curve measures producer surplus in a market
Total area: sum of producer surplus of ALL sellers
How a Higher Price Raises Producer Surplus
When price rises, increase in PS of EXISTING sellers is the rectangle formed from P1 to P2 at the same Qty
When price rises, PS of NEW sellers is triangle formed from P1 to P2 and Q1 to Q2
7-3 Market Efficiency
The Benevolent Social Planner
Benevolent social planner wants to maximize economic well-being of everyone in society
One possible measure of economic well-being: total surplus (CS+PS)
Total surplus = value to buyers - cost to sellers
If an allocation of resources maximizes total surplus, it exhibits EFFICIENCY
Social planner also considers EQUALITY (whether buyers and sellers have similar levels of economic well-being)
Evaluating the Market Equilibrium
Total surplus = area between S and D curves up to eq. Qty
Free markets allocate:
Supply of goods to buyers who value them most (highest WTP)
Demand of goods to sellers who produce them at lowest cost
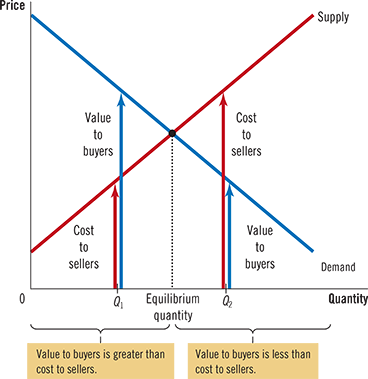
Free markets produce the qty of goods that maximizes total surplus (social planner CANNOT change qty of good)
Qty BELOW eq: value to marginal buyer > cost to marginal seller; increasing qty raises total surplus
Qty ABOVE eq: value to marginal buyer < cost to marginal seller; decreasing qty raises TS
Invisible hand guides everyone in market to best outcome of economic efficiency
Economists support the idea of a human kidney market (shortage of kidneys would disappear)