Chapter 10.4 Shifts in Aggregate Demand
Review:
Components of Aggregate Demand:
- Consumption Spending (C)
- Investment Spending (I)
- Government Spending (G)
- Spending on Exports (X) minus Imports (M)
When at least one of these components increases, the aggregate demand curve will shift to the right.
Why?
This shift occurs because of a greater amount of total spending happening at every price level.
Formula for Aggregate Demand (AD):
AD = C + I + G + (X - M)
For (X - M):
- More imports will result in a lower level of aggregate demand because the aggregate demand is defined as the total demand for domestically produced goods and services.
- Example: When an American buys a foreign product, it gets counted alongside other consumption. The income generated from the sale of this foreign product goes to the producers in that foreign country as opposed to American producers. Therefore, this should NOT be counted as part of domestic demand. This is why the imports are subtracted from the exports.
The Effect of Changes by Consumers and Firms on Aggregate Demand (AD)
Relationships:
Results in rightward shift of AD:
- When consumers feel more confident about the future of the economy, they tend to consume more goods and services. (Remember, consume is another way of saying spend/spending).
- When business confidence is high, firms tend to spend more on investment (because they believe that the future payoff from the investment will be substantial).
Results in leftward shift of AD:
- If consumer confidence drops, then consumption declines.
- If business confidence drops, then investment spending declines.
How is consumer confidence/business confidence measured/recorded?
- The University of Michigan publishes a survey of consumer confidence and constructs an index of consumer confidence each month.
- The Organization for Economic Development and Cooperation (OECD) publishes one measure of business confidence through the "business tendency surveys".
- This organization collects business opinion survey data for 21 countries on future selling prices and employment, among other business climate elements.
Know that although these survey measures are heavily utilized, they are not very precise. However, they are still able to suggest when confidence is either rising or falling, as well as when it is relatively high or low compared to the past.
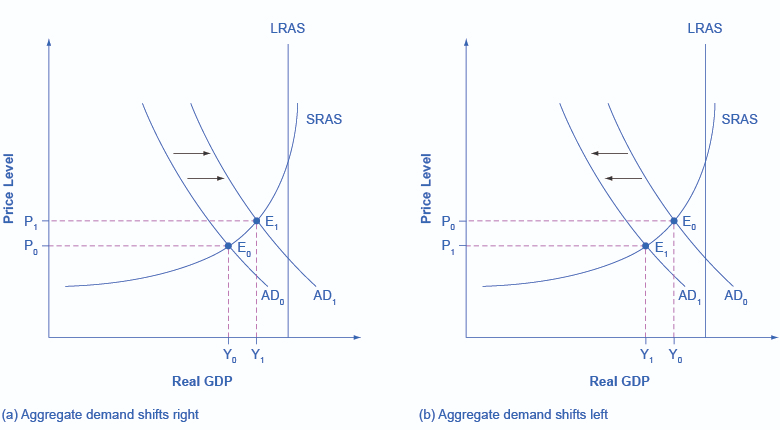
Economists associate a rise in confidence with higher consumption and investment demand - this leads to an outward shift in the AD curve, which results in the move of the equilibrium from E0 to E1. This means a higher quantity of output and a higher price level. This is shown in the figure below (Graph a):
Consumer and business often reflect macroeconomic realities.
- Example: Confidence is usually high when the economy is growing briskly and low during a recession.
It’s also important to note that economic confidence can occasionally rise or fall for reasons that do not have a close connection to the immediate economy.
- Examples:
- Risk of war
- Election results
- Foreign policy events
- Pessimistic prediction about the future by a prominent public figure
- This is why U.S. Presidents have to be careful about what they publicly say about the economy.
- If they offer economic pessimism, they risk causing a decline in confidence that reduces consumption and investment, thus causing a leftward shift of the aggregate demand curve. This would contribute to the onset of the recession they had warned against initially.
When the aggregate demand curve shifts to the left, this results in a new equilibrium point. E0 (initial equilibrium) goes to E1 (new equilibrium). E1 is a point at which there is lower quantity of output and lower price level. This is shown in Graph (b) below:

Government Spending/Policy Choices and its Effect on Aggregate Demand (AD)
As mentioned above, government spending is one of the four components of aggregate demand.
- Higher government spending will cause the AD to shift to the right.
- Lower government spending will cause the AD to shift to the left.
Tax policy can affect consumption and investment spending.
- Tax cuts for individuals will tend to increase consumption demand (tax cuts lead to more disposable income which means more money for the consumer to spend).
- During a recession, when unemployment is high and many businesses are suffering low profits and/or even losses, the U.S. Congress often passes tax cuts.
- Example: The 2001 recession
- Tax increases, on the other hand, will usually diminish consumption demand (tax increases lead to less disposable income which means less money for the consumer to spend)
Tax policy can also pump up investment demand by offering lower tax rates for corporations or tax reductions that benefit specific kinds of investment. Shifting C (consumer spending) or I (investment spending) will shift the entire AD curve.
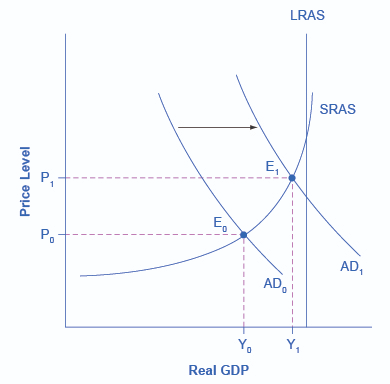
Graph explained:
The original equilibrium point during a recession, E0, is relatively far from the full employment level of output. The tax cut, which increases consumption, shifts the AD to the right (as seen in the diagram above). At the new equilibrium (E1), real GDP rises and unemployment falls (this is good for the economy). Know that in this diagram, the potential or full employment level of GDP is not reached, so any rise in the price level remains muted.
Government spending and tax rate changes can be useful tools to shift aggregate demand. Other policy changes can shift the aggregate demand curve as well.
- Example: The Federal Reserve can affect interest rates and credit availability
- Higher interest rates tend to discourage borrowing and thus reduce both household spending on big-ticket items such as houses and cars, and investment spending by businesses
- Lower interest rates will stimulate consumption and investment demand
- Interest rates can also affect exchange rates, which will have effects on the export and import components of aggregate demand