Stats - TI-84 Calculator Options
Mean, Median, and IQR
1-Var Stats:
ch. 3 flashcards
Provides a summary with the mean (x-bar), sample standard deviation, population standard deviation, minimum, Q1, median (Q2), Q3, and maximum
Always leave FreqList blank when calculating
Normal Probabilities
normalcdf:
ch. 5 and 6 flashcards
Used to calculate the probability that a random variable falls within a certain range in a normal distribution.
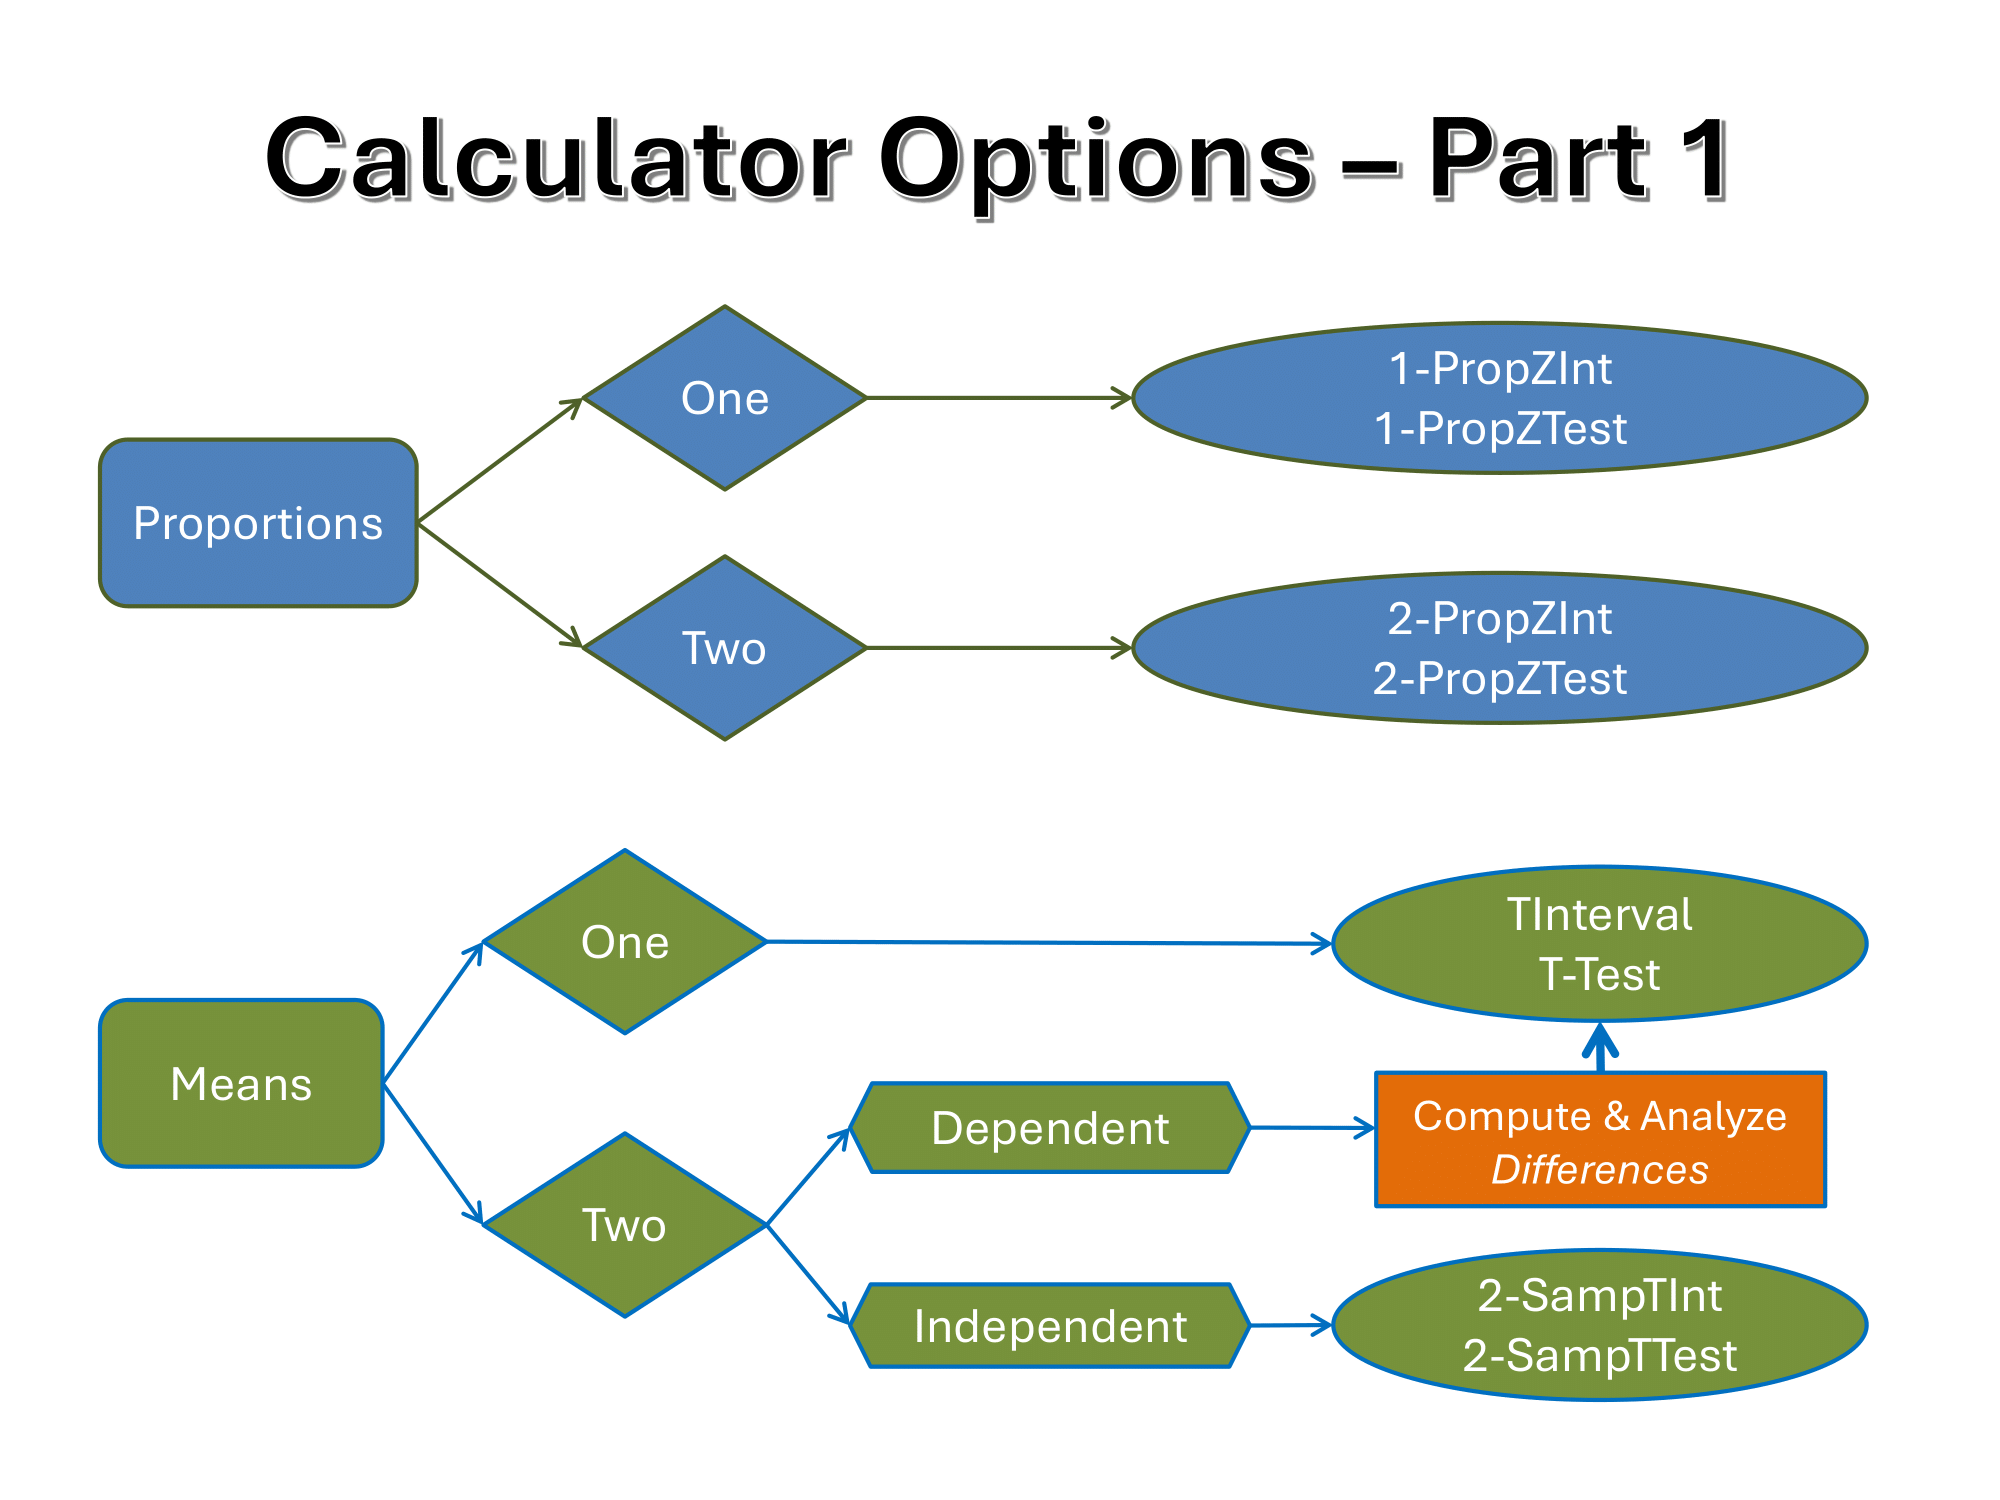
Proportions
One Proportion
One Proportion Z-Interval (1-PropZInt):
ch. 7, 8, and 9 flashcards
Used to estimate a population proportion based on a sample proportion.
It calculates a confidence interval for a single population proportion.
One Proportion Z-Test (1-PropZTest):
ch. 7, 8, and 9 flashcards
Used to test a hypothesis about a single population proportion.
It determines whether there is enough evidence to reject a null hypothesis regarding the population proportion.
Two Proportions
Two Proportion Z-Interval (2-PropZInt):
ch. 7, 8, and 9 flashcards
Used to estimate the difference between two population proportions based on two sample proportions.
It calculates a confidence interval for the difference between two population proportions.
Two Proportion Z-Test (2-PropZTest):
ch. 7, 8, and 9 flashcards
Used to test a hypothesis about the difference between two population proportions.
It assesses whether the difference between the two sample proportions is statistically significant.
Means
One Mean
T-Interval:
ch. 7, 8, and 9 flashcards
Used to estimate a population mean when the population standard deviation is unknown.
It calculates a confidence interval for a single population mean using a t-distribution.
T-Test:
ch. 7, 8, and 9 flashcards
Used to test a hypothesis about a single population mean when the population standard deviation is unknown.
Two Means
Dependent:
Make the “difference score,” then see equations for One Mean (T-Interval and T-Test)
Independent:
2-SampTInt:
ch. 7, 8, and 9 flashcards
Used to estimate the difference between two population means when the population standard deviations are unknown.
Data is independent.
2-SampTTest:
ch. 7, 8, and 9 flashcards
Used to test a hypothesis about the difference between two population means when the population standard deviations are unknown.
Data is independent.
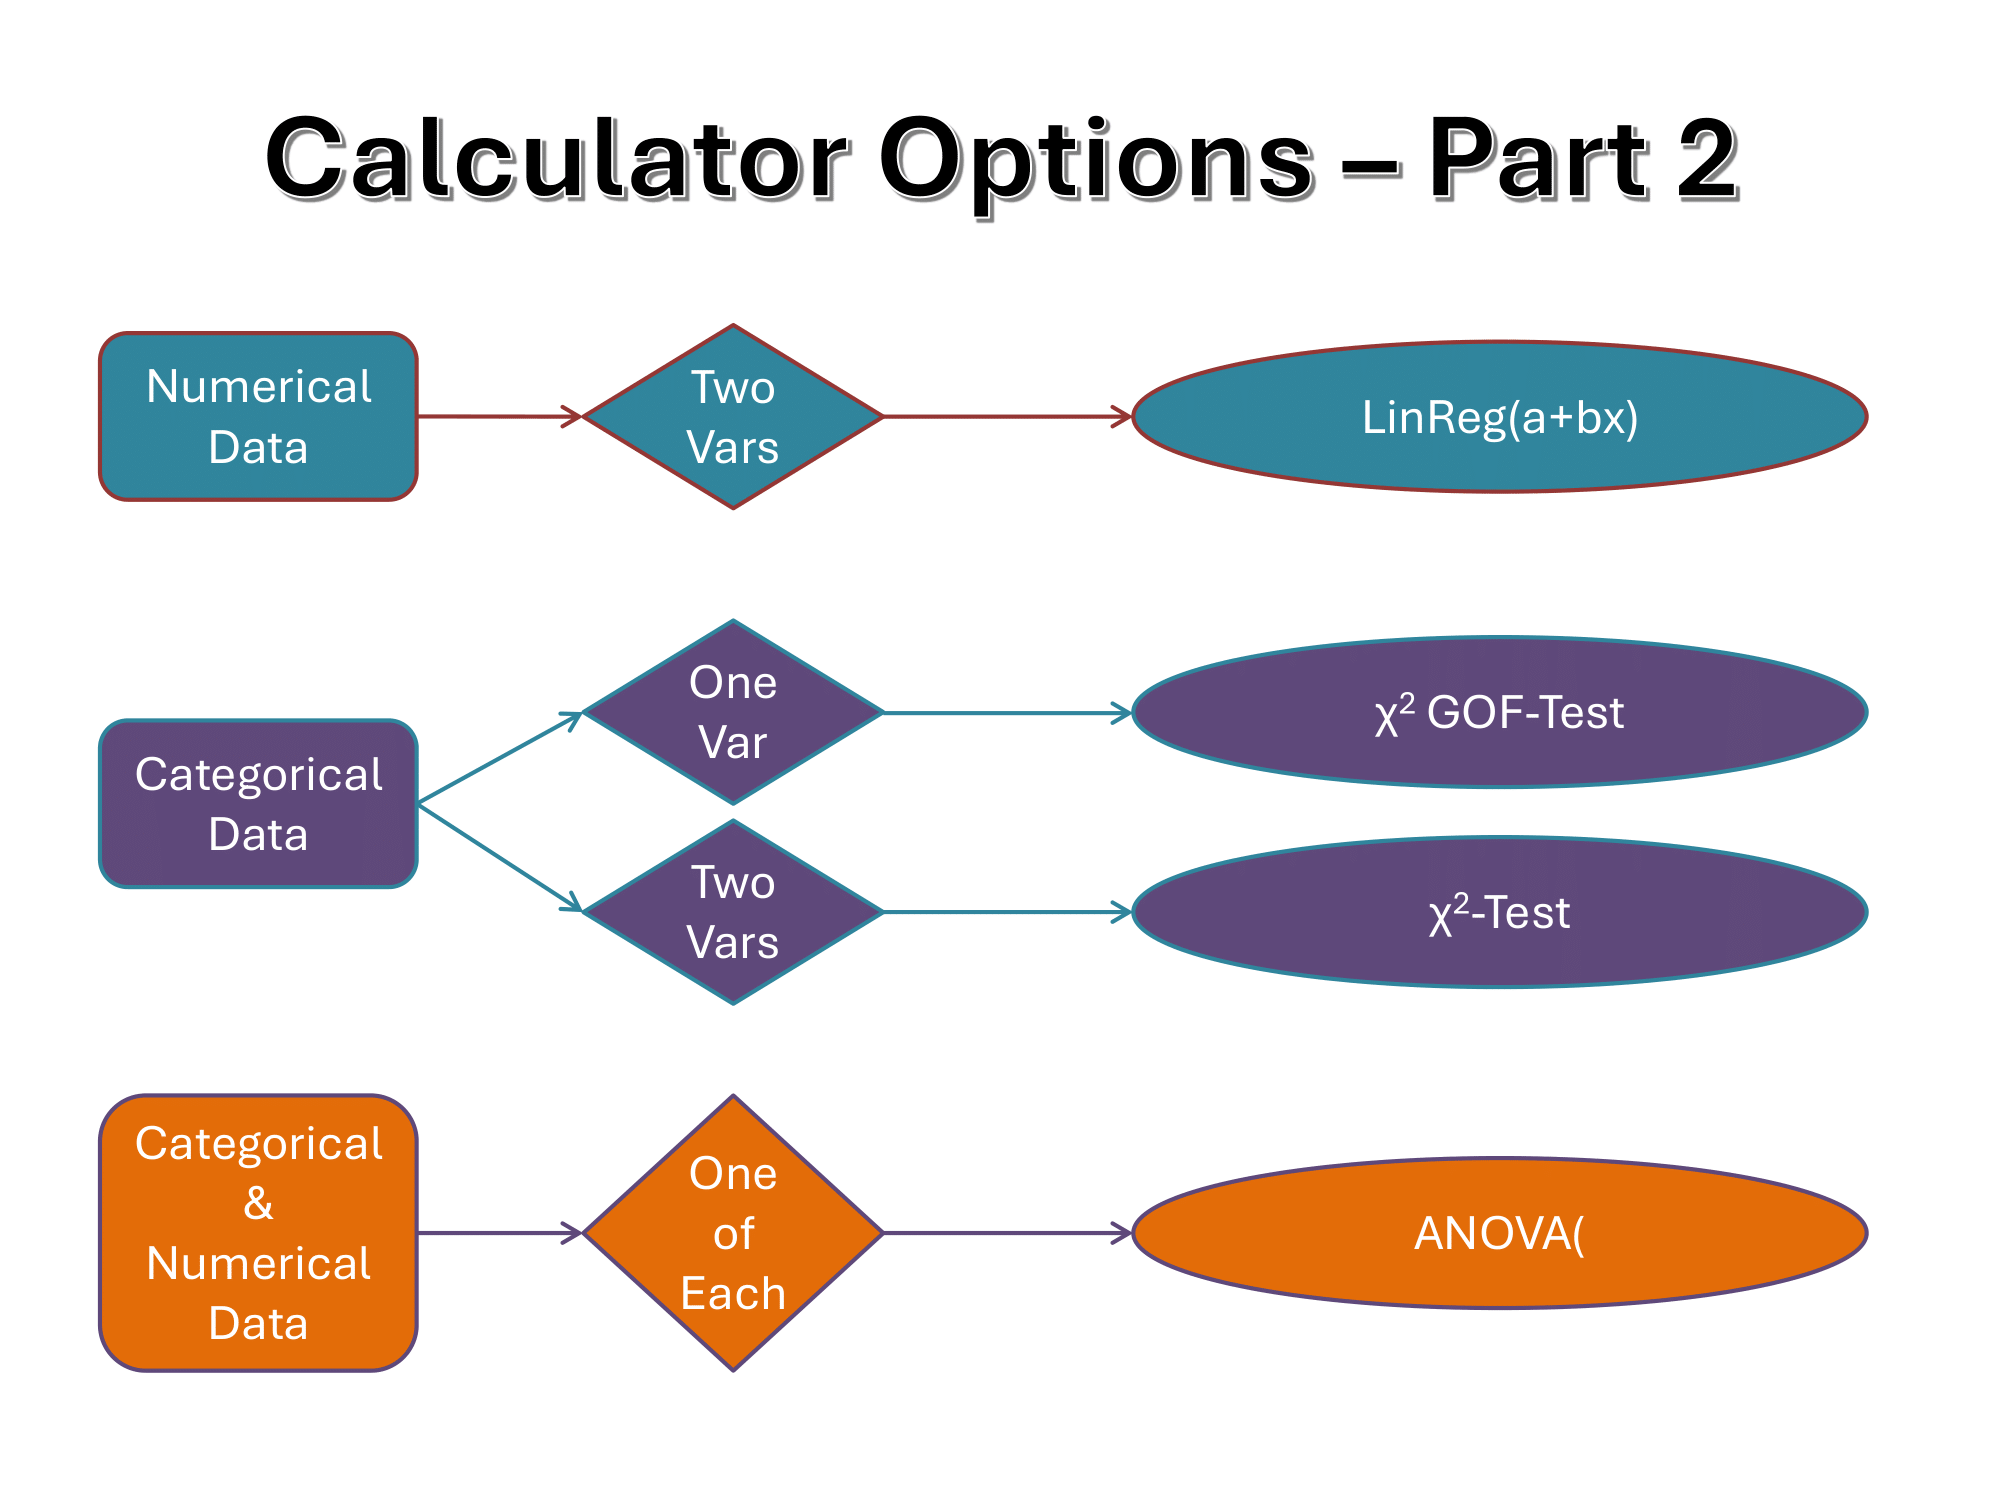
Categorical Data
Use one categorical variable to predict another categorical variable
One Variable:
Chi-Square Goodness-of-Fit Test (χ2 GOF-Test):
ch. 10 and 11
Used to test whether a sample distribution fits a hypothesized distribution.
It assesses whether the observed frequencies of categories in a single categorical variable differ significantly from expected frequencies.
Two Variables:
Chi-Square Test (χ2 -Test):
ch. 10 and 11
Used to test for an association between two categorical variables.
It determines whether the observed frequencies in a contingency table differ significantly from the frequencies expected under the assumption of independence between the variables.
Numerical Data
Two Variables:
Linear Regression (LinReg(a+bx)):
Used to model the relationship between two numerical variables with a linear equation.
Use one numerical variable to predict another numerical variable
The equation is in the form , where is the dependent variable, is the independent variable, is the y-intercept, and is the slope.
Categorical & Numerical Data
One of Each:
ANOVA (Analysis of Variance):
ch. 10 and 11
Used to compare the population means of three or more groups.
ANOVA tests whether there is a significant difference among the population means of the groups.
Use one categorical variable to predict a numerical variable