Ecology - Ch53
Definitions
Population - a group of individuals in a single species that live in the same area
(Population) Density - number of individuals per unit of area/volume
(Population) Dispersion - the spacing pattern among individuals within a population
Immigration - influx of individuals from other areas
Demography - a study of the key characteristics of a population (births, deaths, migrations, etc.) and how they change over time
Life History - traits that impact an organisms reproduction/survival
Semelparity - A single reproduction before death
Iteroparity - Organisms that undergo multiple reproductive cycles in its lifetime
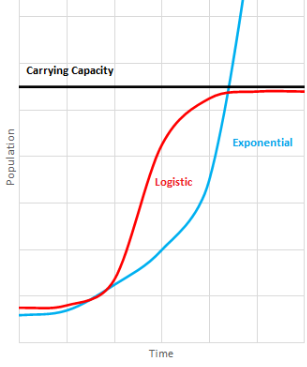
Carrying Capacity - The maximum population size that an environment can sustain
Density Independent - Birth/Death rate do not change with population density
Density Dependent - A death/birth rate that changes with population density
Notes
33.1-2
Population Density (PDen)
Can be determined through counting, estimating through an indicator (i.e. number of nests, droppings), calculating average density of a smaller plot and multiplying across habitat
Also may use mark-recapture method to estimate size of population
Marking a sample of a population & releasing, wait for reintegration with rest of population, sample again.
Number of marked animals in second sample = x
Total number of animals in second sample = n
Number of individuals marked during first sample = s
Estimated population size =N
x/n = s/N, N = sn/x
PDen fluctuates over time (deaths, births, etc.)
Increases: Immigration and births
Decreases: Emigration and deaths
Population Dispersion (PDisp)
Common Patterns: clumped, uniform, random
Clumped: Resources gathered in an area. i.e.) starfish
Uniform: Even spacing due to territorial instincts. i.e.) nesting penguins
Random: Even distribution of resources. i.e.) dandelions
Demographics
Summarized using a life-table - summarizes reproductive rates and survival of individuals at specific age ranges. Typically done using cohorts (using a sample of individuals that are all the same age until all of them are dead)
Typically focus on females (males don’t produce new offspring)
Survivorship curve: A representation of the survival rate from a life table. Most species have curves between 3 types or show more complex patterns
Type 1: relatively flat curve - represents fewer deaths in early/middle life then sharply drops as age increases.
Species that represent this curve: humans
Type 3: a sharp drop at the beginning symbolizing high death rates in young individuals then flattens as population ages
Usually associated with with very large number of offspring but provide little care (fish, some plants)
Type 2: a constant death rate as the population ages (constant slope)
Usually seen in rodents, lizards
Age | Number Alive | Proportion alive at start of year | Death rate | Average number of female offspring |
0-1 | 651 | 1 | 0.614 | 0 |
1-2 | 252 | 0.386 | 0.496 | 1.07 |
Exponential Model
Calculating changes in population size:
∆population size = births + immigrants - deaths - emigrants
N = population size, t = time, B = births, D = deaths
Formula simplified to not account for immigration and emigration
∆N/∆t = B - D
R = difference in births and deaths
∆N/∆t = R
On a per capita basis:
Per capita change in population size = r∆t
r∆t * N → used to determine how many individuals are added/subtracted from a population each year
∴ R = r∆t * N
∆N/∆t = r∆t * N → used for calculations over a specific period of time (ie a year)
Changes at each instant in time:
dN/dt = rN
r = per capita change in a population at each instant in time
Exponential Growth
When a population experiences ideal conditions to increase in size by a constant proportion at each instant in time
dN/dt = rN
Graph looks like physic d-t graph when accelerating
33.3-6
Carrying Capacity (symbol K)
Varies depending over space, time w/ limited resources
i.e.) bats with a higher K have abundant flying insects/roosting sites
Limiting Factors:
Energy
Shelter
Refuge from predators
Nutrient availability
Water
Sustainable nesting sights
Logistic Growth Model (LGM) /Logistic Population Growth (LPG)
Adjustment of exponential growth model so that r decreases as N increases
LPG: per capita rate of pop. growth approaches 0 as population size nears carrying capacity
K - N = number of addition indv. that the environment can support
(K - N)/K = fraction of K that is still available for population growth
dN/dt = rN * ((K - N)/2) = population growth rate
if N < K, (K - N)/K is close to 1
Per capita rate of population growth will be close to, but, less than r (r = the rate of increase seen in exponential population growth)
if N is large + resources are limited, (K - N)/K is close to 0
Per capita rate of pop growth is small
if N = K, no growth
LPG graph crease S-shaped curve
Life History
The traits that impact an organism’s schedule of reproduction/survival. Evolutionary outcomes reflected in development, physiology, and behavior
3 Main Components:
When reproduction begins (first age of reproduction/maturity)
i.e.) loggerhead turtle ~ 30yo to lay eggs for first time. coho salmon ~ 3-4yo
How often reproduction occurs
Semelparity vs Iteroparity
How many offspring produced per reproductive episode
How many are going to survive? Selective pressures influence number/size of offspring. If small chances of offspring surviving, many produced (plants)
Semelparity Advantages/Disadvantages:
Organisms that experience a single reproductive cycle in their lifetime
Release multiple eggs/potential offspring all at once
i.e. agave - b/c it grows in areas w/o lots of rain/nutrients, agave saves nutrients in its tissues until a rainy year where it sends out lots of seeds and dies
Adaptation due to harsh environment
Iteroparity Advantages/Disadvantages:
Organisms with multiple reproductive cycles
Longer reproductive timeline (multiple chances over long period of time for offspring)
i.e. loggerhead turtles being able to lay eggs for ~30 years after initial eggs laid
European Kestrels Investigation
Study of effects of parental caregiving in kestrels
Researchers transferred chicks among nests to produce reduced broods (3-4 vs 5-6) or enlarged broods (7-8). Measured percentage of male and female parent birds that were alive after a winter
Found there was a lower survival rate of kestrels in lager broods due to the parent birds having to care for more birds negatively impacting survival of parent birds
Exponential Growth Phase - Behaviors and Characteristics
Environmental factors that keep populations from indefinitely growing
Competition for Resources
Increasing density = increase competition for resources = reduced reproductive rates
i.e.) Not squishing crops together/fertilizing to increase nutrient availability
Disease
High transmission rate of disease increase disease’s impact on population (if density dependent)
i.e.) Influenza spreading through population of densely populated cities
Territoriality
When space becomes a resource that individuals have to compete for
i.e.) cheetahs marking territory
Intrinsic Factors
Physiological factors can regulate pop. size
i.e.) reproductive rates in white-footed mice can drop when high population density
Toxic Wastes
i.e.)