Econ - Test 1 revision
Chapter #1 - The Nature of Economics
Why study Economics?
1) to learn a way of thinking that helps us make decisions
2) to understand Global Affairs
3) to be an informed Voter
What Economics Is All About?
scarcity : refers to the limited nature of society’s resources
economics : is the study of how individuals, businesses & governments manage their scarce resources
Society faces an important tradeoff : efficiency vs equity
efficiency : getting the most out of scarce resources
equity : distributing prosperity fairly among society’s members
tradeoff : to increase equity - can redistribute income from the well-off to the poor - but this reduces the incentive to work and produce, and shrinks the size of the economic “pie”
Microeconomics vs Macroeconomics
microeconomics (looks at the trees) : the word ‘micro’ means small - microeconomics studies the behavior of individual households and firms (companies)
macroeconomics (looks at the forest) : the word ‘macro’ means big/large - macroeconomics focuses on the big economics picture, specifically how the overall national economy performs
Economic Systems Overview
Central Planned Economic System : a central authority has the responsibility to determine, by more or less detailed directives, the nature and the volume of the goods and services to be produced and the way of producing them. Example: Cuba, North Korea
Mixed Economic System : the transactions rest mainly on voluntary decisions between individuals but the State intervenes in some fields
3 fundamental Questions of Economics
→what goods & services should be produced?
→how are those goods & services produced?
→for whom are those goods & services produced?
goods = tangible things that satisfy wants (things you can touch - object)
services = intangibles that satisfy wants (cannot be held/touched)
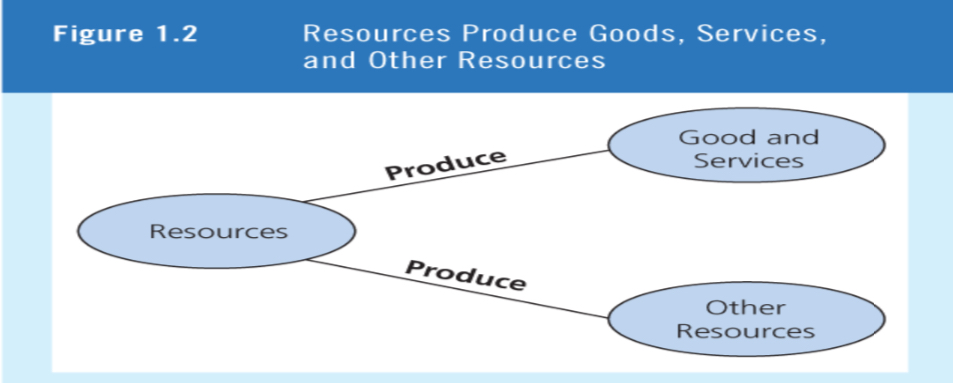
→ how goods & services are produced :
goods & services are produced using resources (factors of production)
4 categories of Resources
1) land : anything provided by nature
2) labour : work & effort people devote to producing goods & services
3) capital : Including Human Capital (ex : machines, tools, building knowledge)
4) entrepreneurship : the ability & talent to organize resources
Incomes Generated by Factors of production
— owners of resources receive income for the use of resources
rent (R) = income from land
wages and salaries (W) = income from labour
interests (I) = income from capital
profits (∏) = income from entrepreneurship
Total income = R + W + I + ∏
Economic Models
Economists attempt to understand complex economic phenomena by using economic models
An economic model : a simplification of economic reality
parts of an economic model are :
definitions
assumptions
hypothesis
testing and prediction
Positive & Normative Statement
— a positive statement is a statement about what is currently believed - it can be tested by checking it against facts
— a normative statement is a statement about what it should be - it expresses an opinion and cannot be tested
ex :
positive statement : higher rates of income tax on the rich reduces income inequality
normative statement : rich people should pay higher taxes
How Economist Think
— people make rational choices by comparing benefits and costs
→ the benefit of something is the gain of pleasure that it brings and is determined by preferences
→ the opportunity cost of something is the highest valued alternative that must be given up to get it
— people respond to incentives
incentive : a reward that encourages an action or a penalty that discourages a person to act
rational people respond to incentives because they make decisions by comparing costs and benefits
ex : in response to higher gas prices, sales of electric cars rise - in response to higher cigarette taxes, teen smoking falls
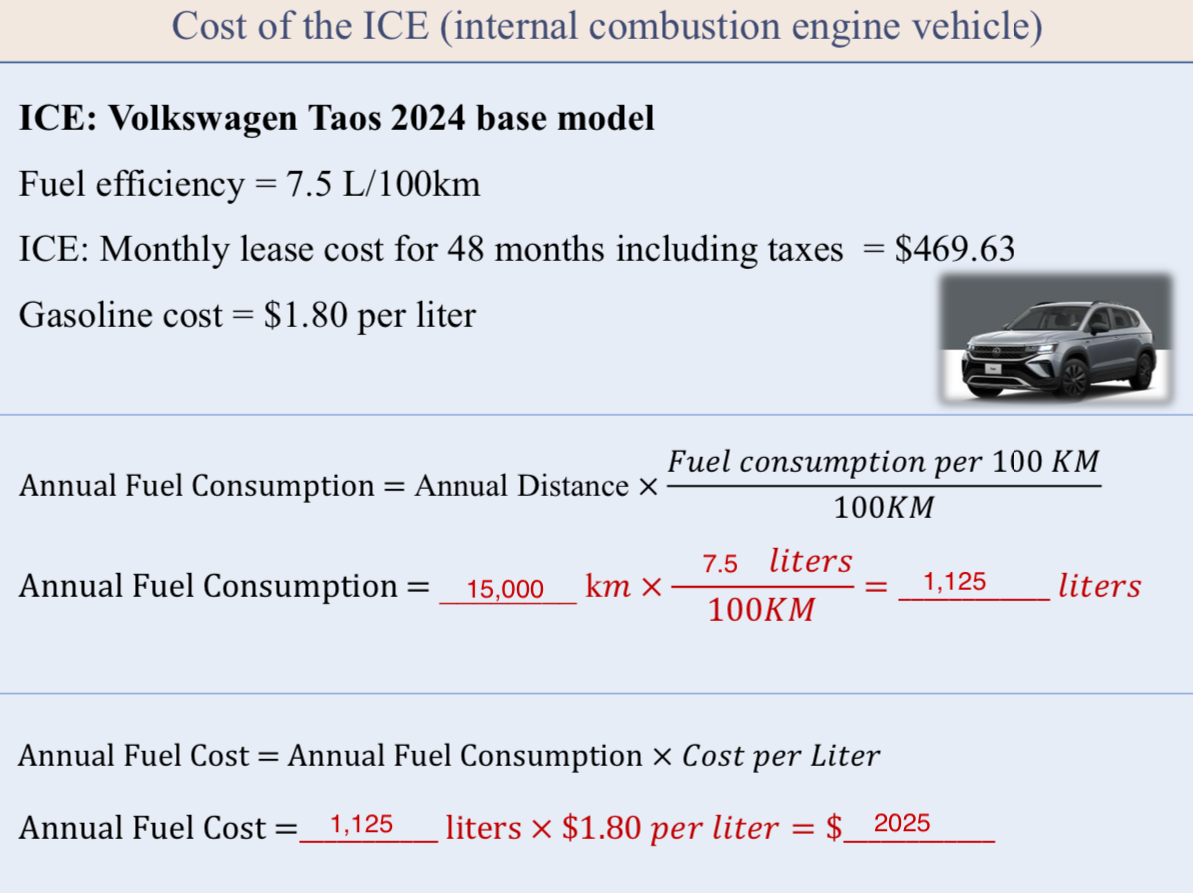
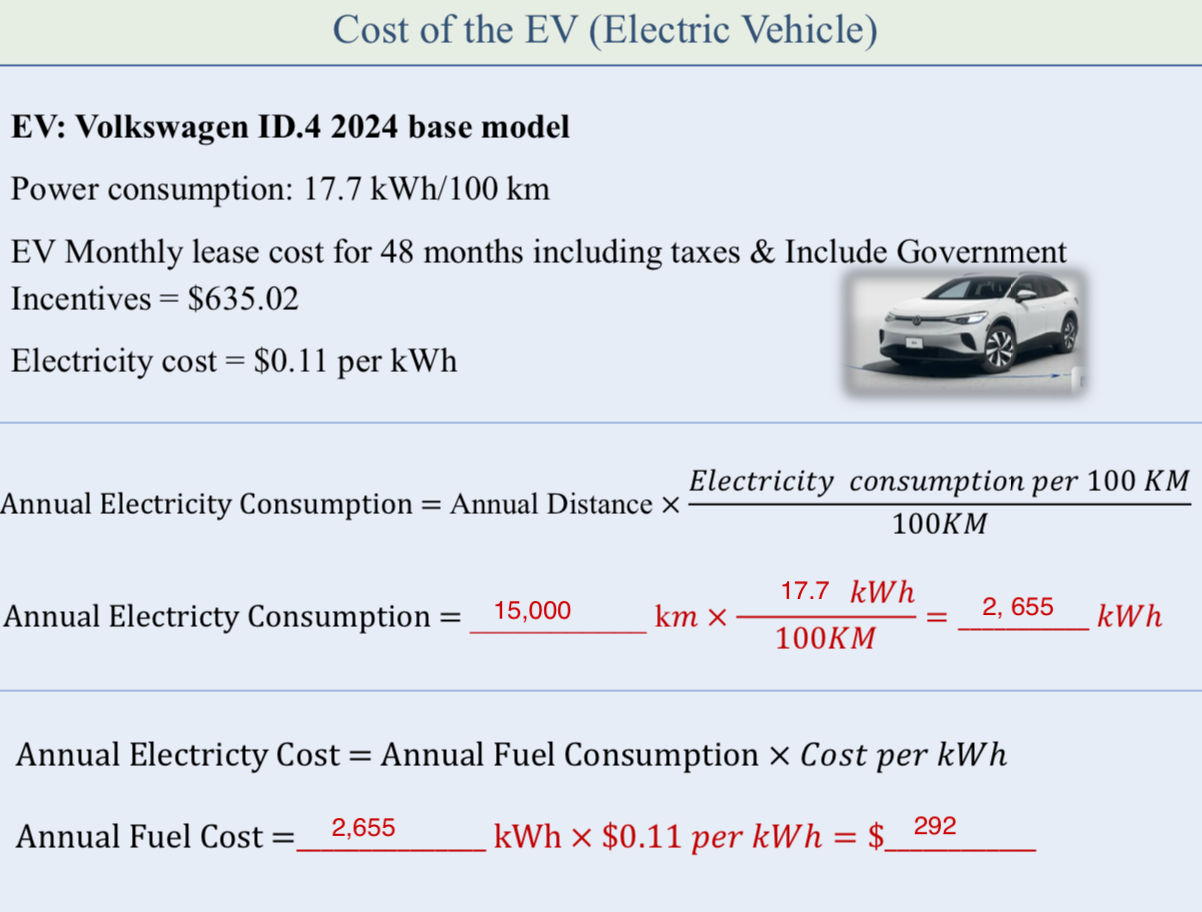
Analyzing purchase decision — Electric car vs Gas car
how to calculate annual fuel/electricity consumption/cost :
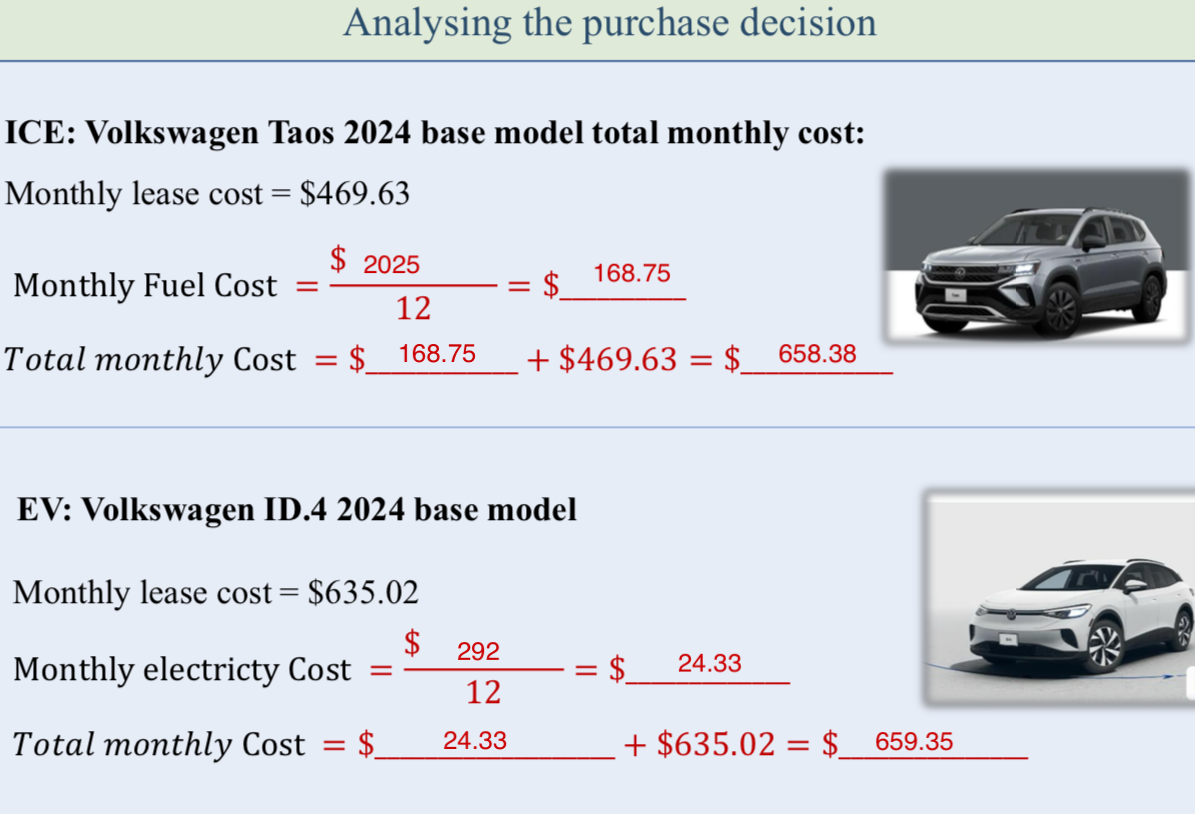
— How can the government change the incentives to encourage potential car buyers to purchase and EV instead of an ICE vehicle?
→ increase subsidies : reduce the upfront costs of EVs
→ reduced registration fees : lower or waive fees for EVs
→ higher fuel taxes : increasing taxes on gasoline and diesel can make operating internal combustion engine (ICE) vehicles more expensive
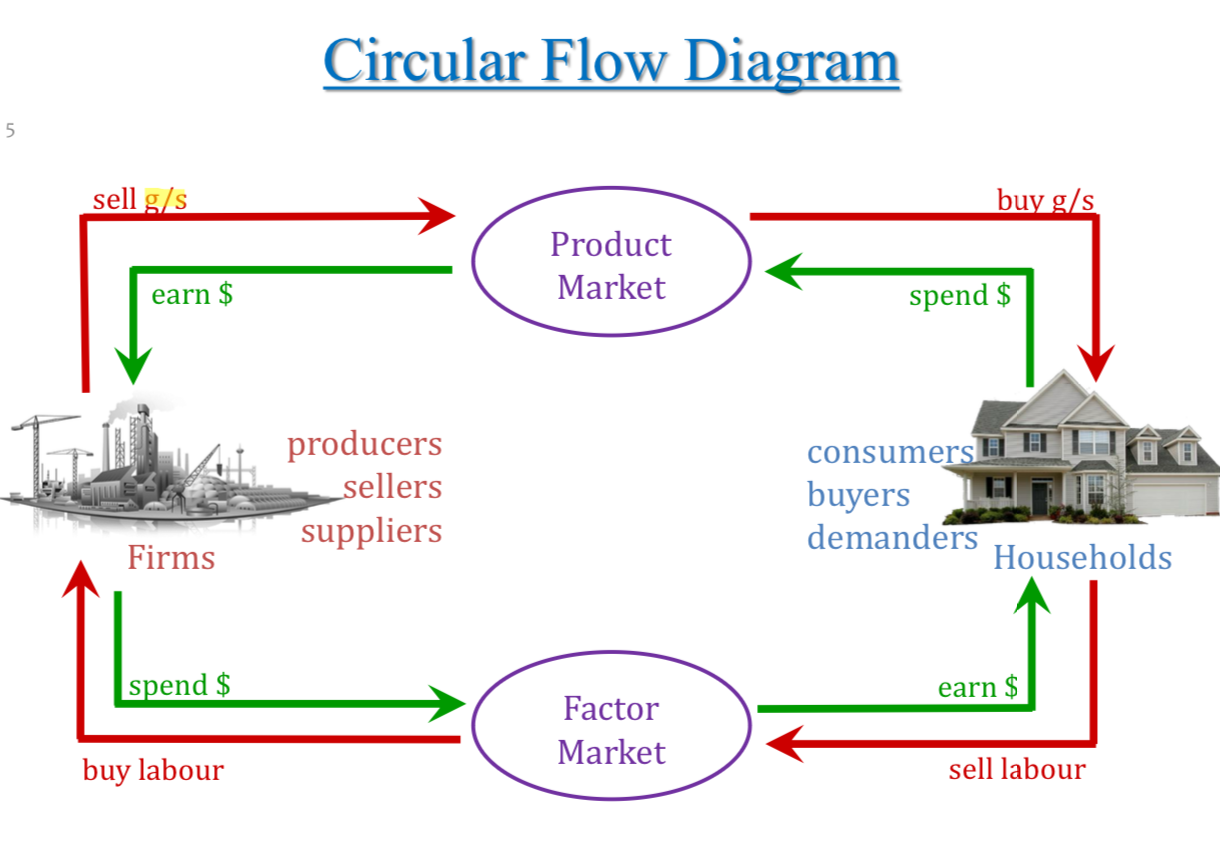
Chapter #2 - Circular Flow Diagram
Circular Flow Diagram
→ a model that shows the flow of resources and income between firms and households
households : decide what resources to sell and which good & services to buy
firms : decide what resources to buy and which good & services to sell
— households and firms interact in a market
market : the mechanism that facilitates the exchange of resources, goods & services
— there are different markets in the economy
products market : a market where goods and services are bought and sold
factor market : a market where resources are bought and sold
— households and firms interact in the factor and product markets
in the factor market : households sell resources to firms
in the product market : households buy goods & services from firms
Chapter #2 - The Production Possibilities Curve
People face Tradeoffs
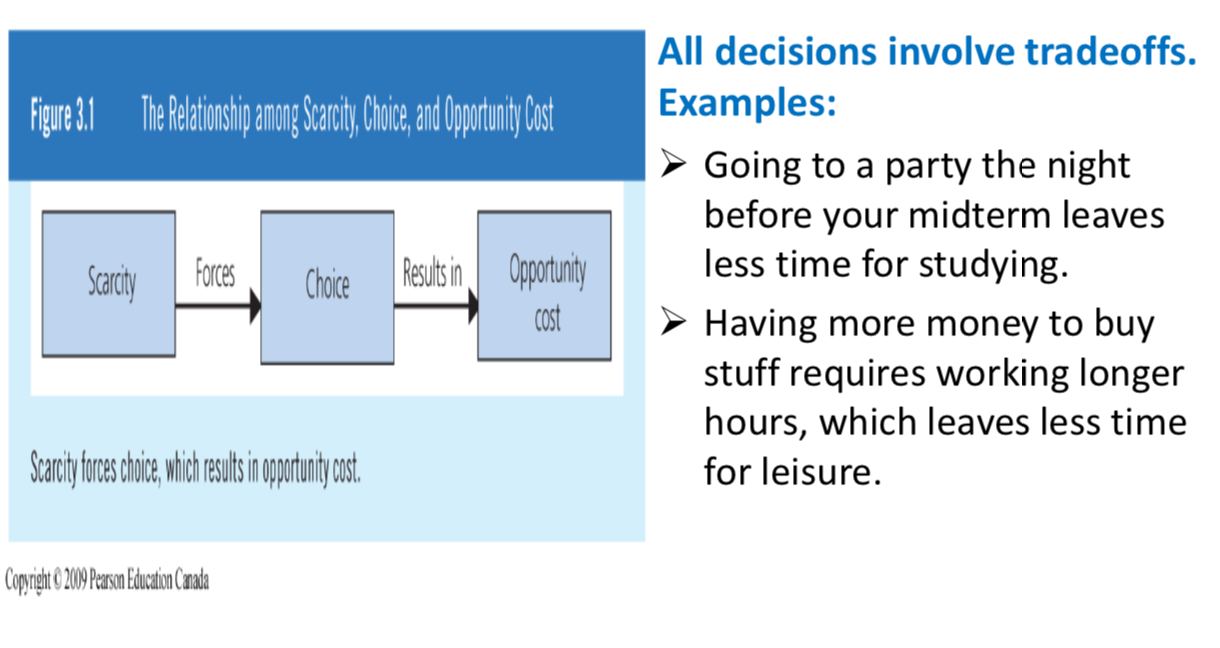
The Cost of Something is What you Give up to Get it
the opportunity cost of any actions is the the value of the best alternative that must be given up because a choice was made
ex : the the opportunity cost of…
…going to college for a year is not just the tuition, books and fees, but also the foregone wages
…seeing a movie is not just the price of the ticket, but the value of the time you spend in the theater
The Production Possibilities Curve
the Production Possibilities Curve : A curve that shows all possible production combinations of two goods that can be produced under the following assumptions :
1) The resources are fully employed producing just 2 goods/services
2) Production is measured over a specific period of time
3) The quantity & quality of resources are fixed over this period of time
4) Technology is fixed over this period of time
ex : 2 goods : computers and wheat
→ economy has 50,000 labour hours per month available for production
→ producing one computer requires 100 hours of labour
→ producing one ton of wheat requires 10 hours of labour
PPF example :
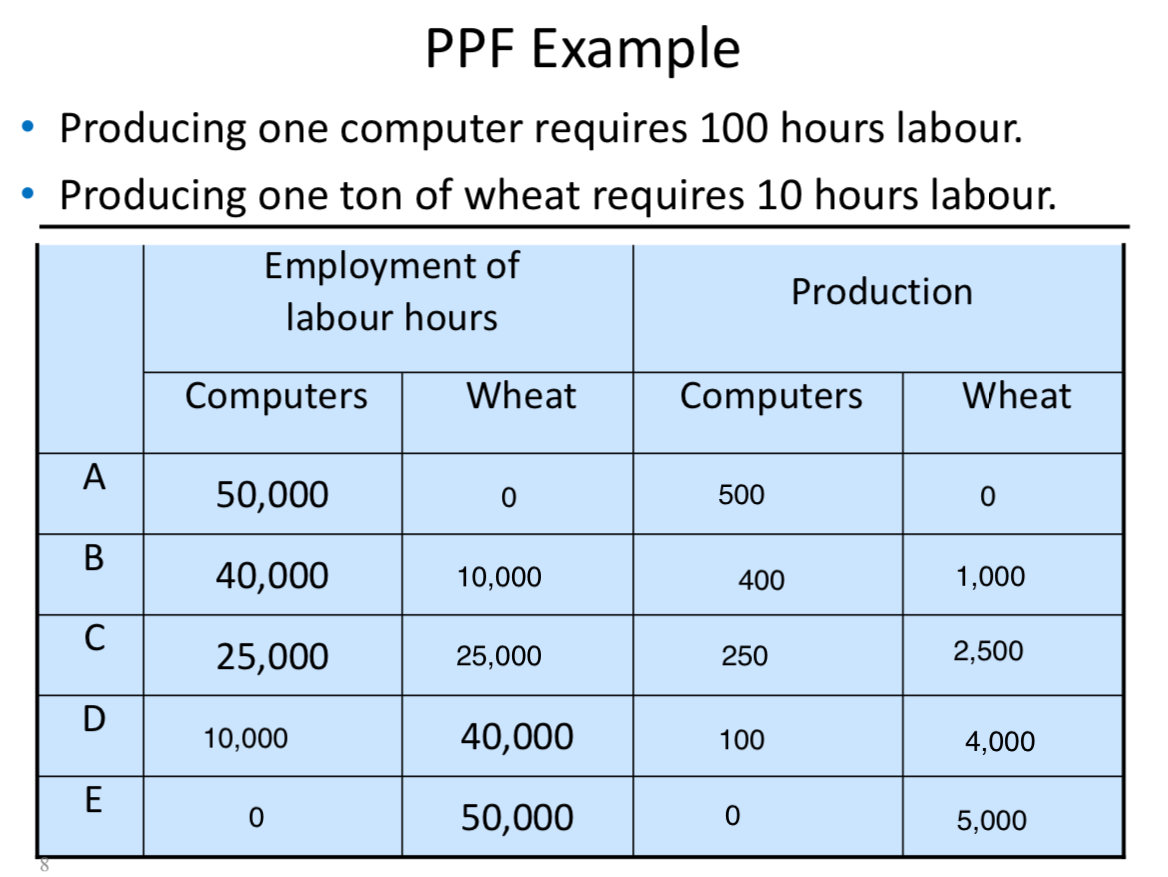
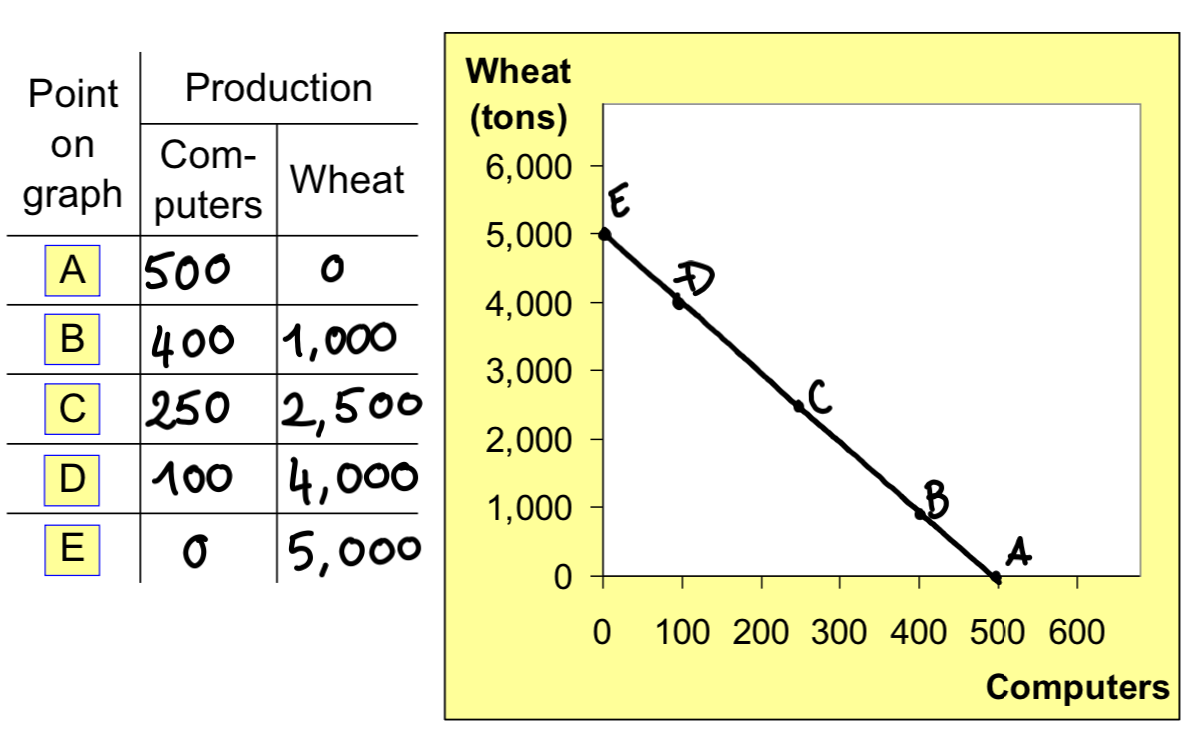
Points on the PPC (like A - E) :
possible
efficient : all resources are fully utilized
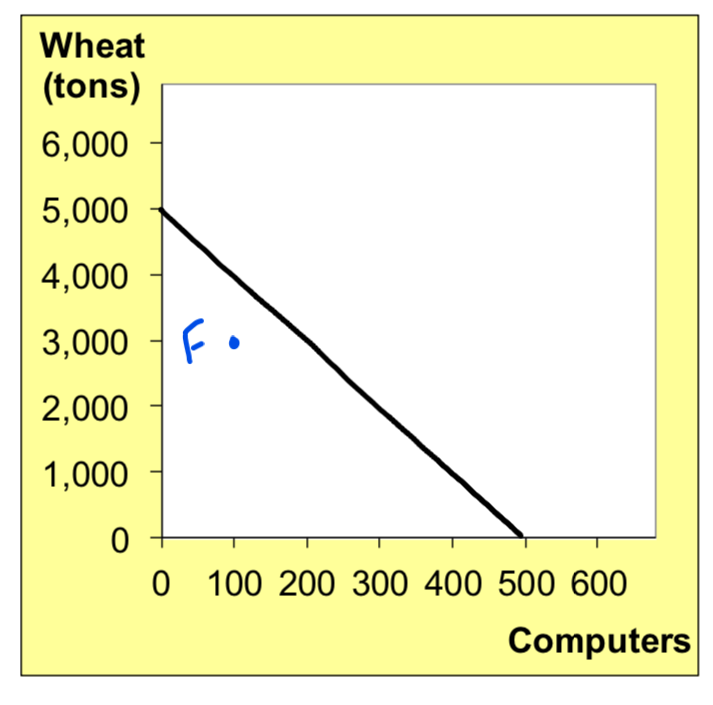
Points under PPC (like F) :
Possible
but not efficient : some resources are under utilized (workers unemployed, factories unused)
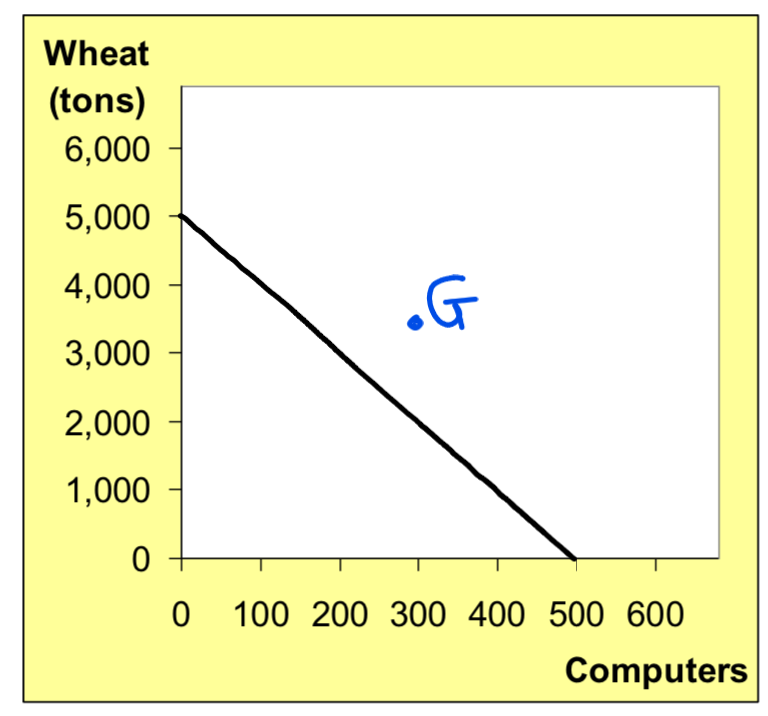
Points above PPC (like G) :
not possible
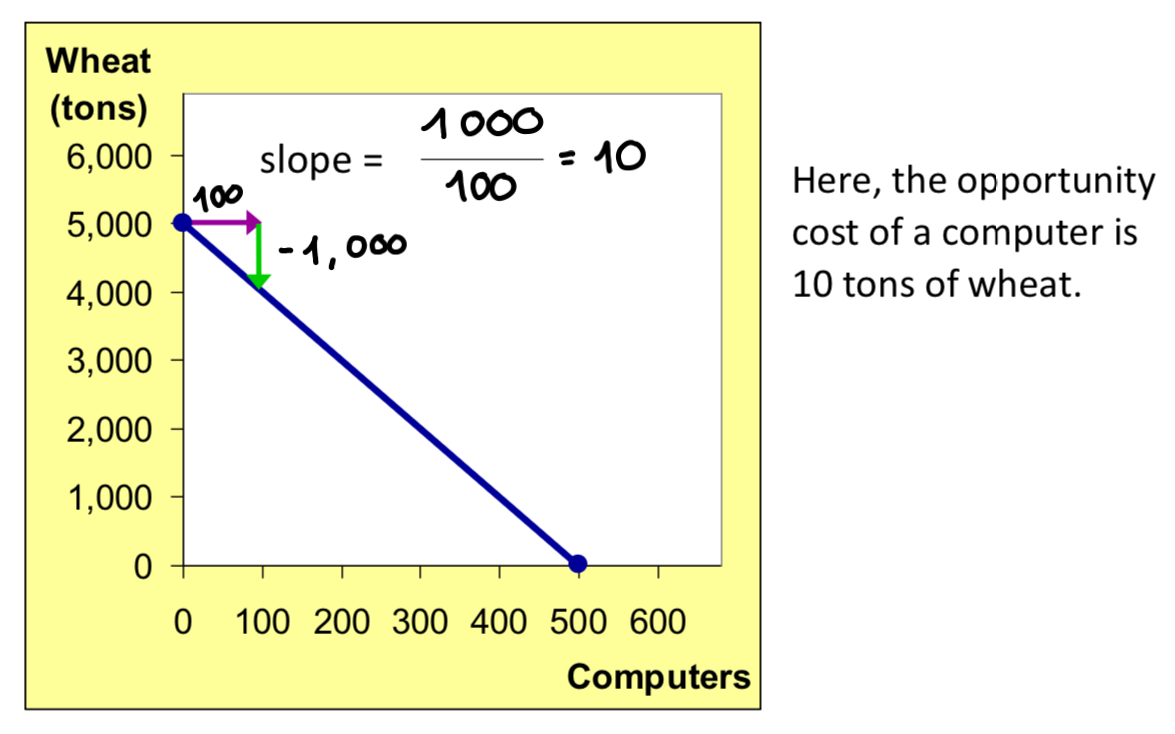
The PPC & Opportunity Cost
— Recall : the opportunity cost of an item is what must be given up to obtain that item
Moving along a PPC involves shifting resources (ex : labour) from the production of one good to the other
Society faces a tradeoff : getting more of one good requires sacrificing some of the other
The slop of the PPC tells you the opportunity cost of one good in terms of the other
A few very important points; you might want to take note of them:
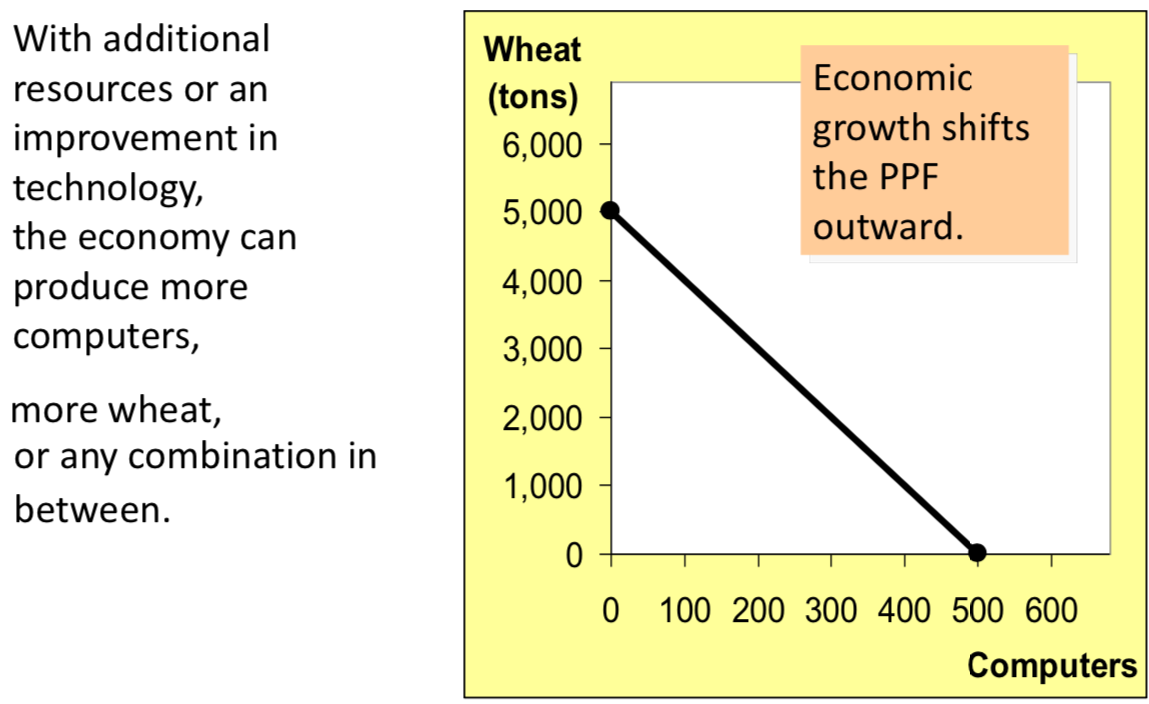
The PPC shifts whenever there is a change in how much resources, skills or technology we have.
The PPC is not about whether or not we are actually using our resources, skills and technology. It's about how much we could produce if we were to use them fully.
If we start using some of the unused resources, skills or technology that we already had before, then there is no change in our production capacity, and no shift in the PPC
Economic Growth and the PPC
The Shape of the PPC
The PPC could be a straight line, or concave
Depends on what happens to opportunity cost as the economy shifts resources from one industry to the other
If the opportunity cost remains constant, the PPC is a straight line
If opportunity cost of a good rises as the economy produces more of the good which is more likely the case, then the PPC is concave bow-shaped
ex :
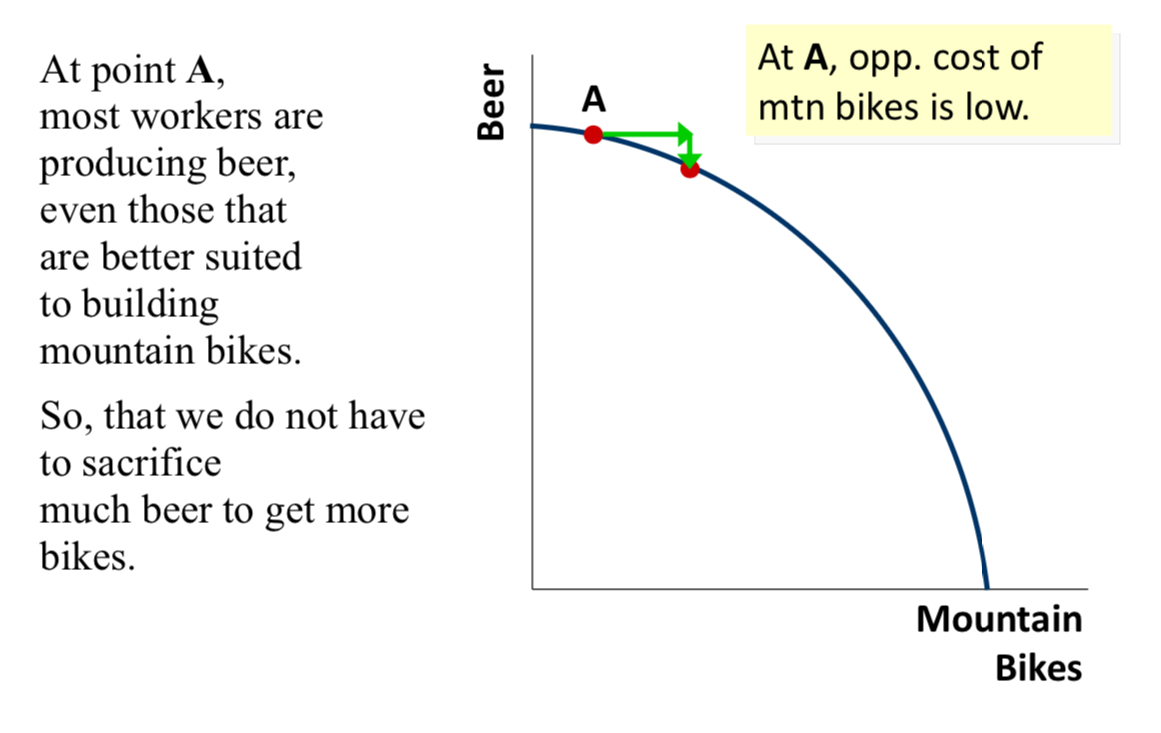
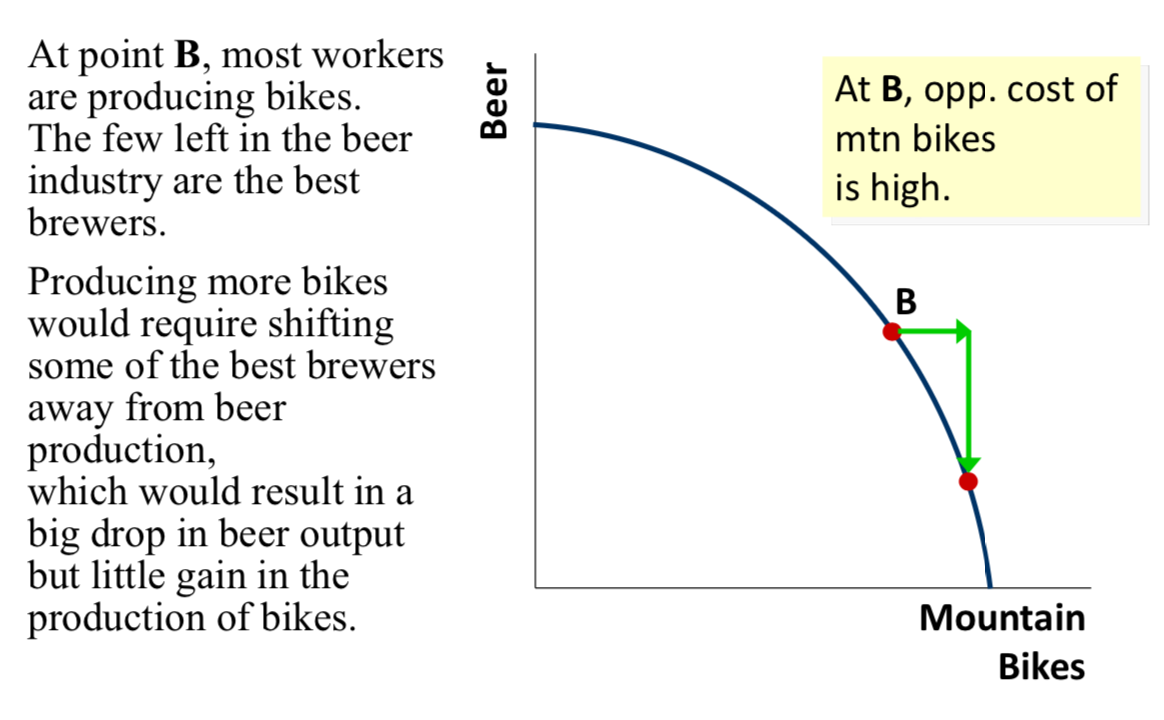
— why the PPC might be bow-shaped
Some resources are less adaptable to alternative uses
As more of a product is produced. Less adaptable resources are used
The production of additional units becomes increasingly more costly
So, PPC is concave when different workers have different skills, which results in different opportunity costs of producing one good in terms of the other
SUMMARY
the PPC illustrates the concepts of tradeoff and opportunity cost, efficiency and inefficiency, unemployment, and economic growth
a concave PPC illustrates the concept of increasing opportunity cost
Helpful Tools for Studying Economics - Appendix 1A
Functions
→ a function expresses a relationship between two or more variables
y = f (x)
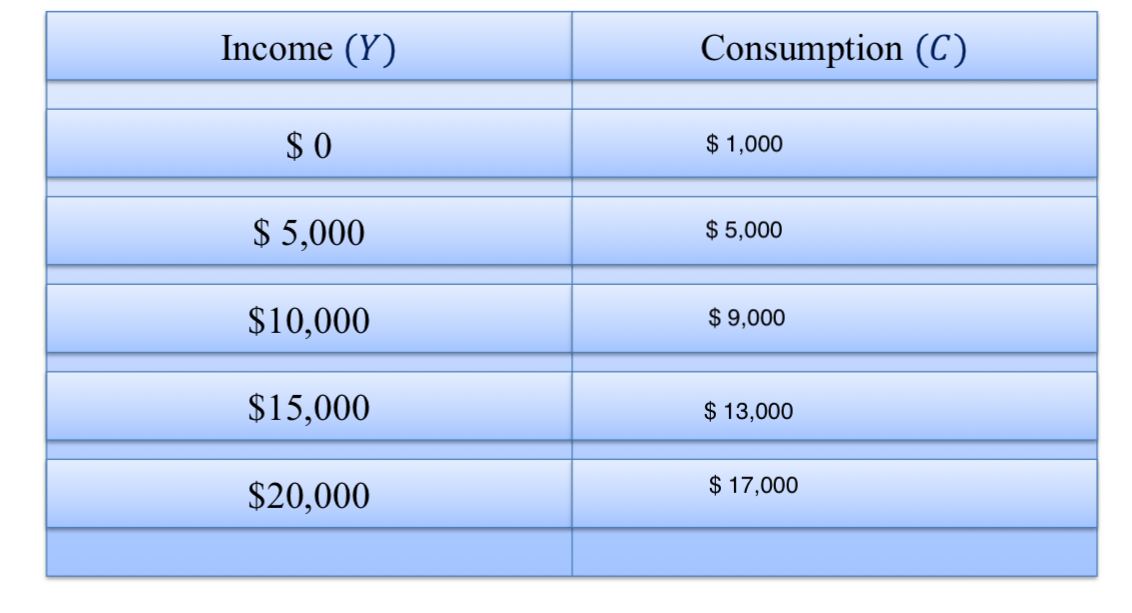
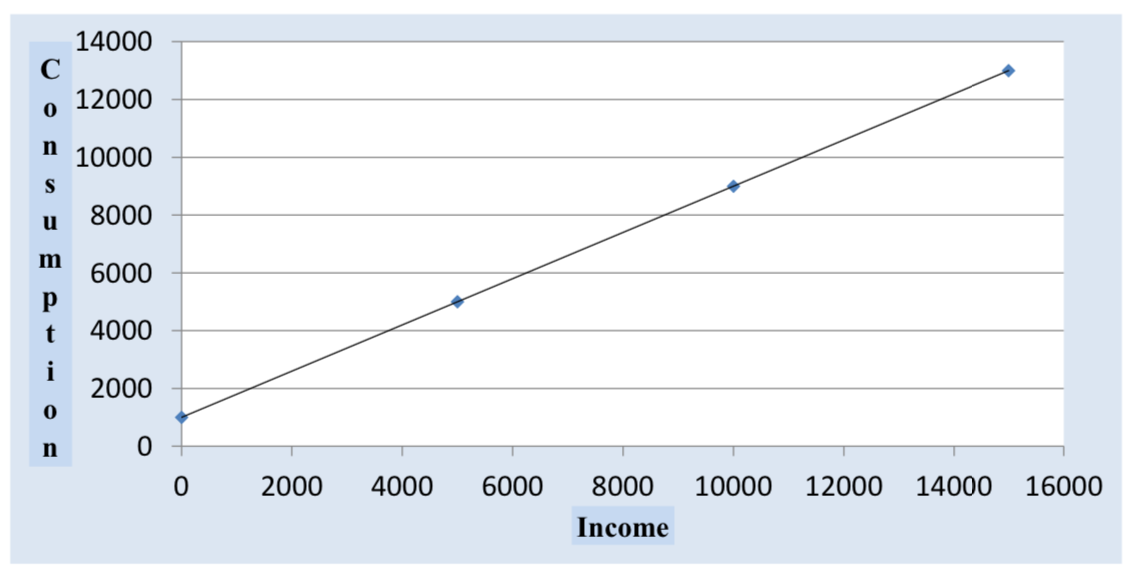
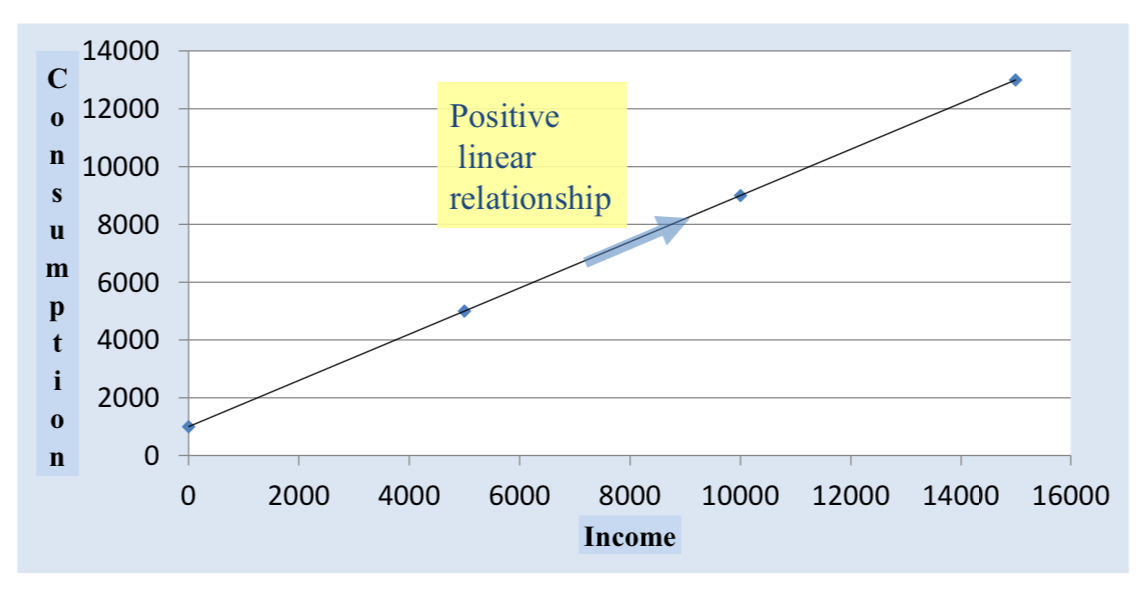
Example: The relationship between an individuals annual income and the amount of money that person spends on goods & services (G&S)
— verbally : When income is zero, the person will spend $1000 a year, and for every extra $1 of income the person will increase spending by $0.80
— mathematically : Where C stands for the amount of money the consumer spends on Goods & Services, and Y stands for income
C = $1000 + 0.8Y
— table :
— graph :
Graphs used in Economics
graphs are used in economic to show the relationship between variables
different patterns in graphs :
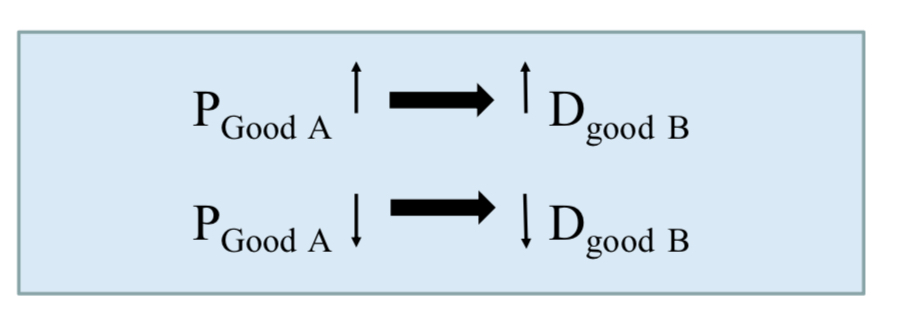
→ variables move in the same direction
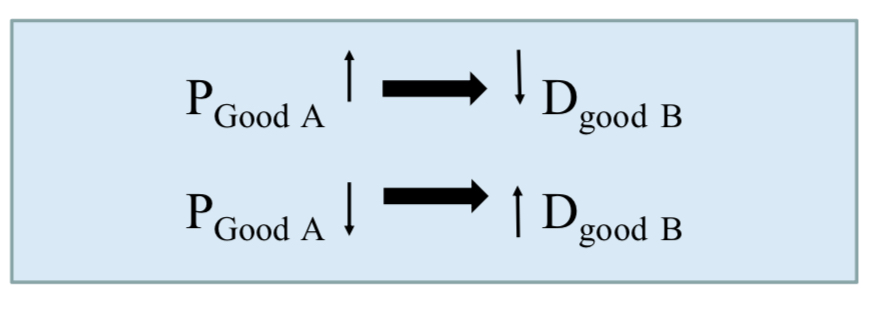
→ variables move in opposite directions
— variables that move in the same direction :
→ a relationship between two variables that move in the same direction is called a positive relation
→ a line that slopes upward upward shows a positive relationship
→ a relationship shown by a straight line is called a linear relationship
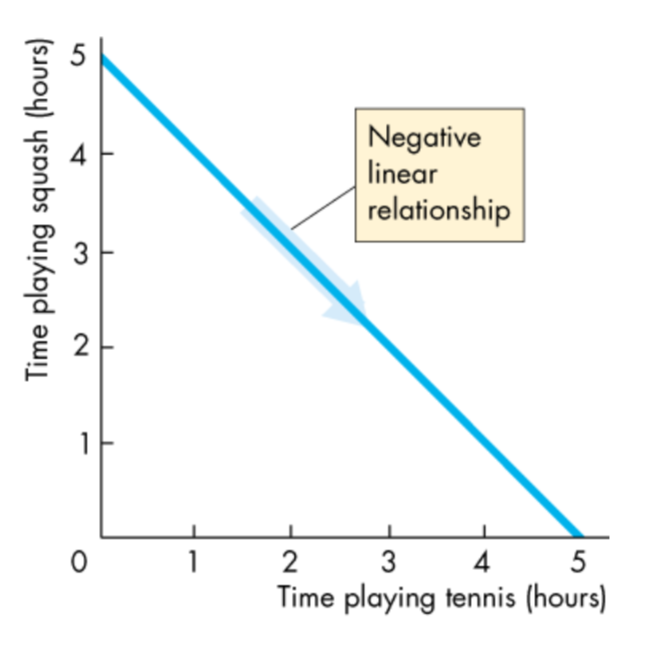
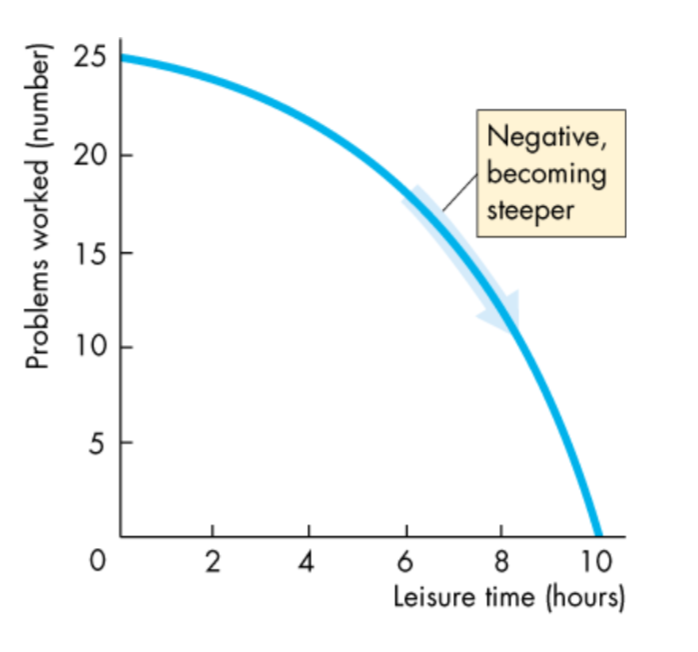
— variables that move in the opposite directions :
→ a relationship between two variables that move in opposite directions is called a negative relationship
→ a line that slopes downward shows a negative relationship
Slope of a Relationship
→ the slope shows you how much one variable changes as the other changes
use the Greek letter Δ (capital Delta) to represent “change in”
so Δy equals to the change in the value of the variable measured on the y-axis and Δx equals to the change in the value of the variable measured on the x-axis
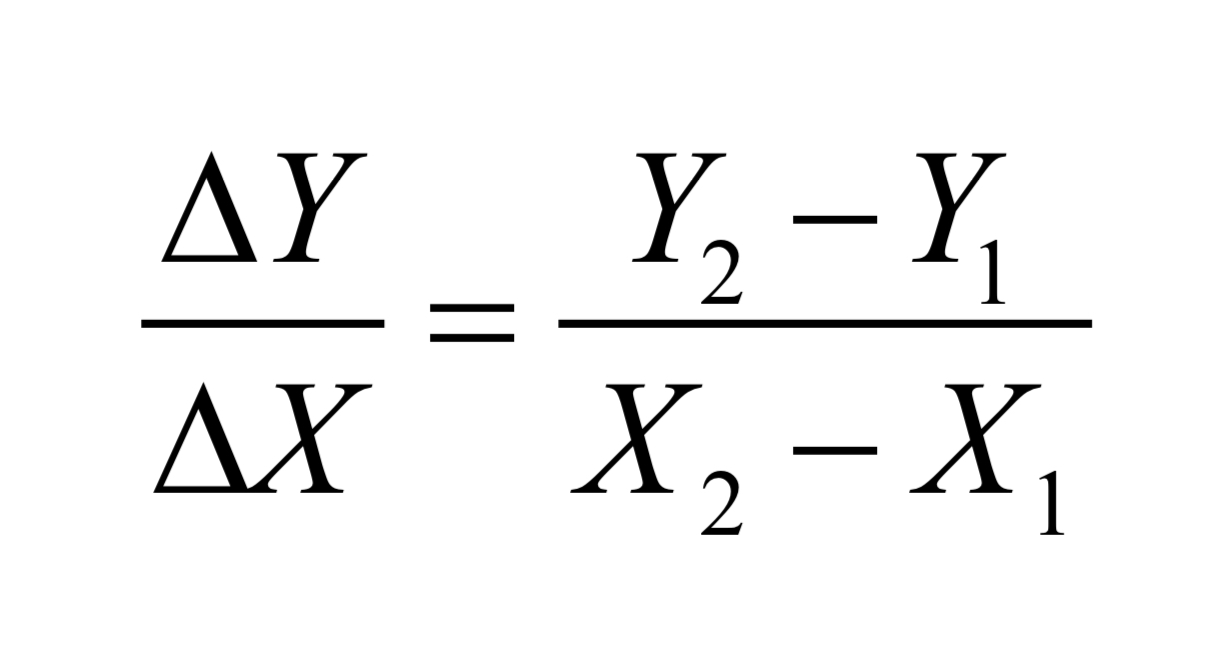
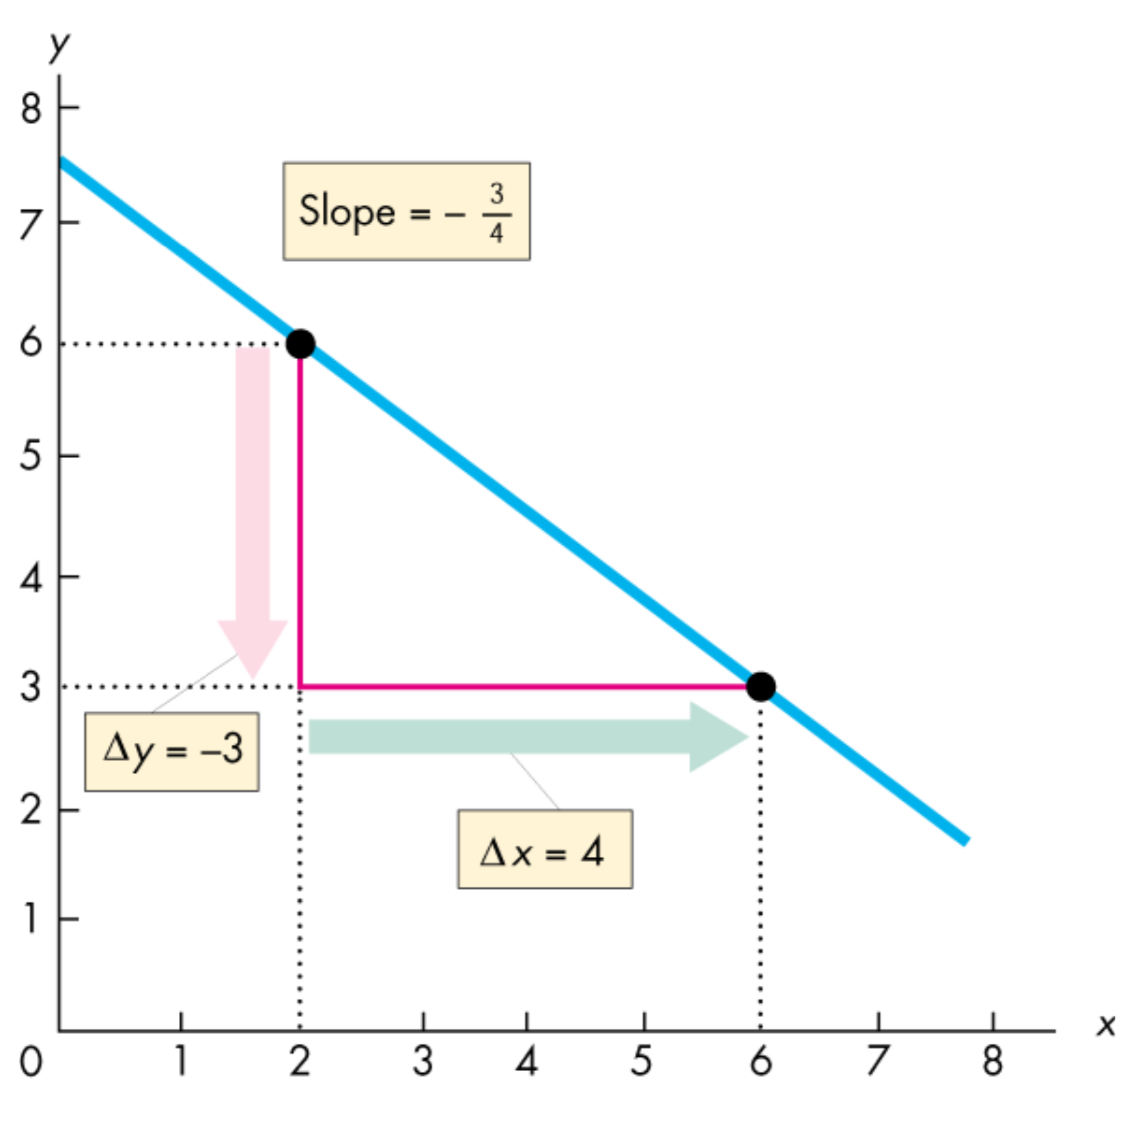
The slope of a straight line
→ the slope of a straight line is constant
→ graphically the slope is calculated as the “rise” over the “run”
— the slope is positive if the line is upward sloping (goes up)
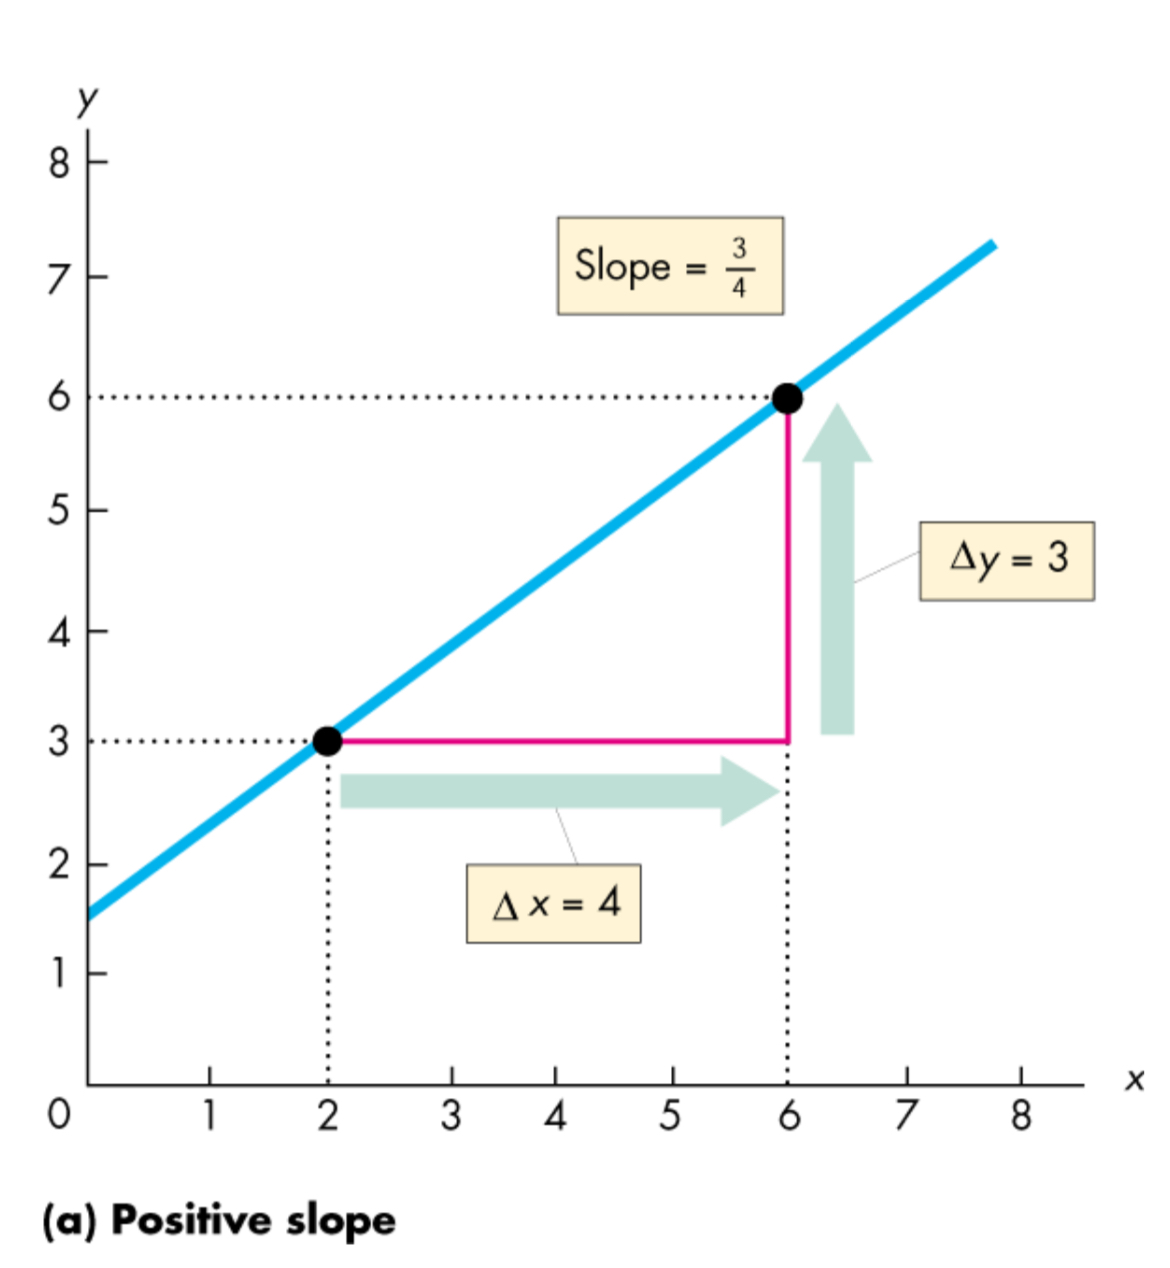
— the slope is negative if the line is downward sloping (goes down)
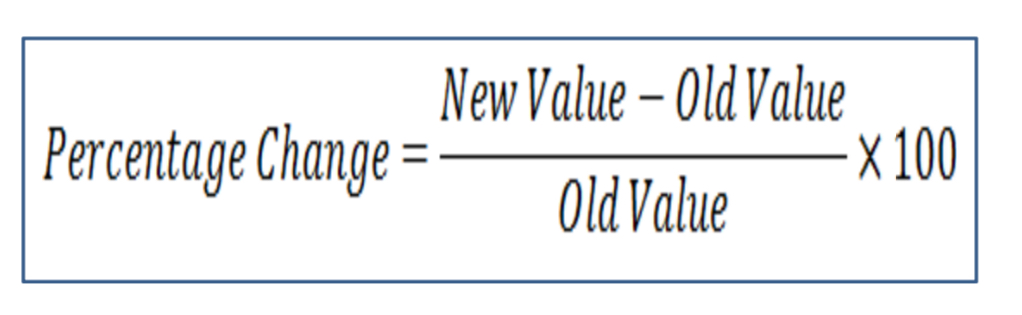
Percentage Change
percentage gives us a clearer sense of the magnitude of the change
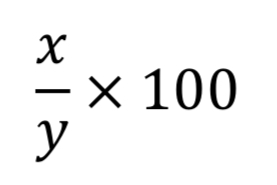
Expressing one number as a percentage of another number
to express one number (x) as percentage of another number (y), we divide the first number by the second number and multiply by 100
Chapter #3 - Demand & Supply
PT. 1
Markets
Market = Demand + Supply
the interaction of buyers & sellers
the exchange of goods & services
free market : where buyers & sellers can choose what is best for themselves without manipulation or coercion by the government
free markets always converge to equilibrium
if we are not at equilibrium, competition among buyers or sellers will lead us back to equilibrium → invisible hand
Demand
Demand = Buyers = Consumers
the quantity demanded of any good is the amount of the good that buyers are willing and able to purchase
Law of demand : the claim that, other things equal, the quantity demanded of a good falls when the price of good rises
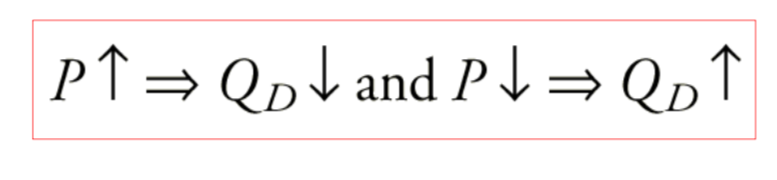
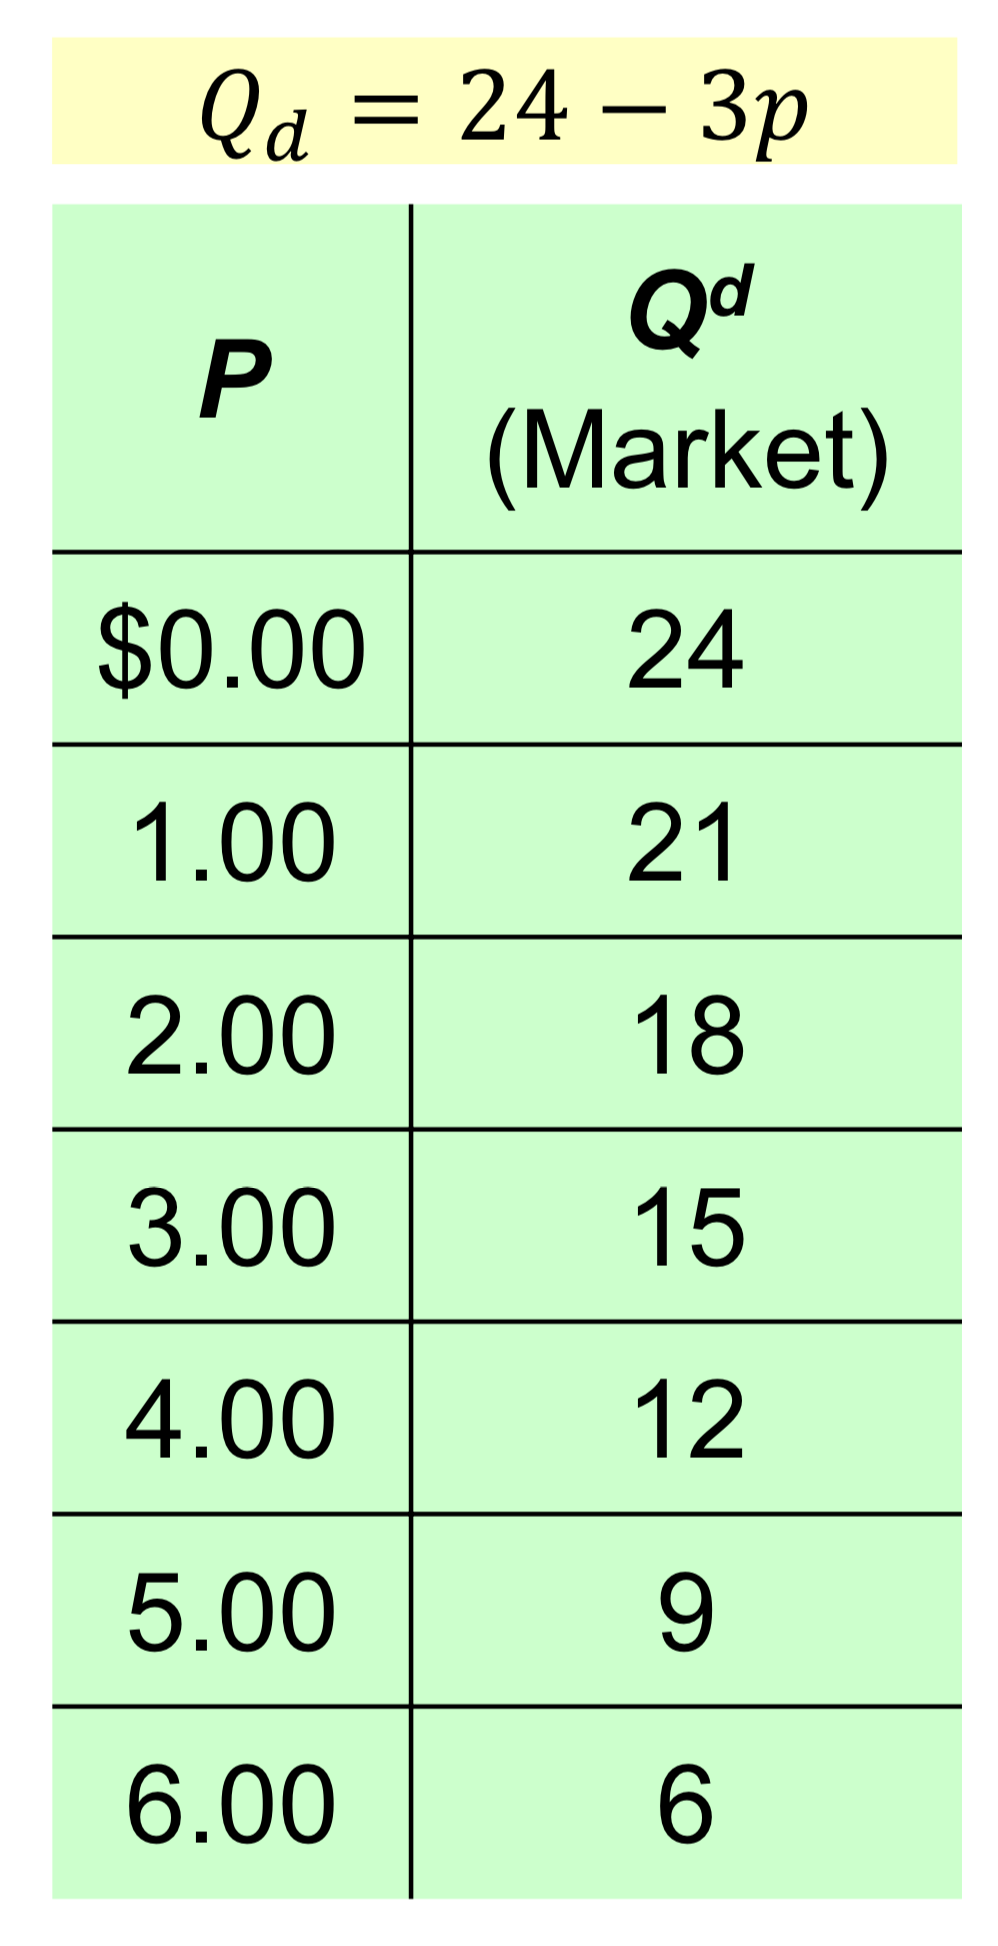
Demand Schedule
demand schedule : a table that shows the relationship between the price of a good and the quantity demanded
ex : demand for lattes
(notice that the market for lattes obey the Law of Demand)
The Market Demand Curve for Lattes
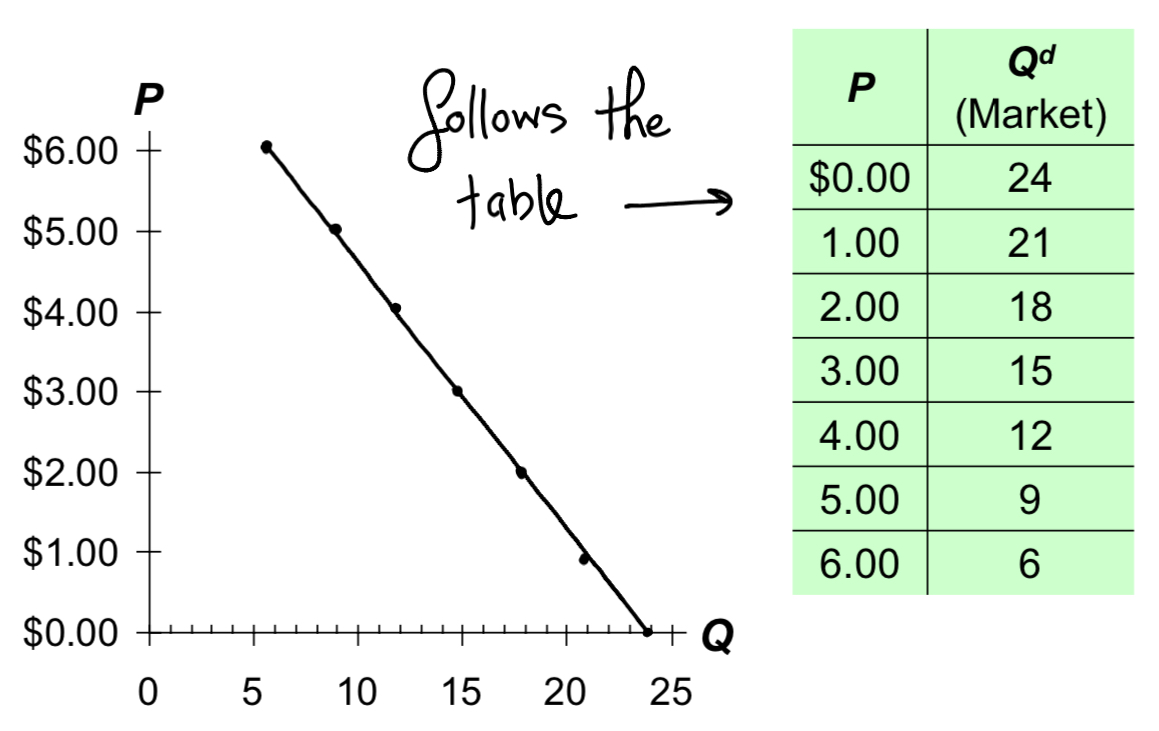
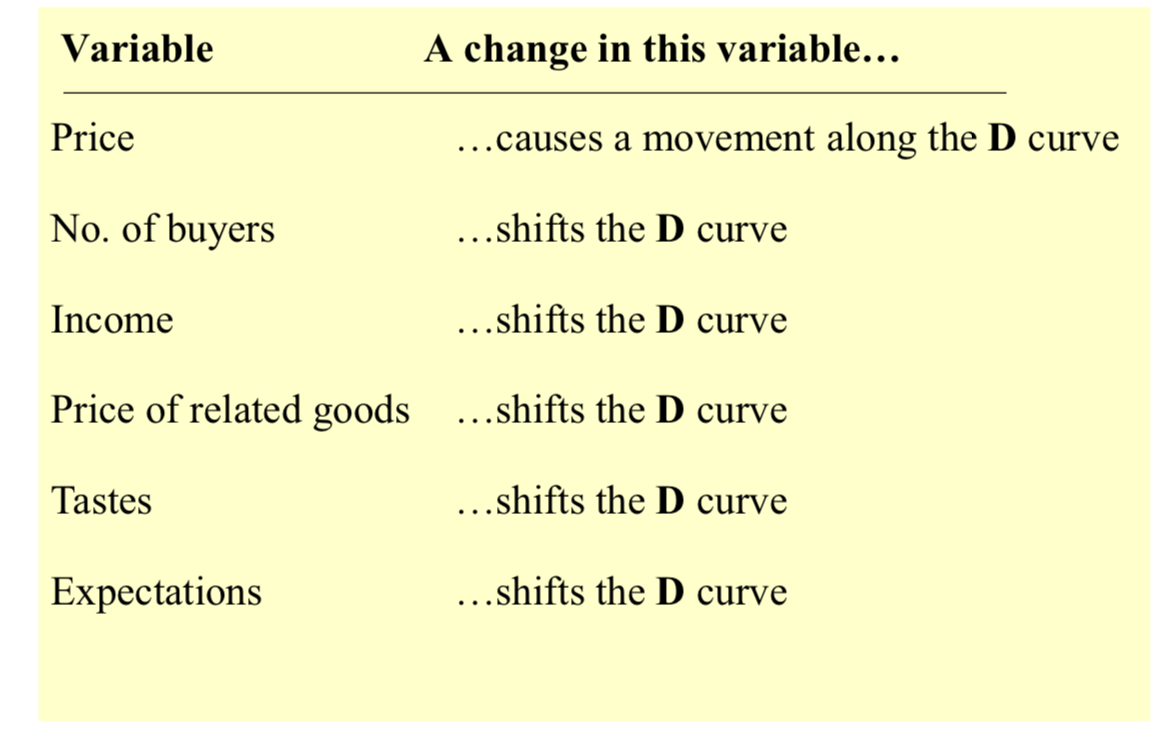
Demand Curve Shifters
the demand curve shows how price affects quantity demanded, other things being equal
These “other things” are non-price determinants of demand (ex : things that determine buyer’s demand for a good, other than the good’s price)
changes in the shift the D curve
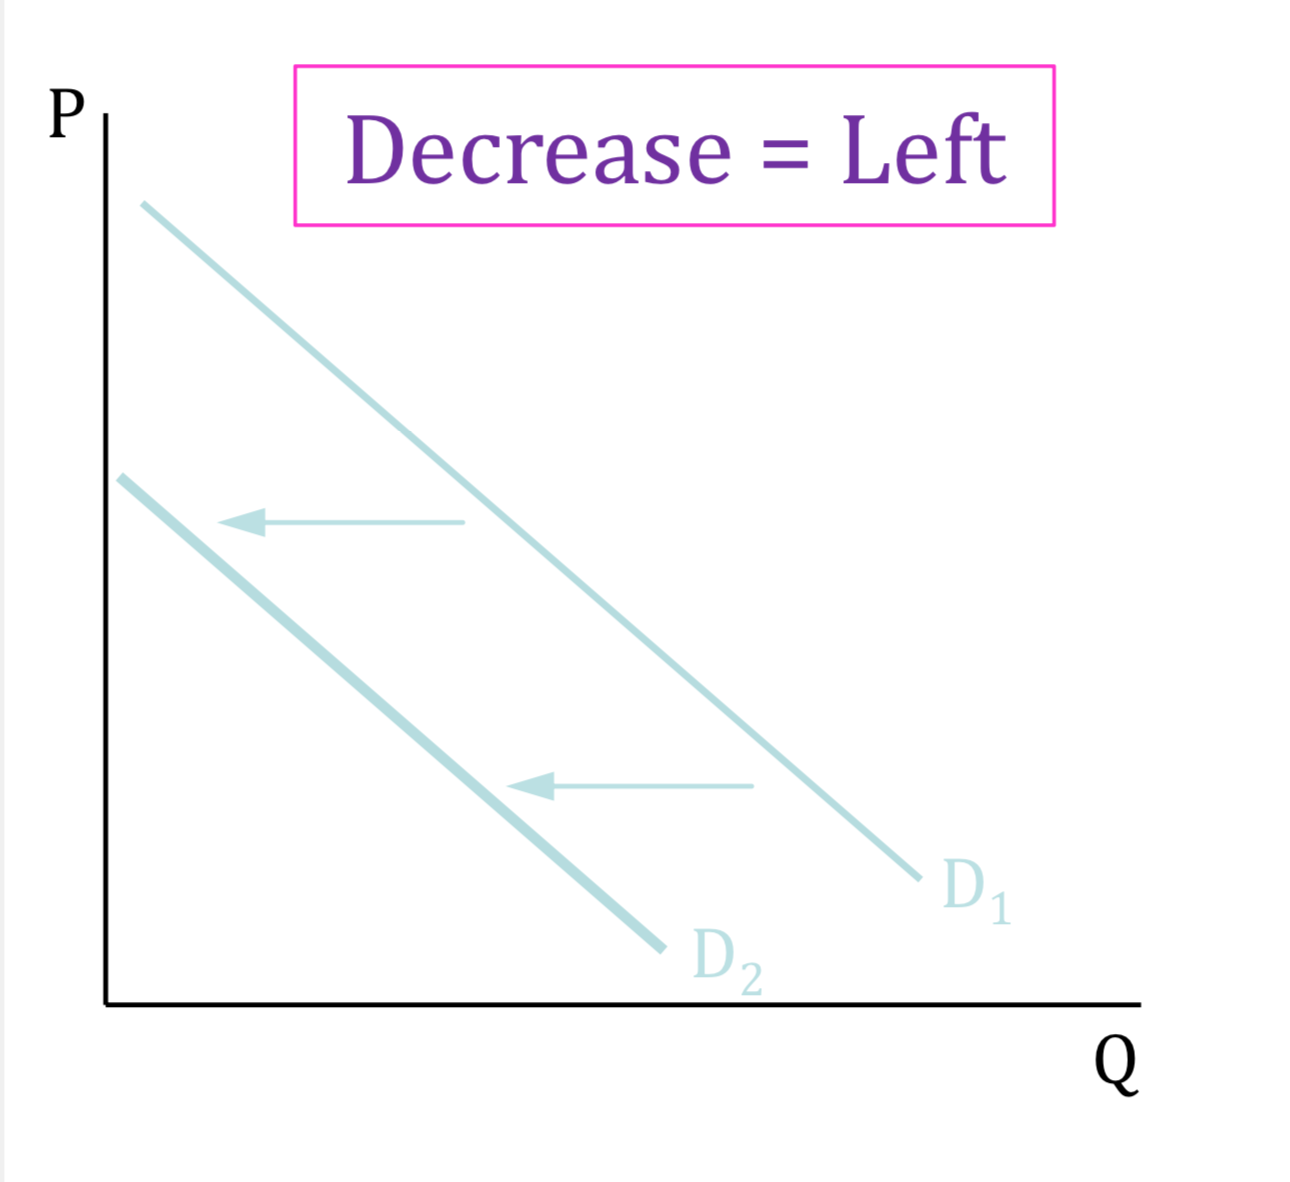
Shift of Demand
— If D (goes up/increase) : shift the demand curve to the right
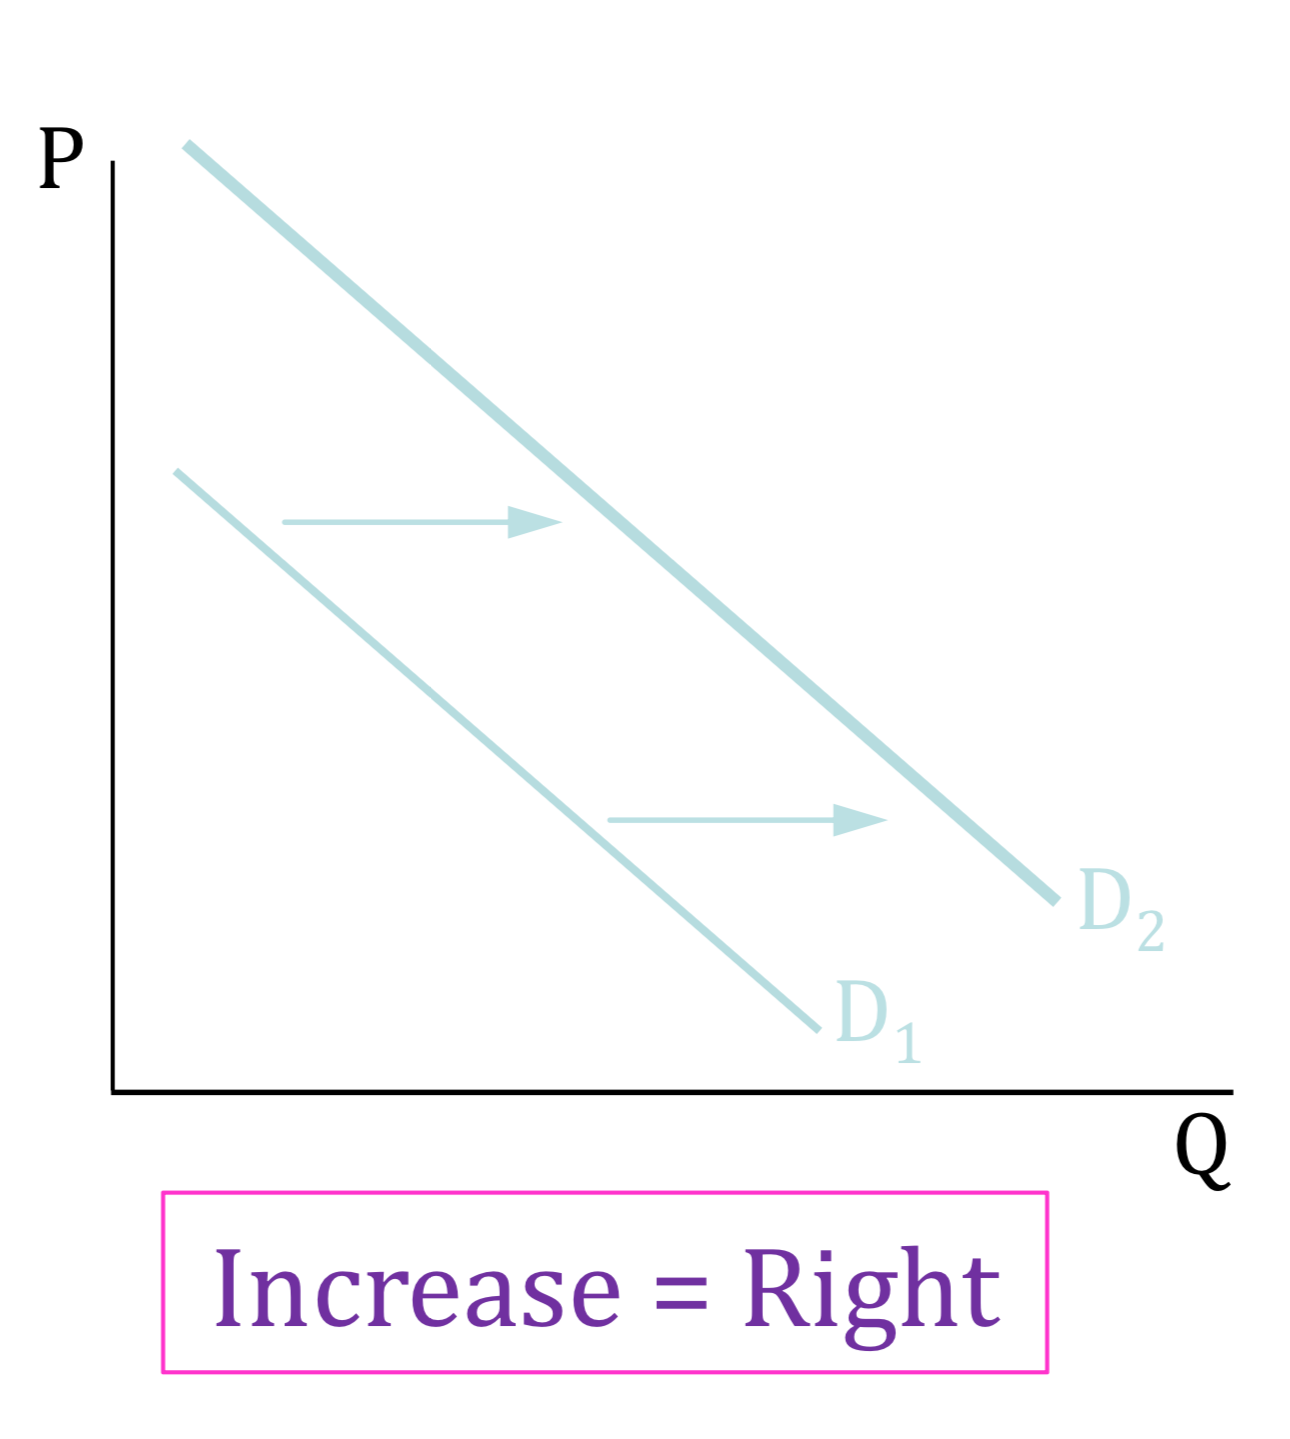
— if D (goes down/decrease) : shift the demand curve to the left
Demand Curve Shifters
number of buyers (population)
buyer’s incomes
price of related goods
buyer’s tastes
buyer’s expectations
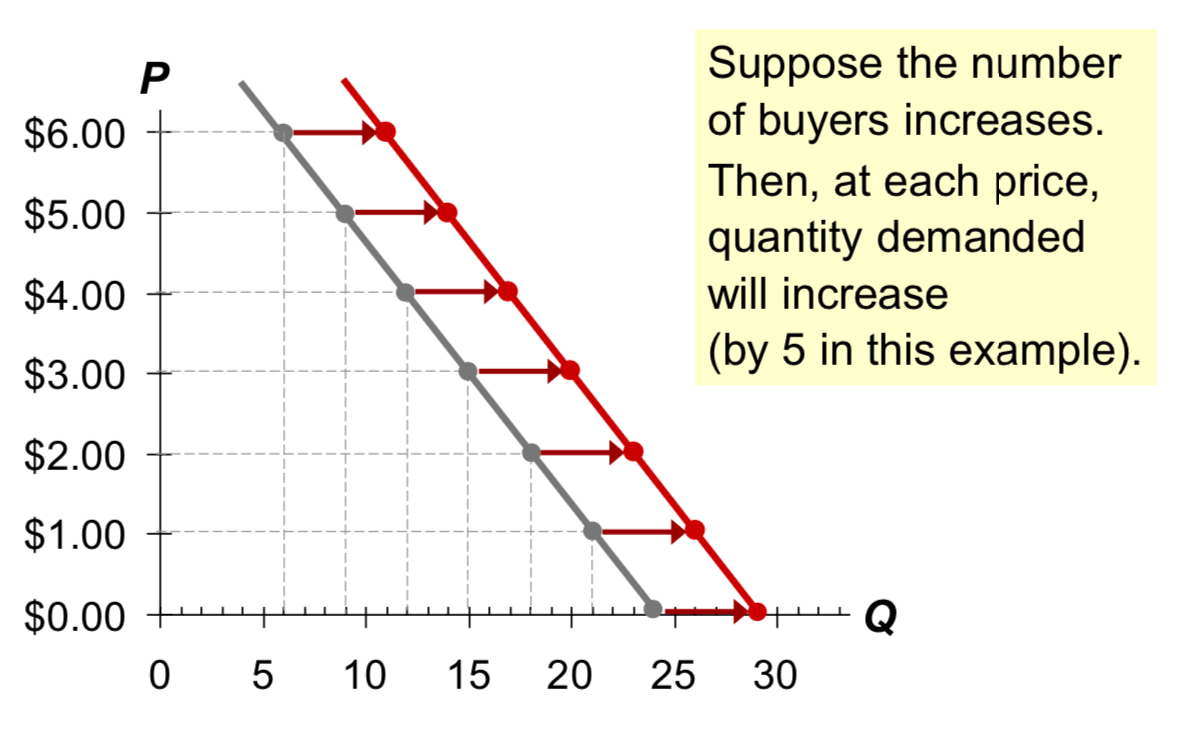
Demand Curve Shifters : Number of Buyers
An increase in the number of buyers (potential consumer population) causes an increase in quantity demanded at each price, which shifts the demand curve to the right
immigration
birth rate (long-run)
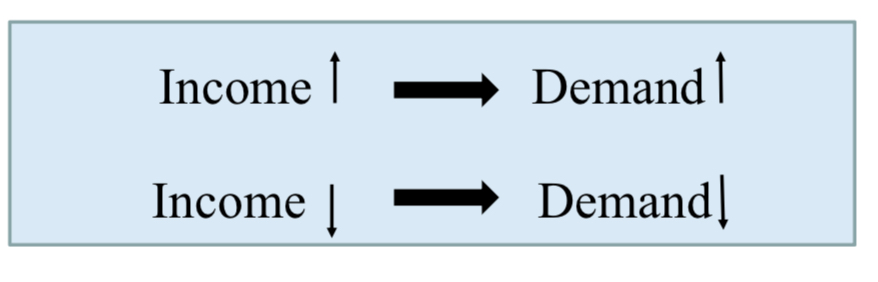
Demand Curve Shifters : Income
income : new job, promotion, inheritance
a good is a normal good if an increase (decrease) in buyer’s incomes causes an increase (decrease) in demand for that good
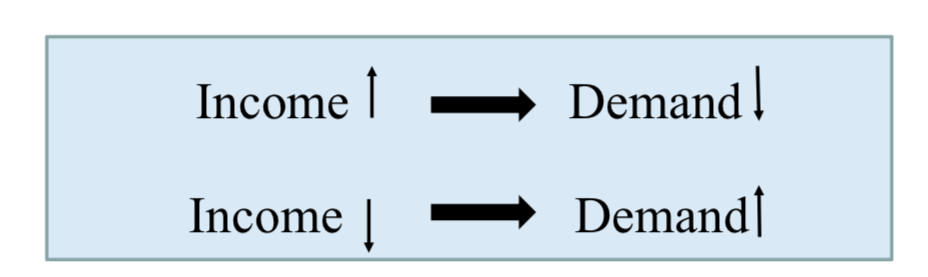
inferior goods : people would buy less of them if they had more money
for inferior goods, an increase (or decrease) in income leads to a decrease (or increase) in demand (ex : Kraft macaroni and cheese)
Demand Curve Shifters : Price of Related Goods
substitutes : two products that can be consumed instead of one another ; they serve the same purpose
ex : Coke & Pepsi — an increase in the price of Coke → increases demand for Pepsi, shifting the hamburger demand curve to the right
other examples : hamburger & pizza, Netflix & Prime, coffee & tea, etc.
2 goods are substitutes if an increase (decrease) in the price of one causes an increase (decrease) in the demand for the other
complements : 2 products that are consumed together, as a “package” (comes together)
ex : computers & software — if price of computers rises, people buy a fewer computers, and therefore less software, software demand curve shifts left
other examples : college tuition & textbooks, bagels & cream cheese, eggs & bacon
2 goods are complements if an increase (decrease) in the price of one causes an decrease (increase) in the demand for the other
Demand Curve Shifters : Tastes
tastes : anything that makes a product more or less popular
education
public awareness
reviews
advertisement
fashion
weather
anything that causes a shift in tastes towards a good will increase demand for that good and shift its D curve to the right
Demand Curve Shifters : Expectations
expectations affect consumer’s buying decisions
ex : you expect the price of toilet paper to rise, so you buy enough toilet paper to get through the next six months
SUMMARY — variables that affect demand
PT. 2
Supply
Supply = Sellers = Producers
the quantity supplied of any good is the amount that sellers are willing and able to sell
Law of supply : the claim that, other things equal, the quantity supplied of a good rises when the price of the good rises when the price of the good rises
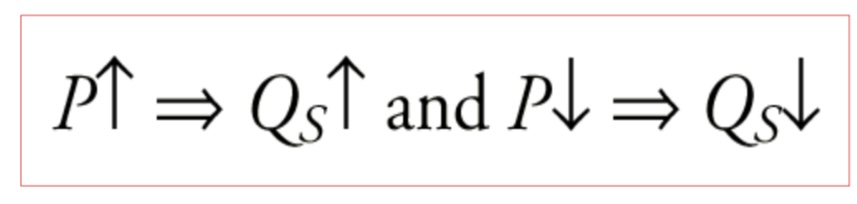
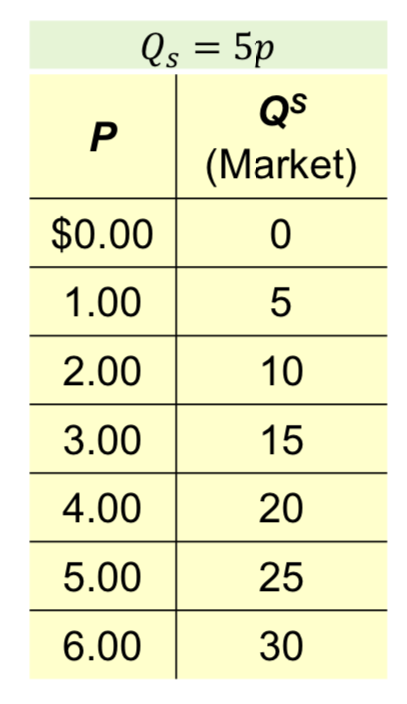
Supply Schedule
supply schedule : a table that shows the relationship between the price of a good and the quantity supplied
ex : supply of lattes
notice that the supply schedule obeys the Laws of Supply
The Market Supply Curve
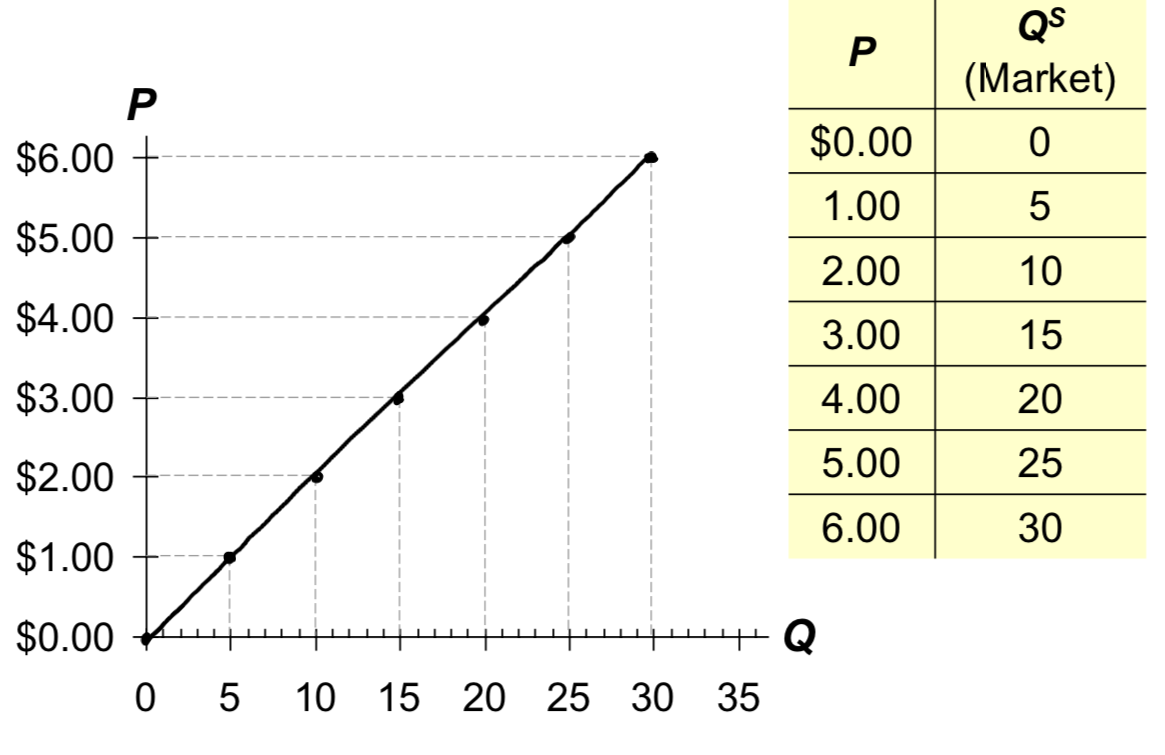
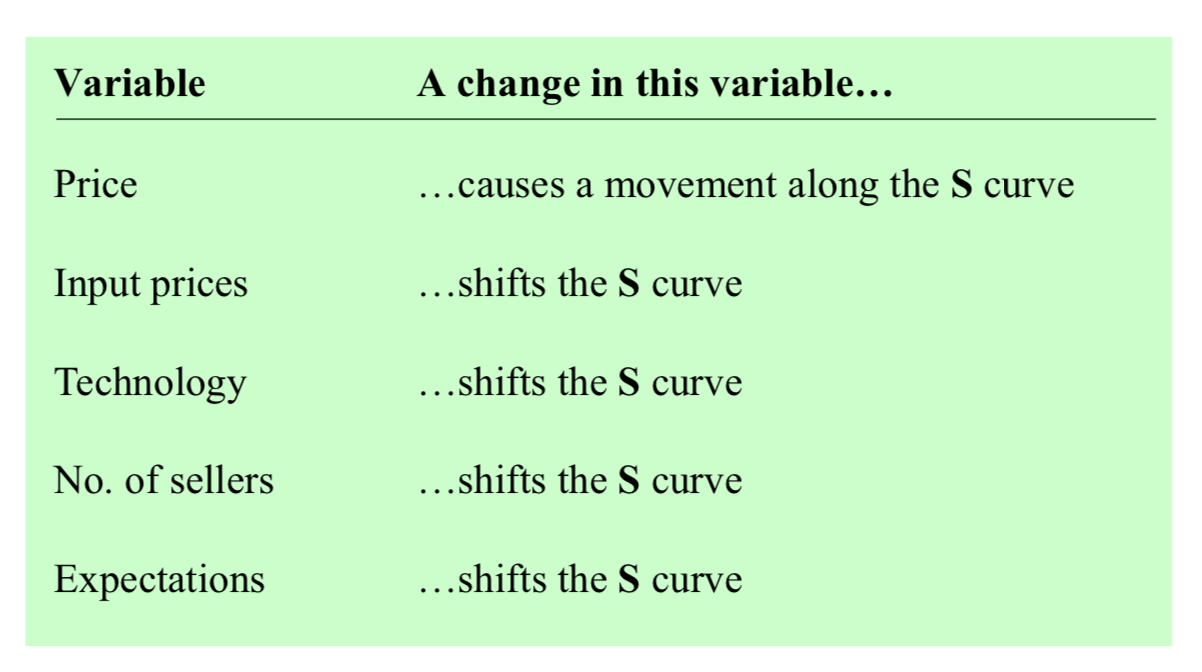
Supply Curve Shifters
the supply curve shows how price affects quantity supplied, other things being equal
these “other things” are non-price determinants of supply
changes in them shift the S curve
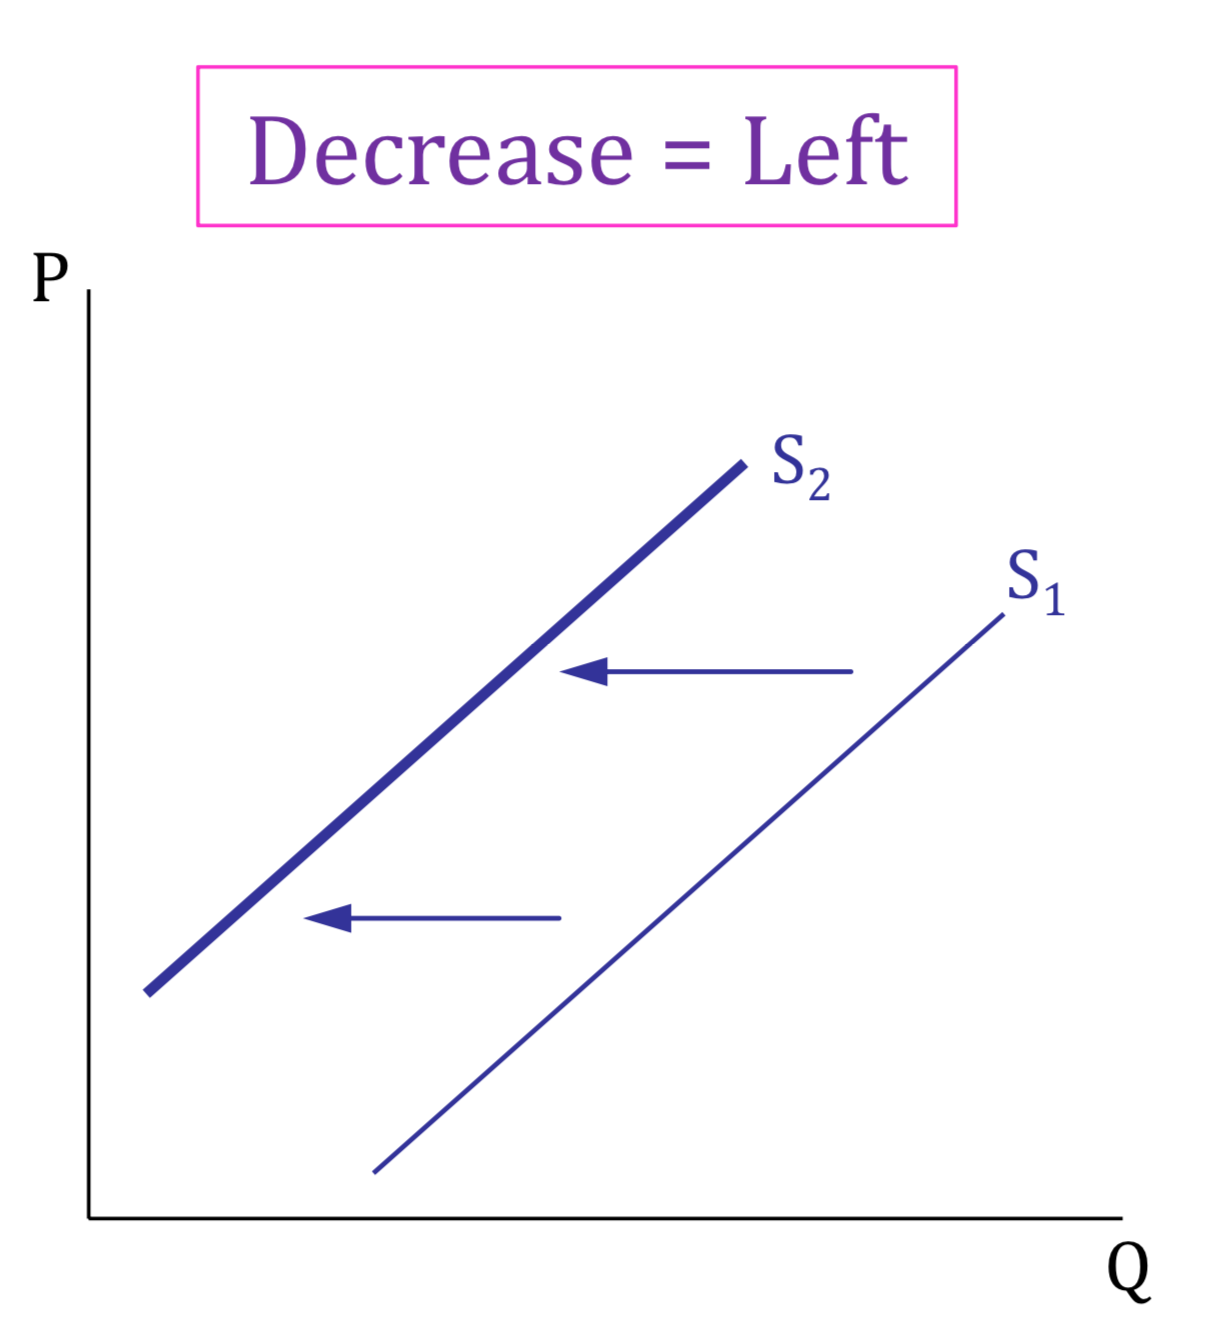
Shift of Supply
— if S (goes up/increase) : shift the supply curve to the right
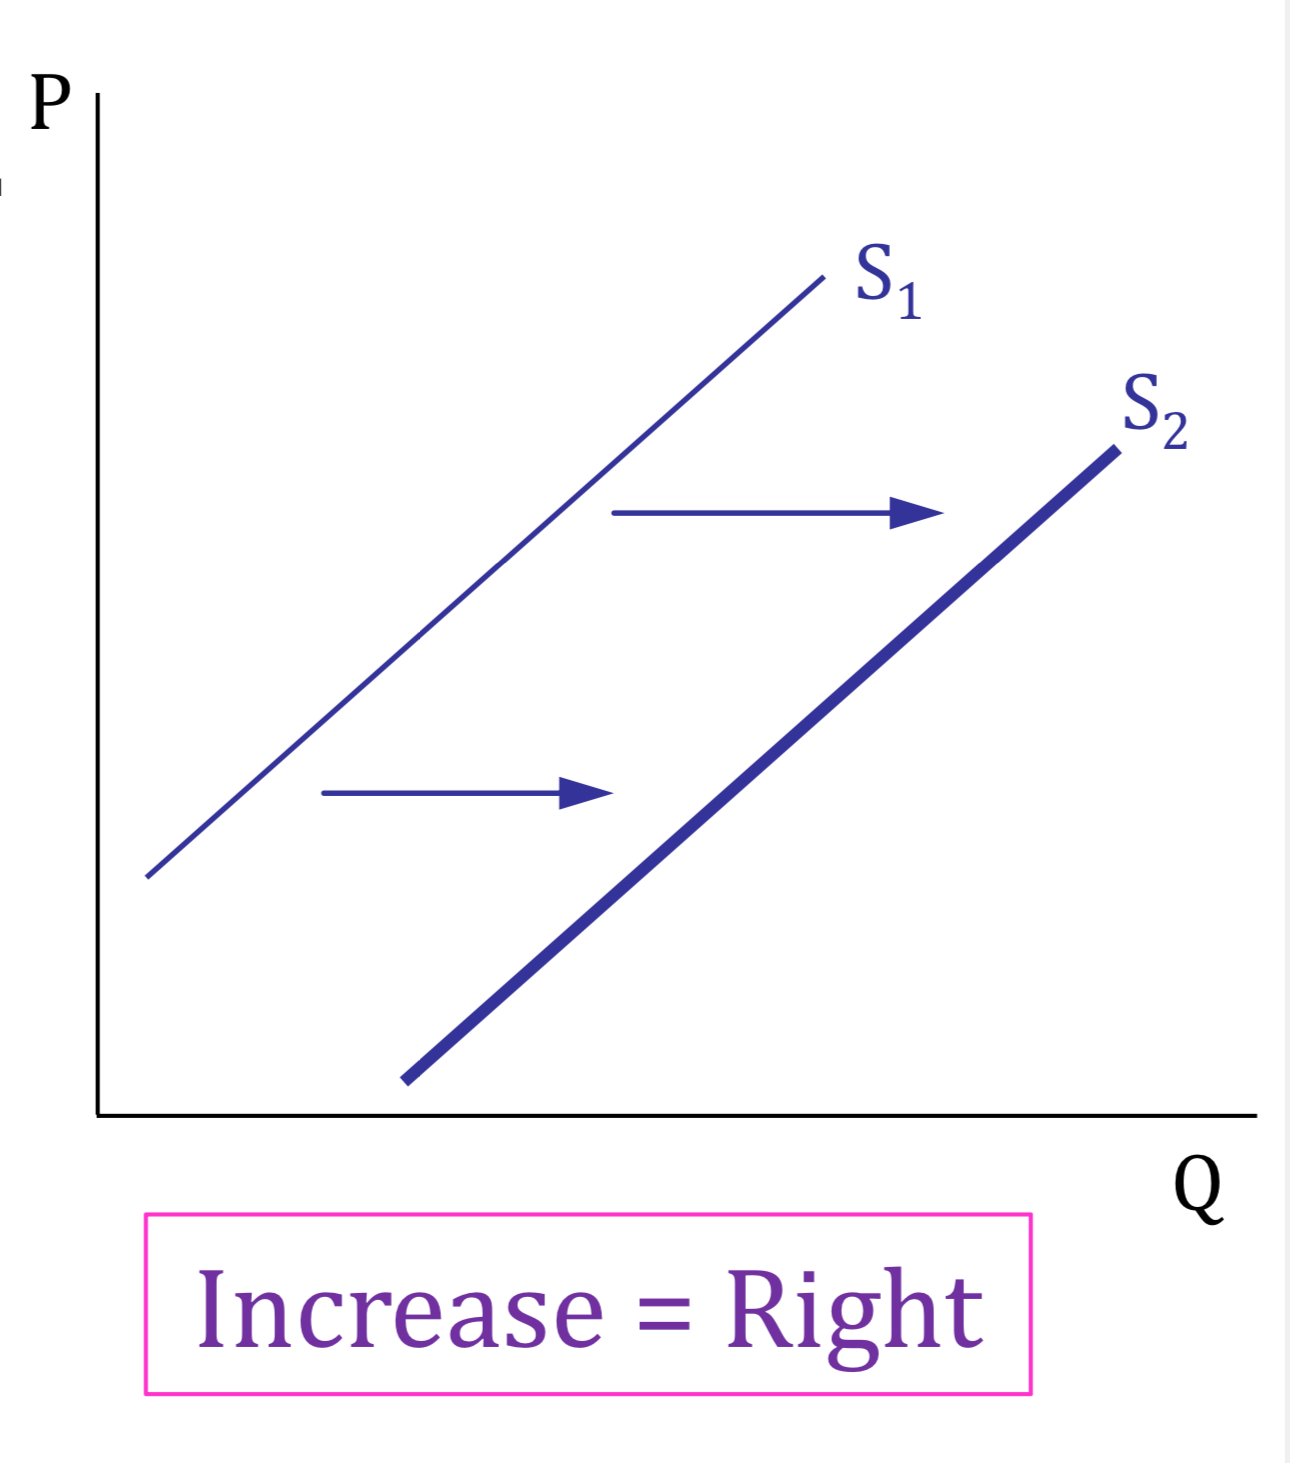
if S (goes down/decrease) : shift the supply curve to the left
Supply Curve Shifters
input prices
technology
numbers of sellers
expectations
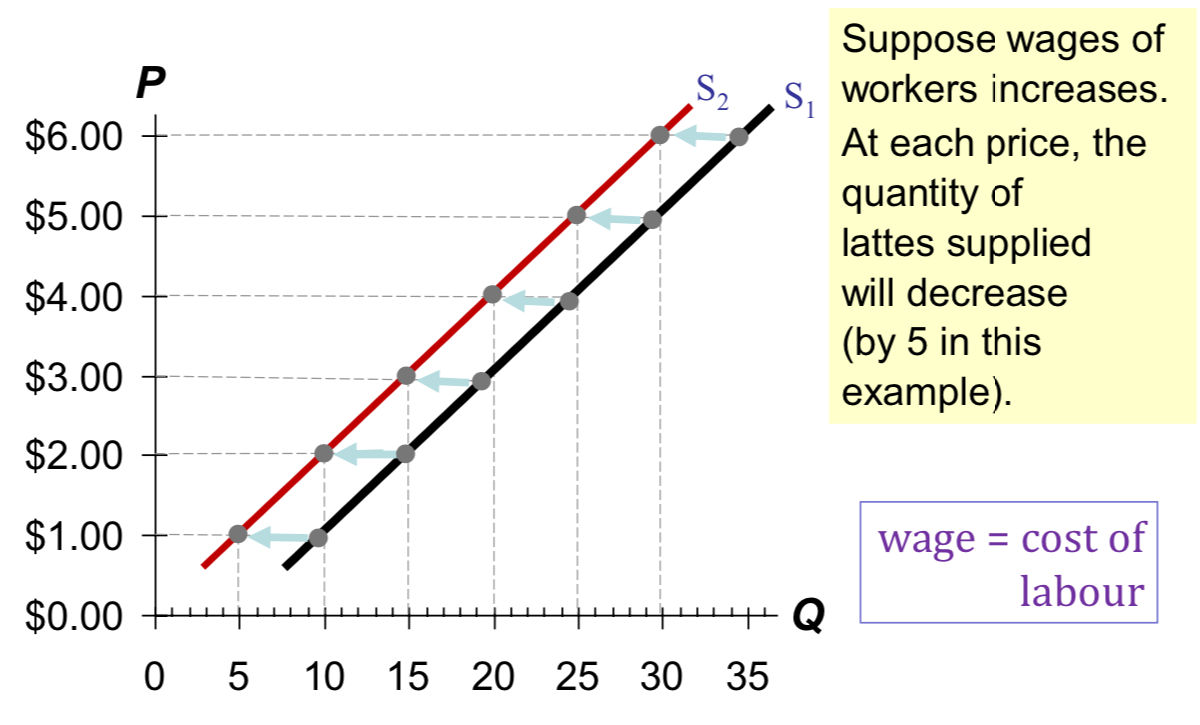
Supply Curve Shifters : Input Prices
examples of input prices : wages, prices of raw materials
a rise in input prices makes production less profitable, so firms supply a smaller quantity at each price, and the S curve shifts to the left — if input prices rise substantially, a firm might shut down
Supply Curve Shifters : Technology
technology determines how much inputs are required to produce a unit of output
a cost-saving technological improvement has same effect as a fall in input prices, shifts the S curve to the right
Supply Curve Shifters : Number of Sellers
an increase in the number of sellers increases the quantity supplied at each price, shifts the S curve to the right
Supply Curve Shifters : Expectations
suppose a firm expects the price of the good it sells to rise in the future
the firm may reduce supply now, to save some of its inventory to sell later at the higher price
this would shift the S curve leftward
SUMMARY — variables that affect supply
PT. 3
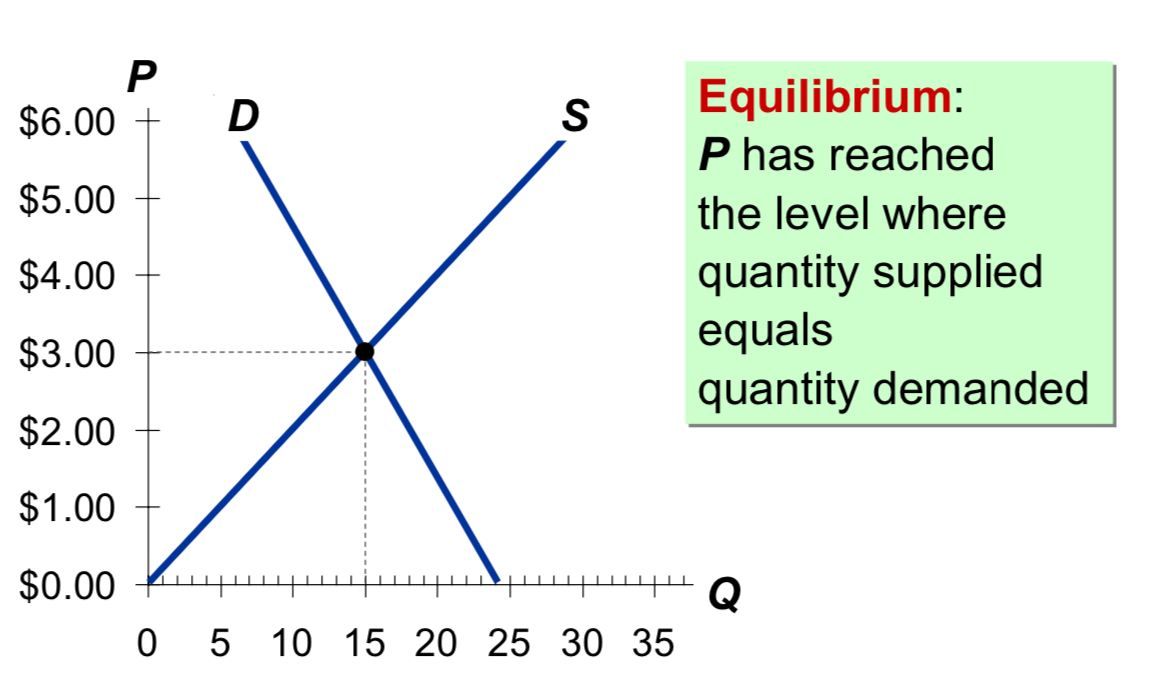
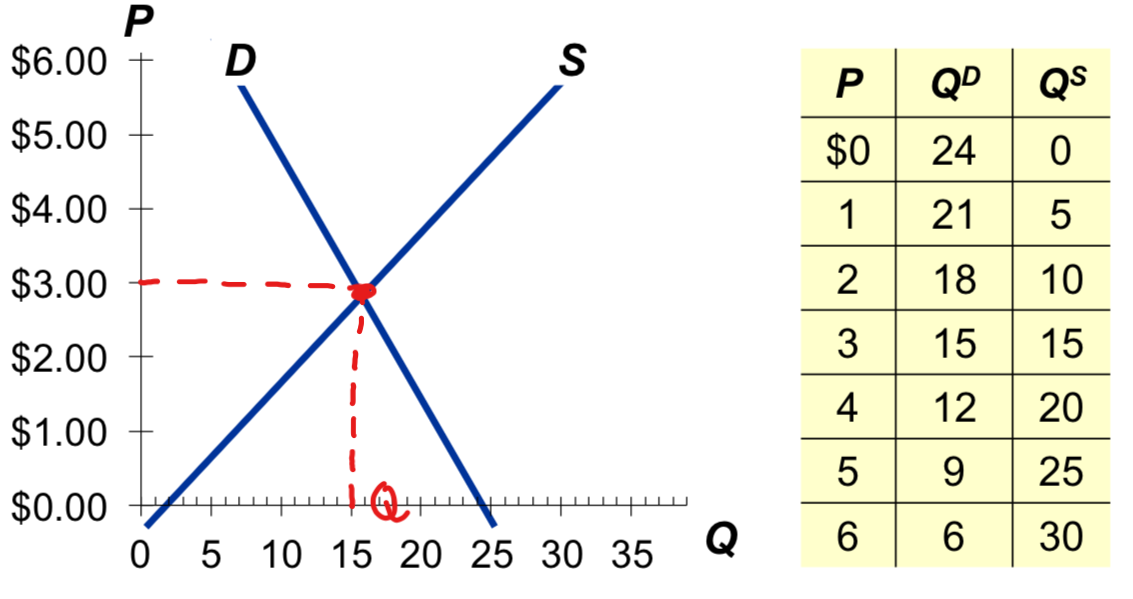
Market Equilibrium Price and Quantity
Equilibrium Price :
the price at the intersection of the market supply and demand curves
at this price, the amount that buyers are willing and able to buy is equal to the amount that sellers are willing and able to produce
Equilibrium Quantity :
the quantity at the intersection of the market supply and demand curves
at this point, the quantity demanded is equal to the quantity supplied
Supply & Demand together
— Equilibrium price → the price that equates quantity supplied with quantity demanded
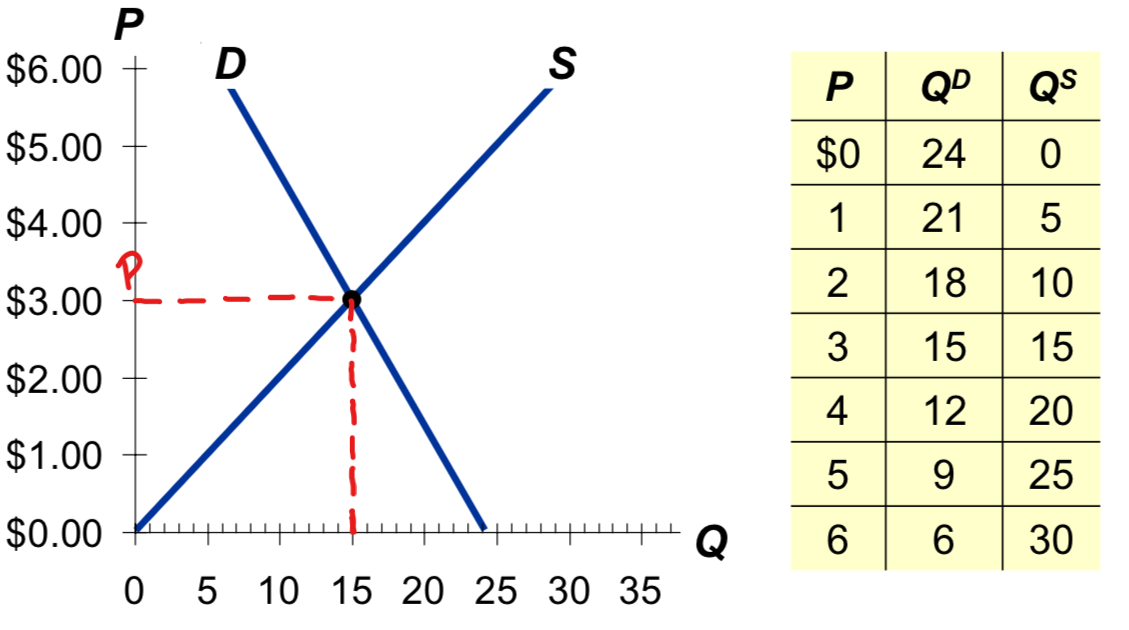
— Equilibrium quantity → the quantity supplied and quantity demanded at the equilibrium price
— Surplus → when quantity supplied is greater than quantity demanded
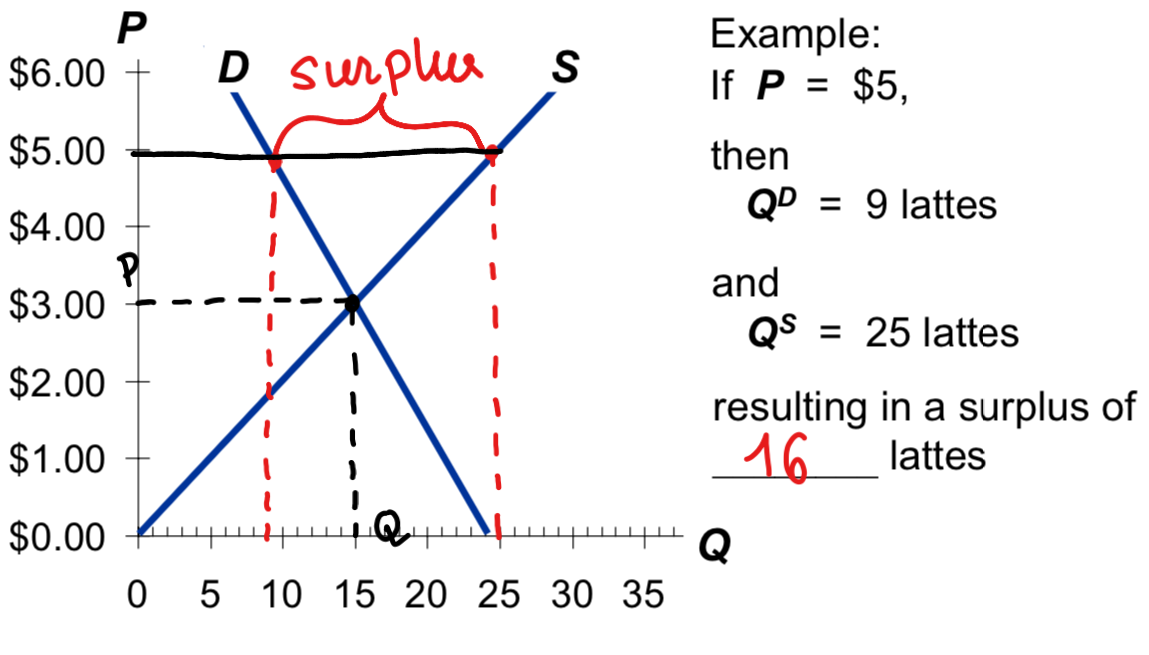
facing a surplus, sellers try to increase sales by cutting the price — this causes QD to rise and QS to fall → which reduces the surplus
→ failing prices causes QD to rise & QS to fall — prices continue to fall until market reaches equilibrium
— Shortage → when quantity demanded is greater that quantity supplied
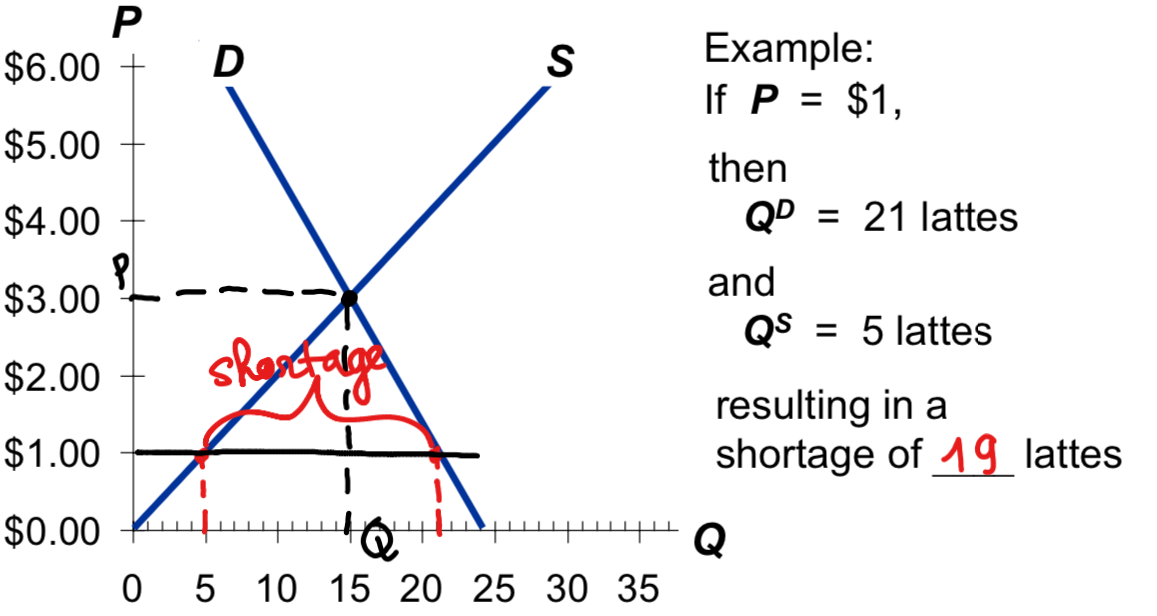
facing a shortage, sellers raise the price, causing QD to fall and QS to rise, which reduces the shortage — price continue to rise until market reaches equilibrium
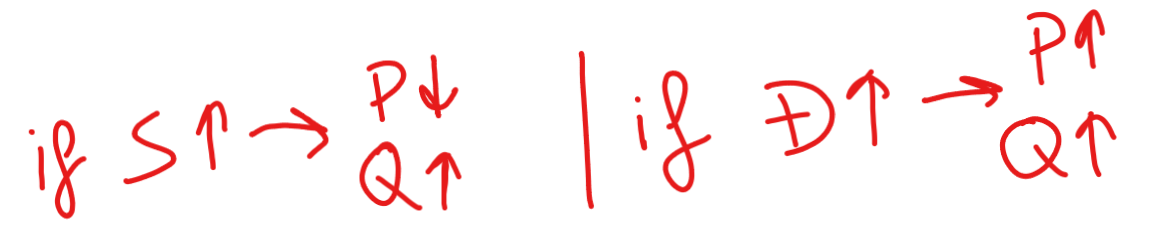
To determine the effect of any event
decide whether the event shifts S curve, D curve, or both
decide in which direction the curve shifts
use supply-demand diagram to see how the shift changes eq’m P and Q
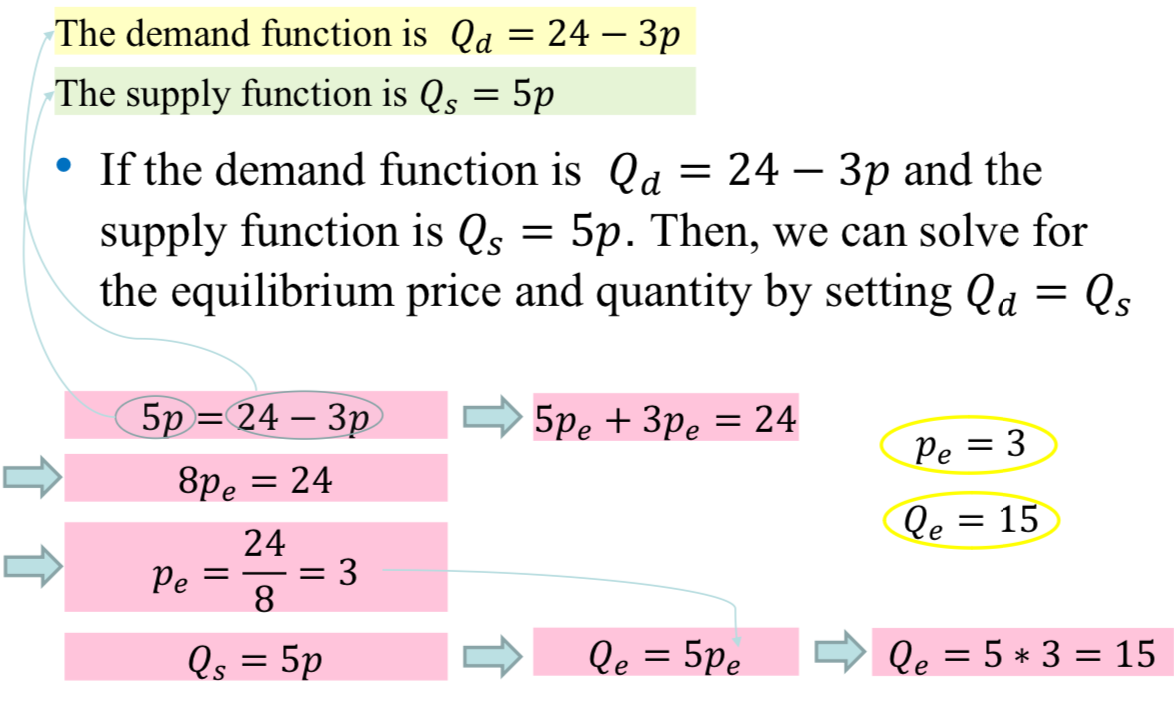
Solving for equilibrium quantity & price with functions
Qd = Qs
Government Policies
Government Policies that Alter the Private Market Outcome
price controls the use of government power to establish a price different from equilibrium price (you cannot charge more than the price decided by the government)
→ price ceiling : a legal maximum on the price of a good or service — ex : rent control
→ price floor : a legal minimum on the price of good or service — ex : minimum wage
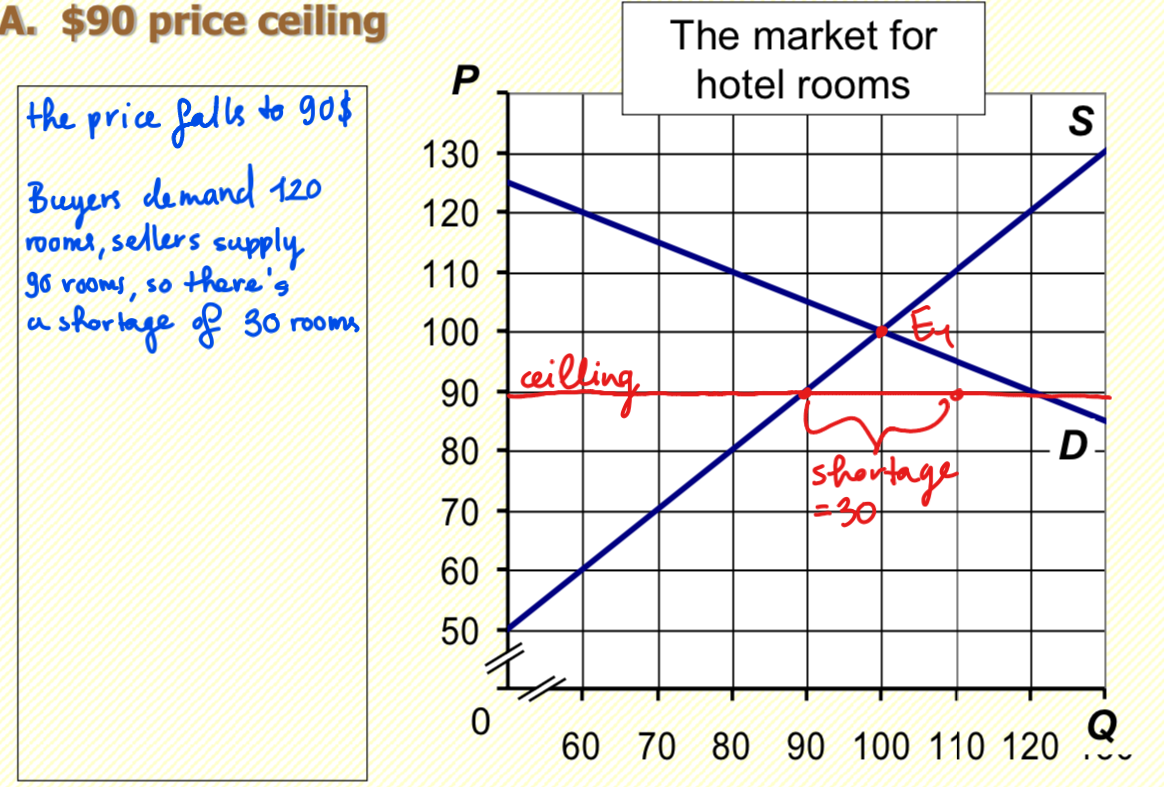
ex : price ceiling
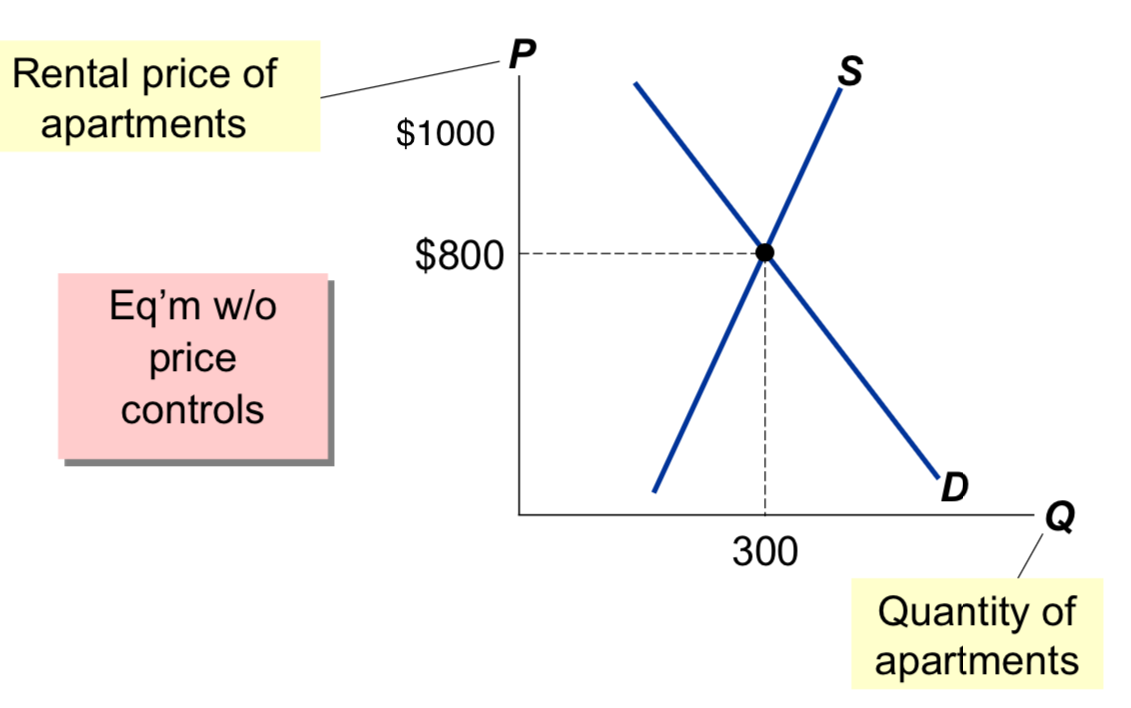
— How Price Ceilings Affect Market outcomes : → a price ceiling above the eq’m price is not binding, it has no effect on the market outcome
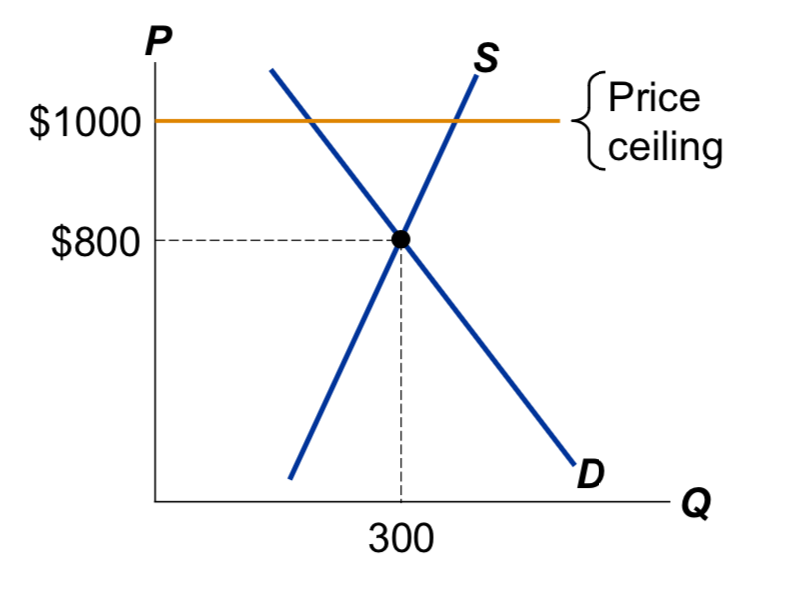
→ the eq’m price (800$) is above the ceiling and therefore illegal — the ceiling is a binding constraint on the price and causes a shortage
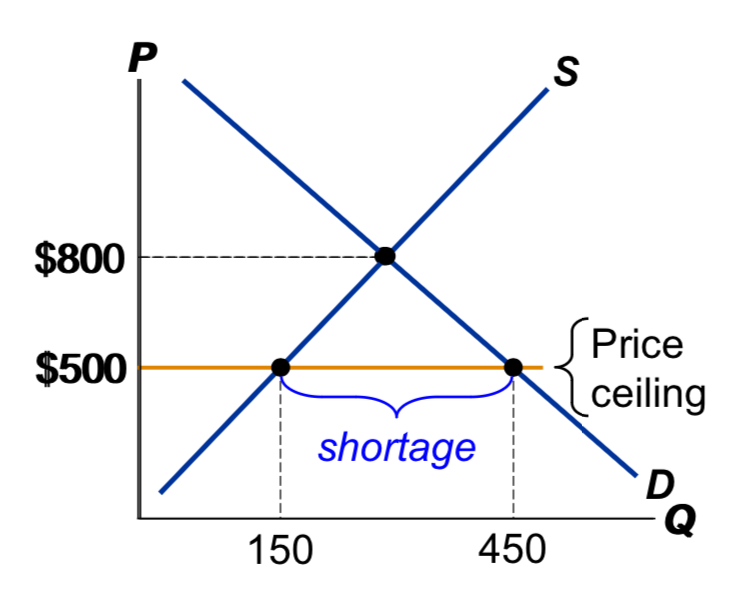
Results of Rent Control (Ceiling)
the rate of return on housing investments falls :
→ reduces incentives to construct new rental housing
→ reduces incentives to improve or upgrade rental apartments
→ persistent shortage o apartments that grows over time
discrimination according to seller’s biases
→ often unfair & inefficient : the goods don’t necessarily go to the buyers who value them most highly
in contrast, when prices are not controlled the goods go to the buyers that value them most highly which is efficient and impersonal (thus, fair)
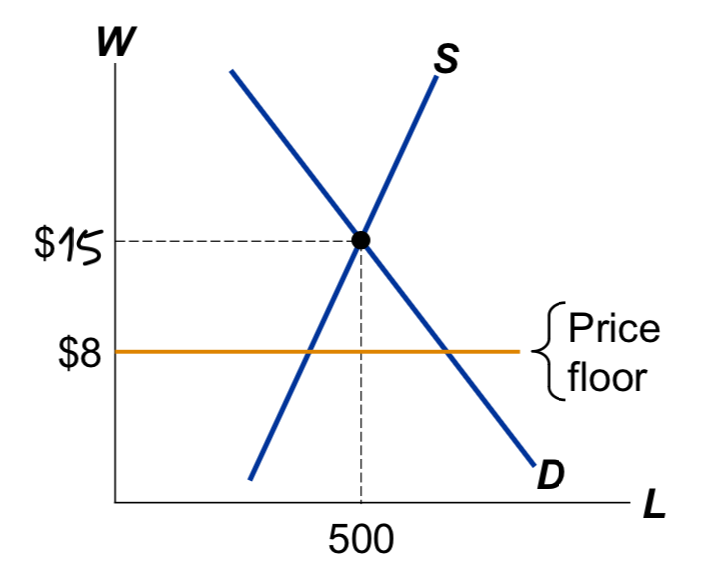
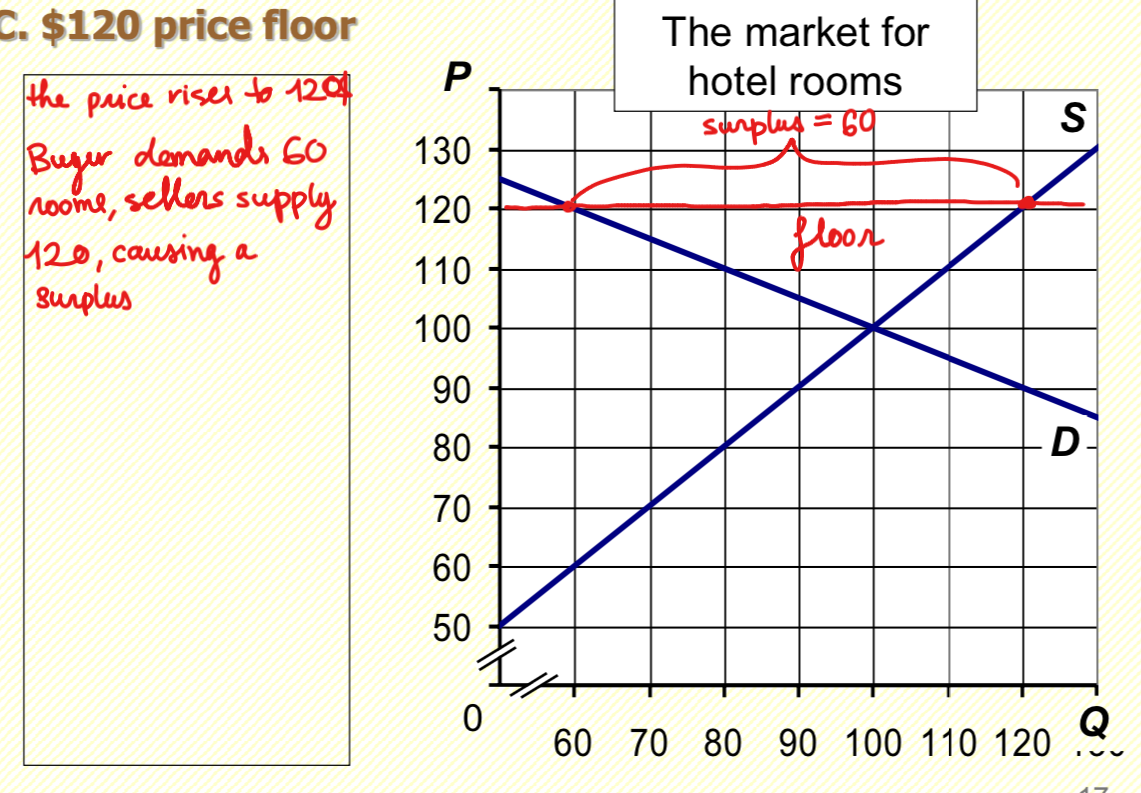
ex 2 : price floor
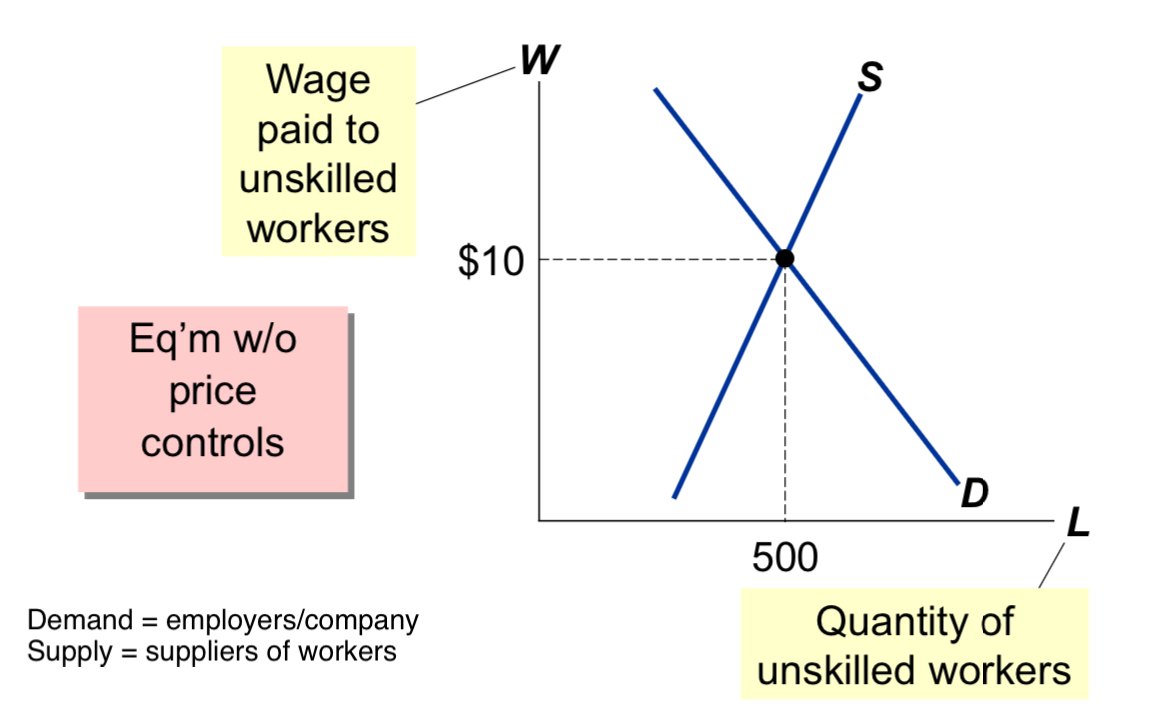
— How Price Floors Affect Market Outcomes : → a price floor below the eq’m price is not binding, it has no effect on the market outcome
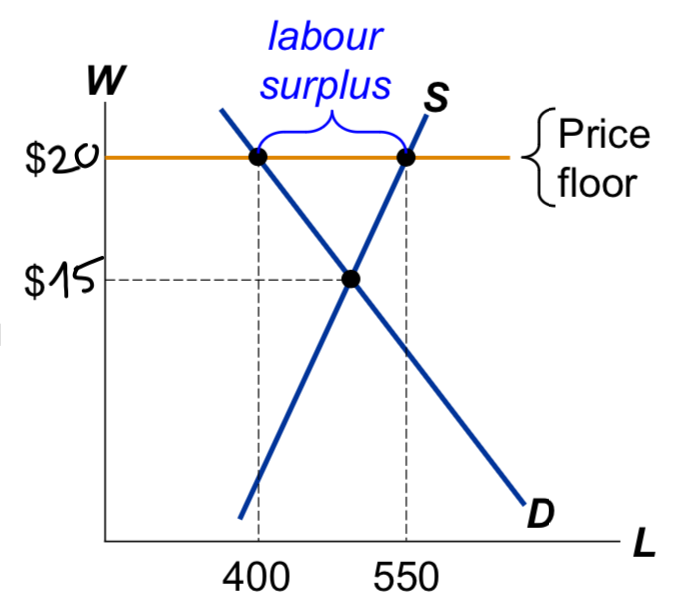
→ the eq’m wage (15$) is below the floor and therefore illegal — the floor is a binding constraint on the wage, and causes a surplus (ex : unemployment)
The Minimum Wage
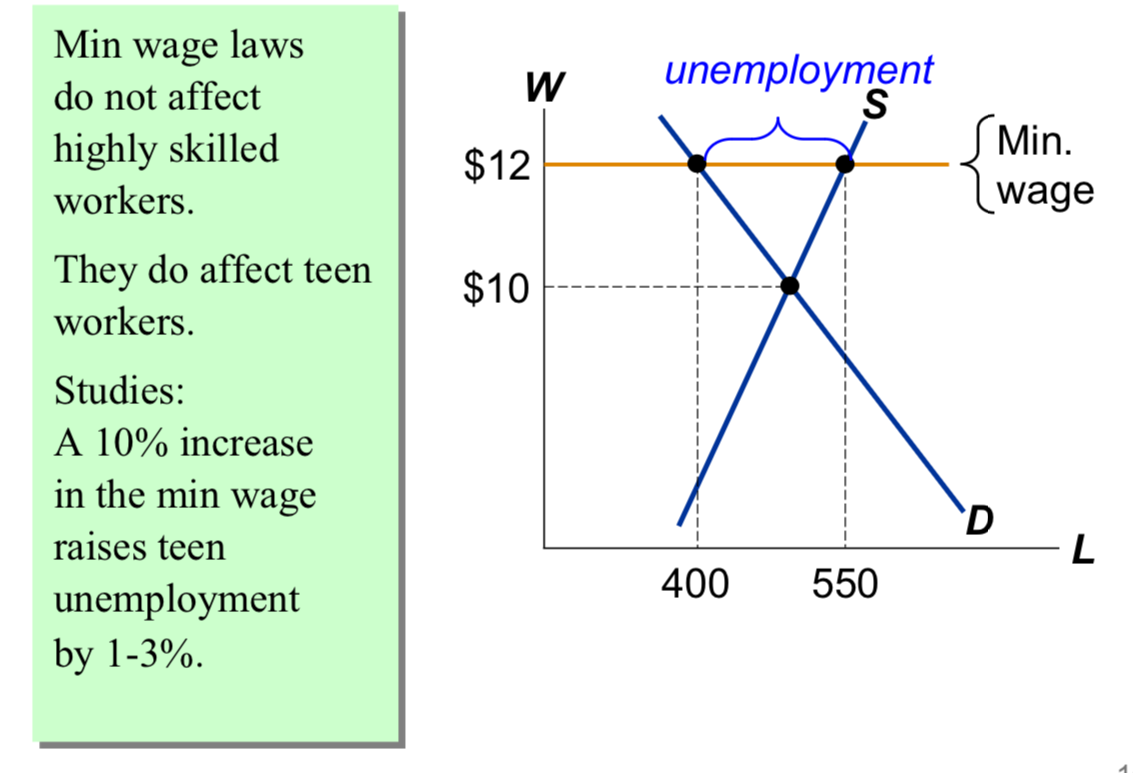
Results of Minimum Wage
→ some willing workers will be unable to find jobs, creating unemployment (550 - 400 = 150 in unemployment)
→ the unemployment impact falls mainly on the least experience, least skilled people holding the lowest paying jobs
→ those who continue to hold minimum-wage jobs gain substantially
→ very little effect on skilled and experienced workers earning wages that exceed the minimum wage
→ consumers pay more for products that were made more costly by the minimum wage
Evaluating Price Controls
price controls are often intended to help the poor, but they often hurt more than help them
→ the minimum wage can cause job losses
→ rent control can reduce the quantity and quality of affordable housing
examples of price effects :
Adam Smith (1723 - 1790)
Publication: Wealth of Nations, 1776
Contribution: “Invisible hand ”.
Role of the State: State should not intervene except for defence, justice, education and infrastructures (such as water supply, sewerages, roads, …
The invisible hand works through the price system:
→ The interaction of buyers and sellers determines prices of goods and services
→ Each price reflects the good’s value to buyers and the cost of producing the good
→ Prices guide self-interested households and firms to make decisions that, in many cases, maximize society’s economic well-being
Elasticity
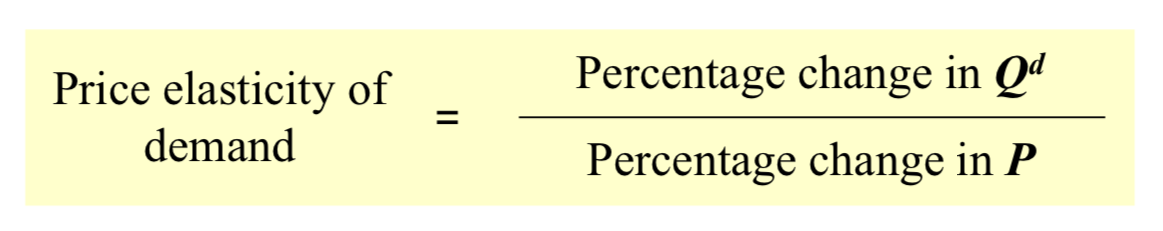
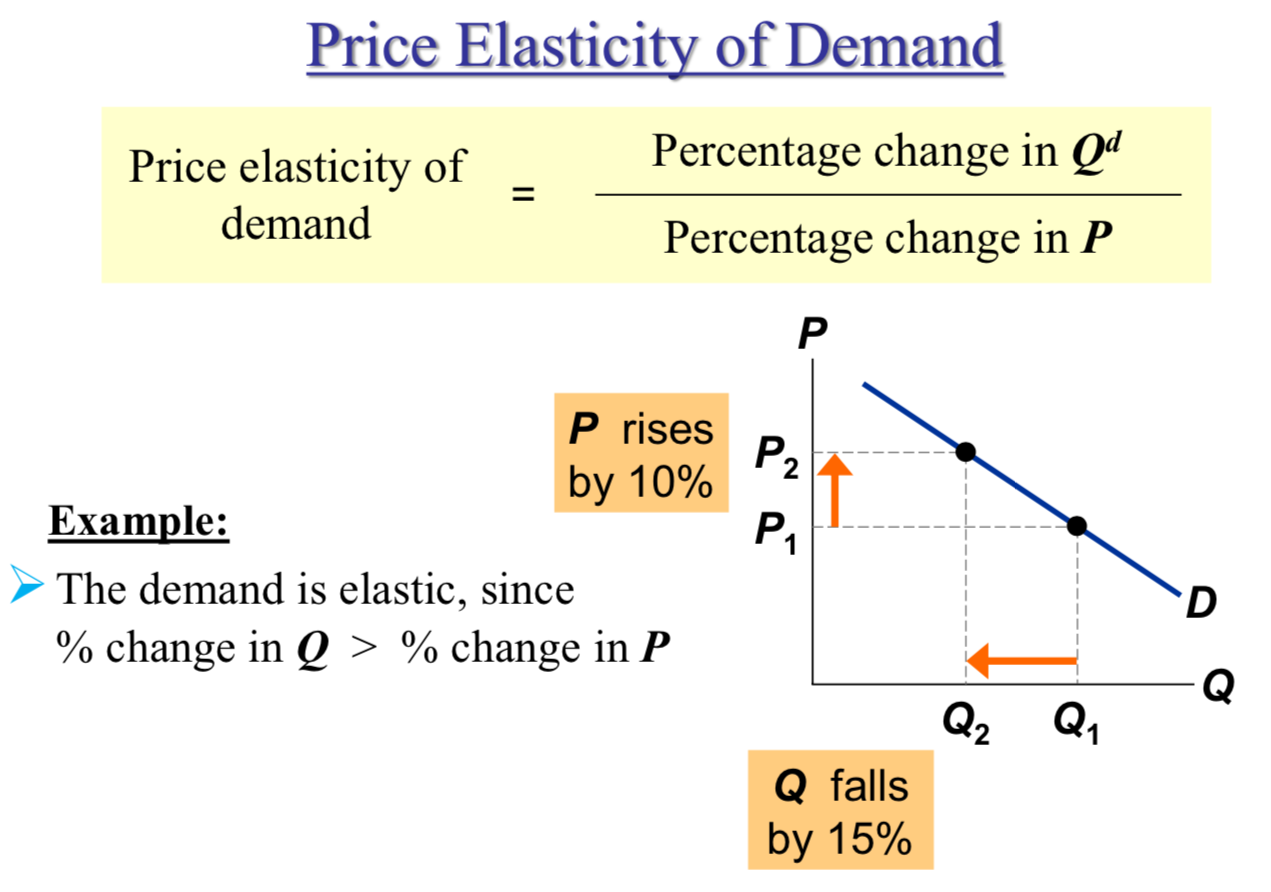
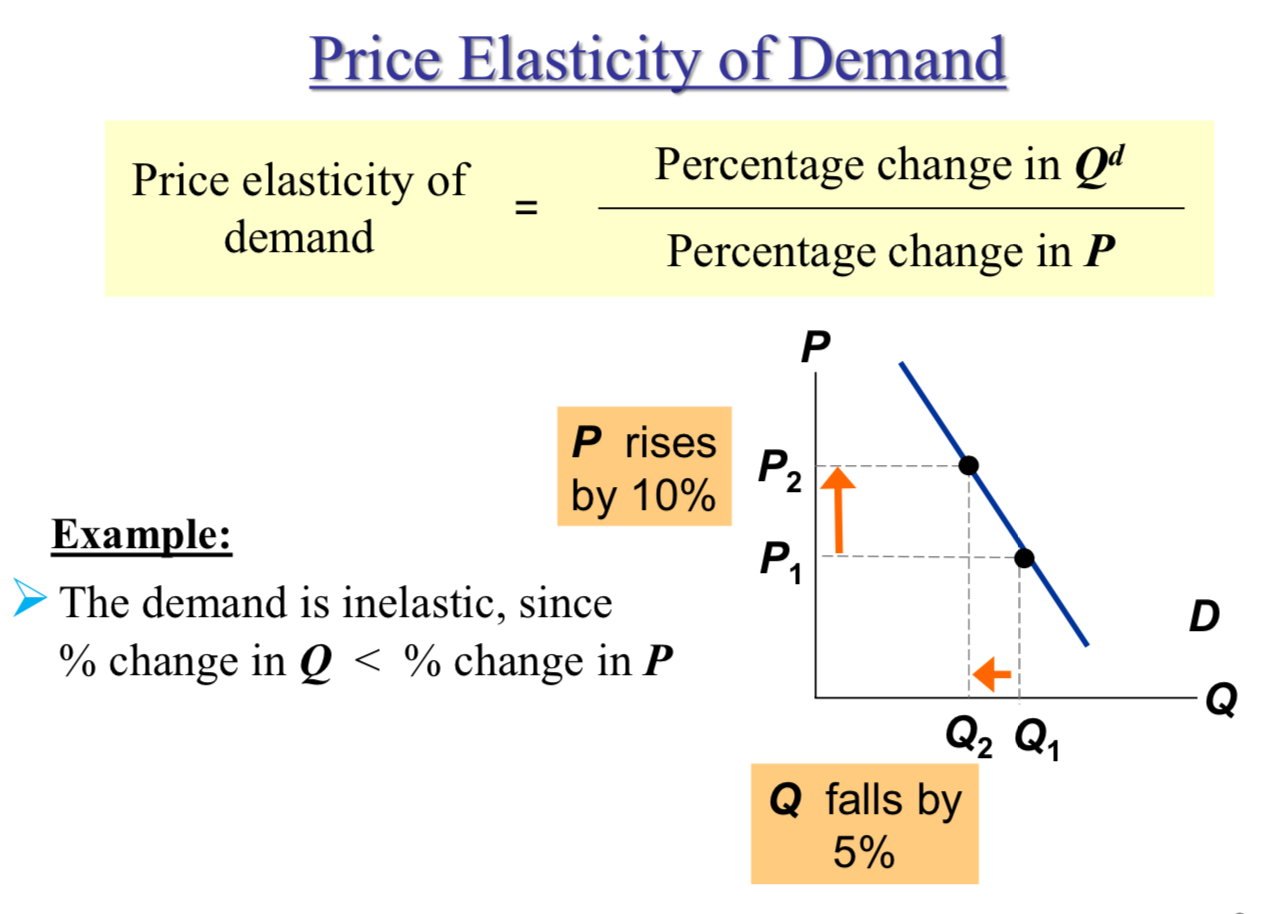
Price Elasticity of Demand
Basic idea: Elasticity measures how sensitive buyers are to a change in price.
Price elasticity of demand measures how much Q d responds to a change in P.
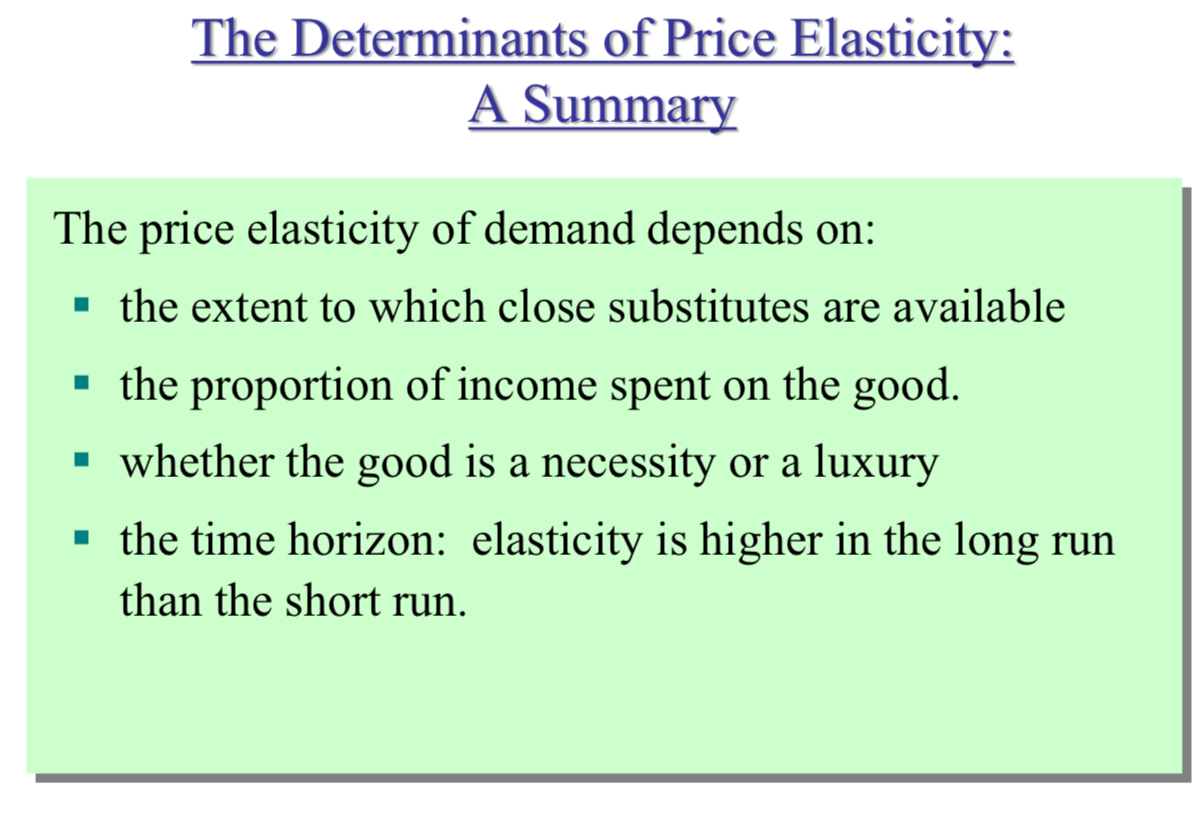
What determines price elasticity?
To learn the determinants of price elasticity, we look at a series of examples. Each compares two common goods.
In each example:
Suppose the prices of both goods rise by 20%.
The good for which Q d falls the most (in percent) has the highest price elasticity of demand.
EXAMPLE 1: Butter vs. Eggs
→ The prices of both of these goods rise by 20%. For which good does Q d drop the most? Why?
Margarine is a substitute for butter, so buyers can easily switch if the price rises.
Eggs has no close substitutes, so consumers would probably not buy much less if its price rises.
→ Lesson: Price elasticity is higher when close substitutes are available
EXAMPLE 2: “Gum” vs. “Housing”
→ The prices of both goods rise by 20%. For which good does Q d drop the most? Why?
If the price of gum goes from $1 to $1.20, you consume almost as much as before.
If the apartment rents increase by 20%, you look for more people to share your apartment.
→ Lesson: Price elasticity is higher the greater the proportion of income spent on the good
EXAMPLE 3: Insulin vs. Caribbean Cruises
→The prices of both of these goods rise by 20%. For which good does Q d drop the most? Why?
To millions of diabetics, insulin is a necessity. A rise in its price would cause little or no decrease in demand.
A cruise is a luxury. If the price rises, some people will forego it.
→ Lesson: Price elasticity is higher for luxuries than for necessities
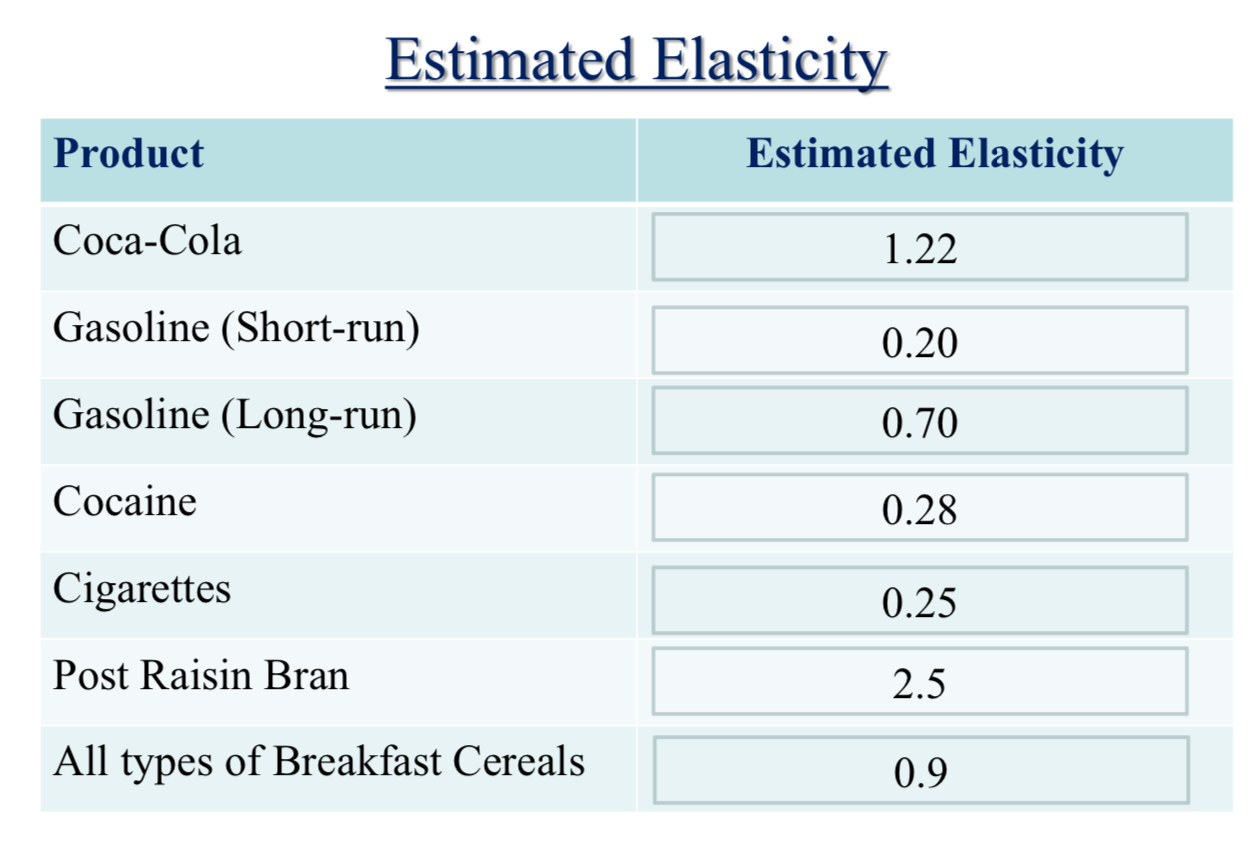
EXAMPLE 4: Gasoline in the Short Run vs. Gasoline in the Long Run
→ The price of gasoline rises 20%. Does Q d drop more in the short run or the long run? Why? •
There’s not much people can do in the short run, other than ride the bus or carpool.
In the long run, people can buy smaller cars or live closer to where they work. → Lesson: Price elasticity is higher in the long run than the short run
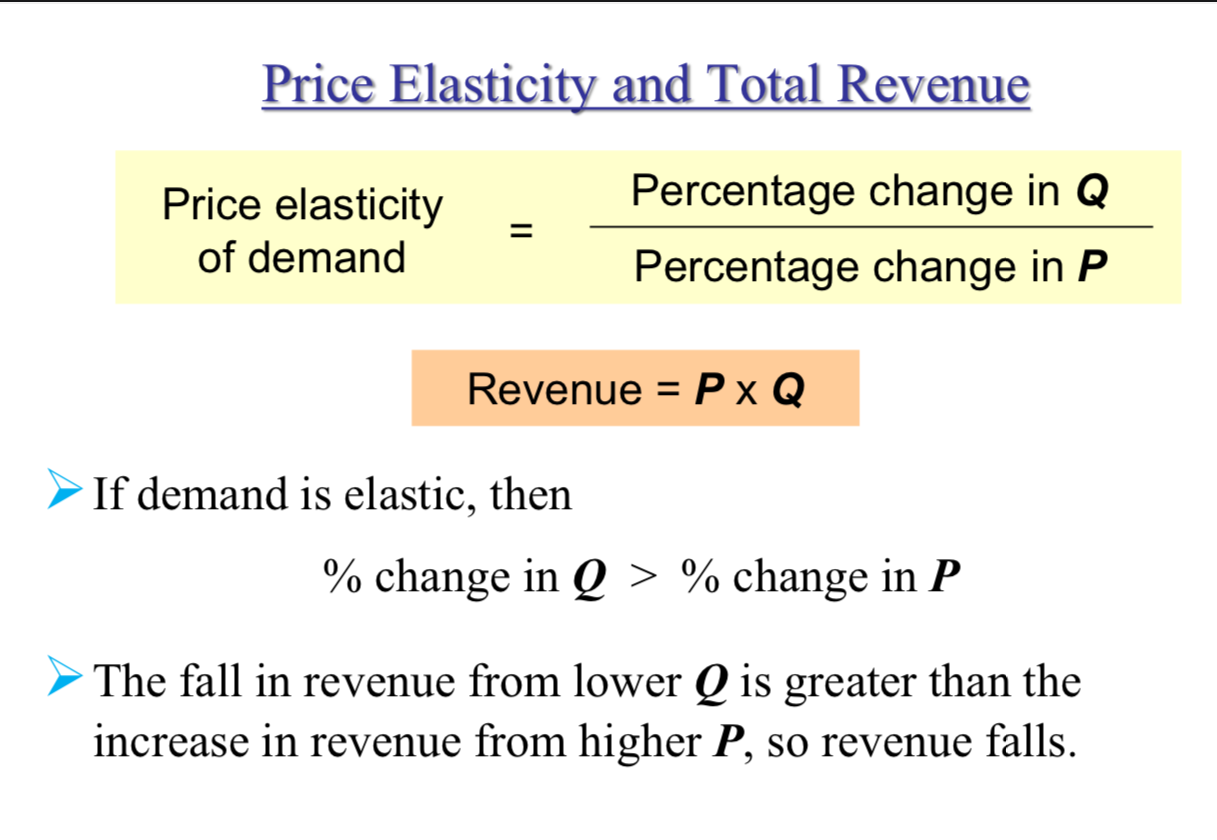
Price Elasticity & Total Revenue
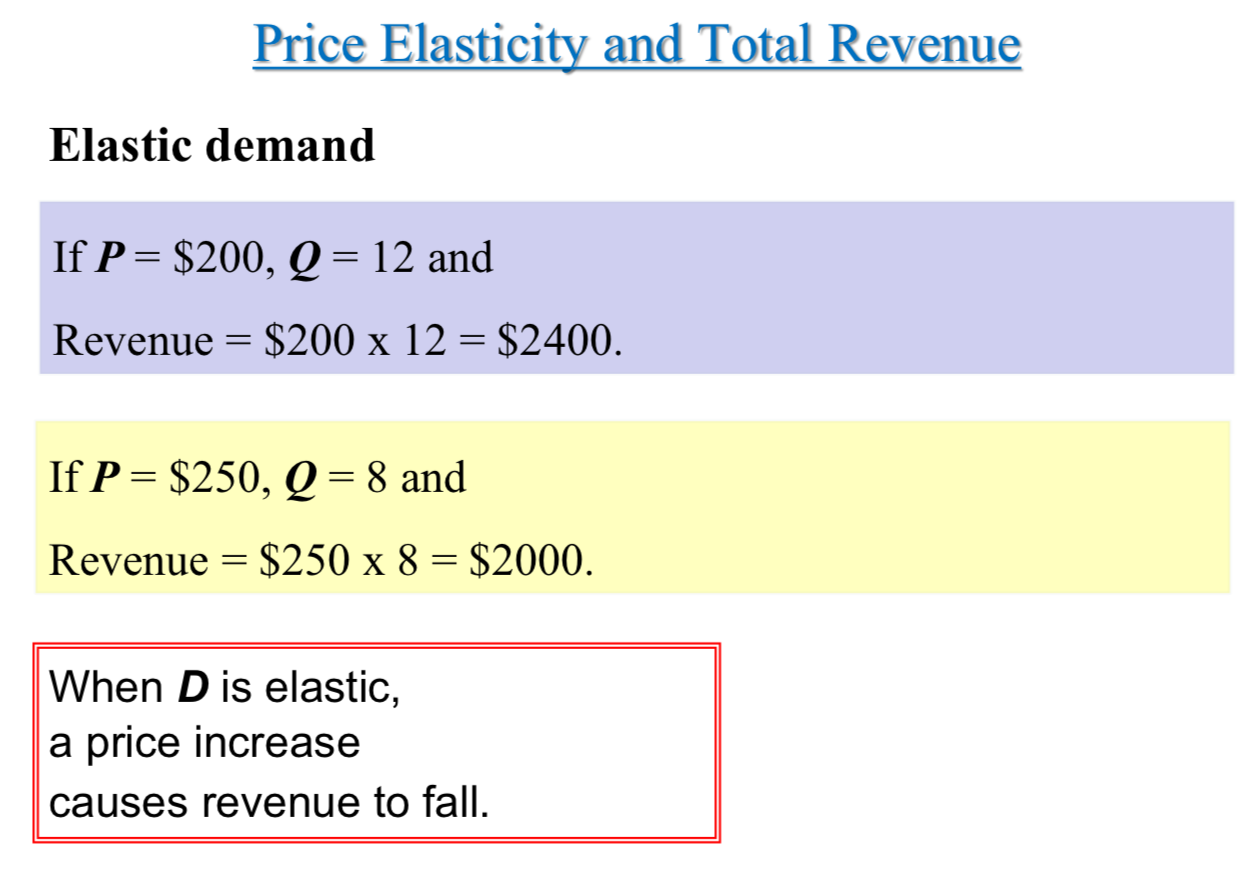
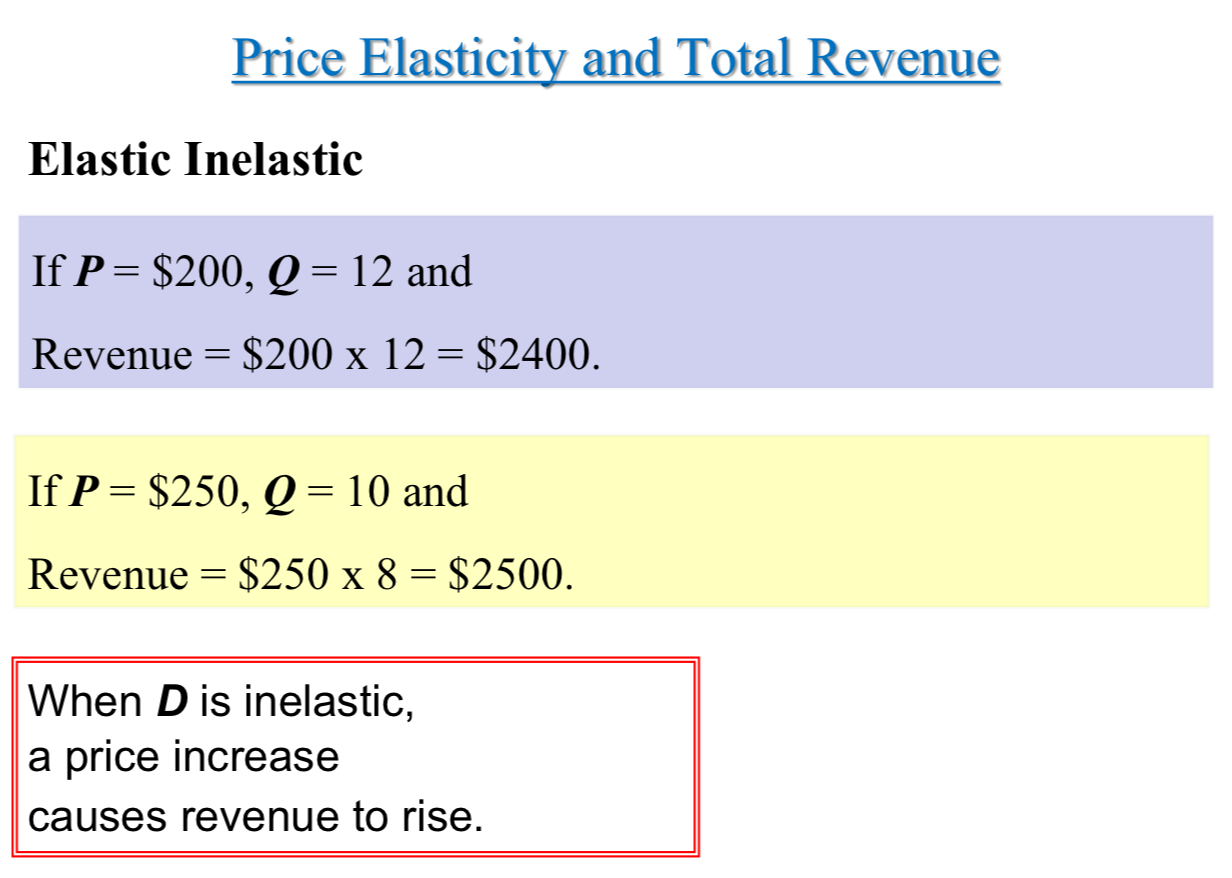
→ If you raise your price of your product from $200 to $250, would your revenue rise or fall?
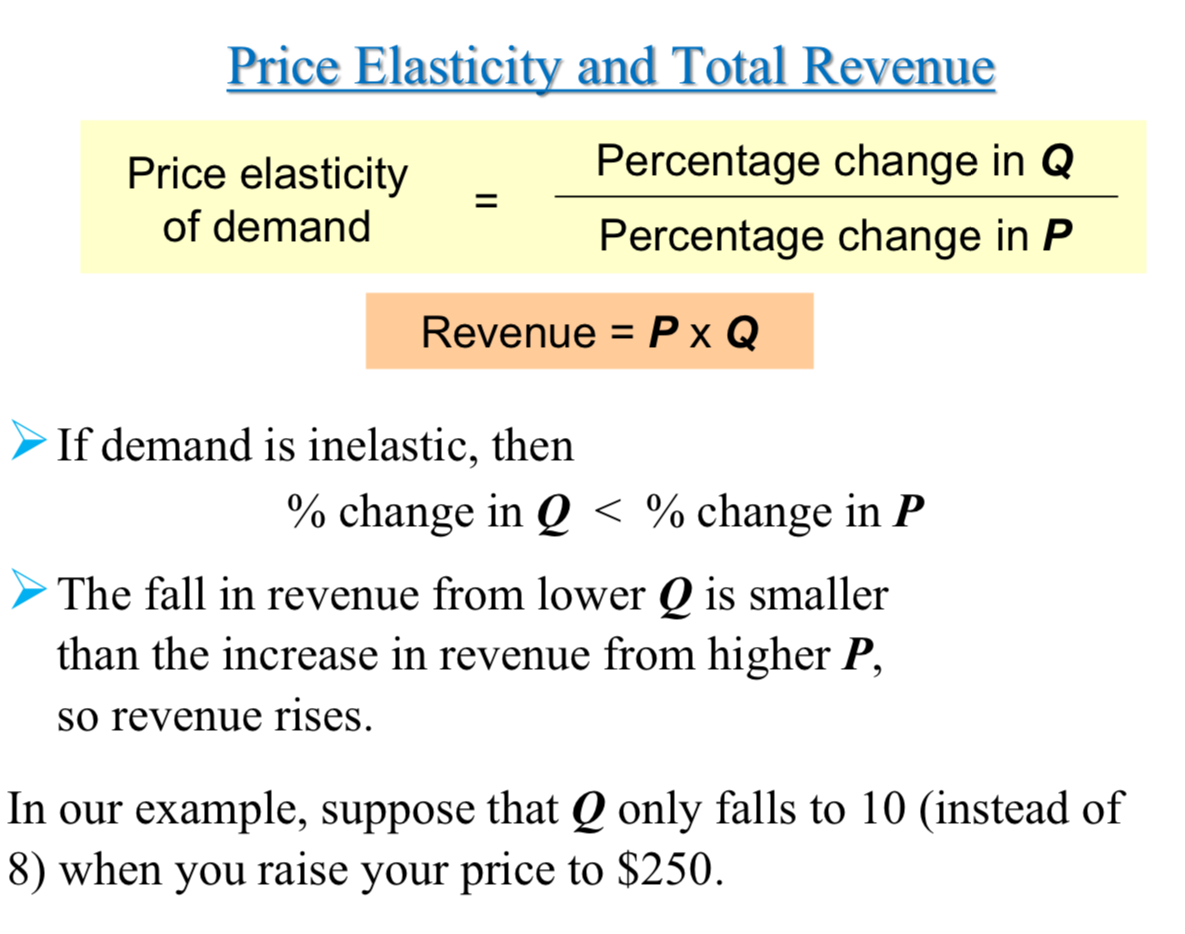
Revenue = P x Q
→ A price increase has two effects on revenue:
Higher P means more revenue on each unit you sell.
But you sell fewer units (lower Q), due to Law of Demand.
→ Which of these two effects is bigger? It depends on the price elasticity of demand