Review for Exam 1 - do review quizzes again
General: Describe the information
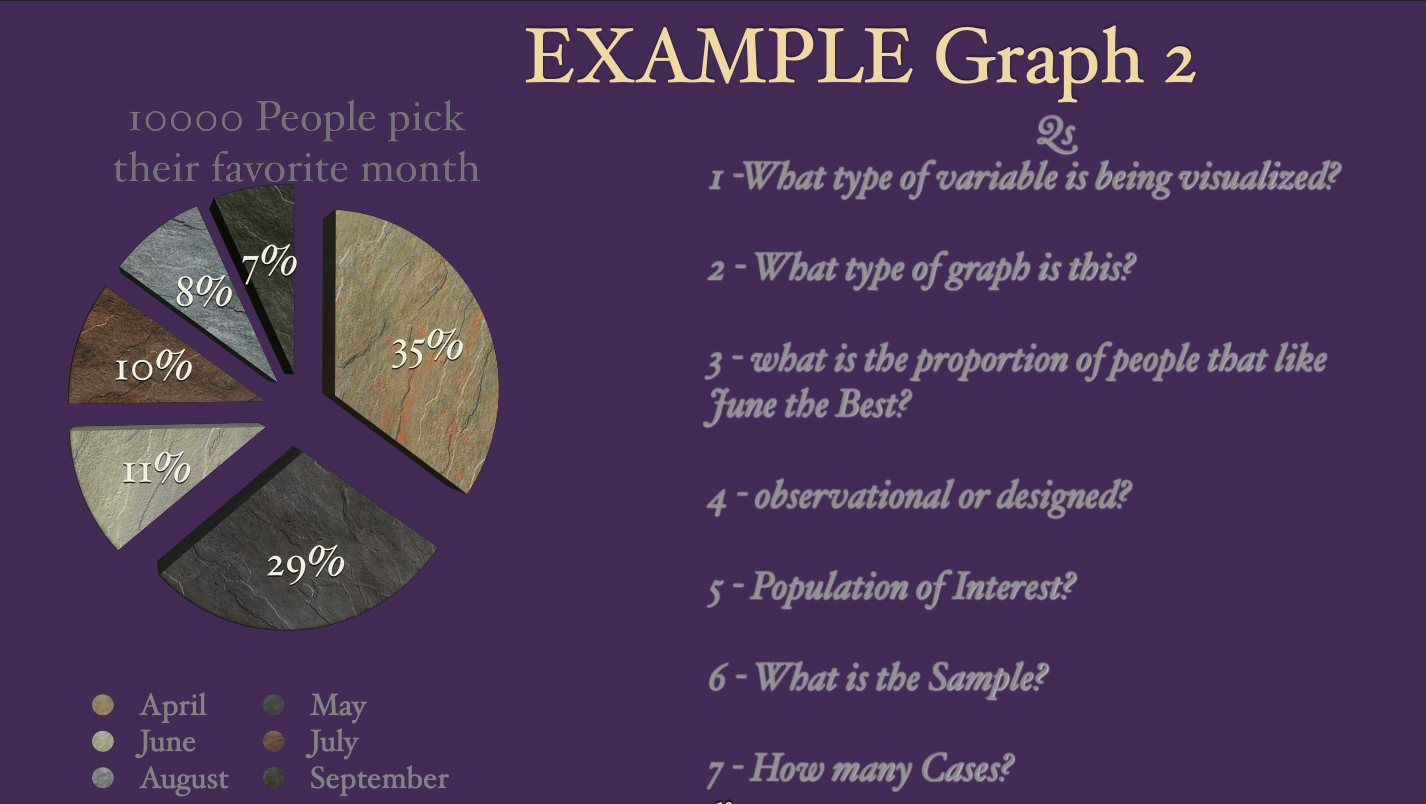
Population, sample, cases
The basic information we start with is:
WHAT is this data all about?
WHERE did it come from?
HOW is it organized?
Is there a QUESTION being asked?
From this QUESTION - What do we know of the POPULATION of Interest?
How was this Data Obtained? - SAMPLING METHODS
What is the Sample comprised of? CASES
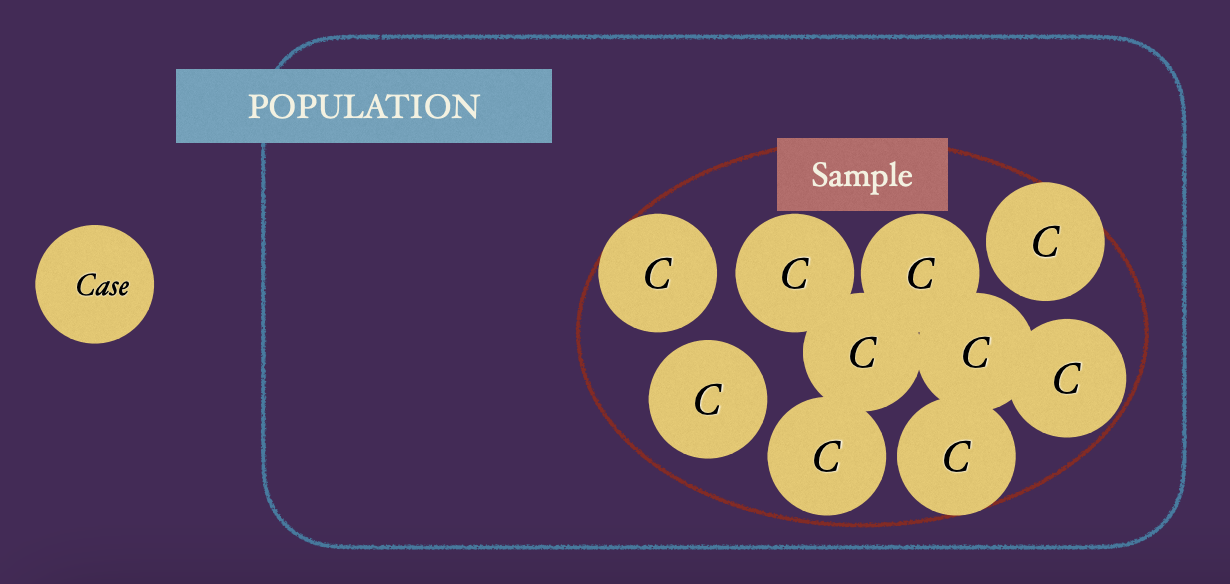
When there is x rows, there is x cases unless data is inputted incorrectly
Data - Data Types
The Data that we get is made up of identification information and variables.
Variables can be NUMERIC / QUANTITATIVE or CATEGORICAL/
QUALITATIVE. They may also be broken down into subgroups.
NUMERIC/QUANTITATIVE data can be
Continuous - things that have infinite measurement potential
Discrete - we can't have 1/2 of a person
CATEGORICAL/ QUALITATIVE data can be
Ordinal - are placed in a specific order
ex. Year
Nominal - are names of things
You can do most visualizations once you have a number
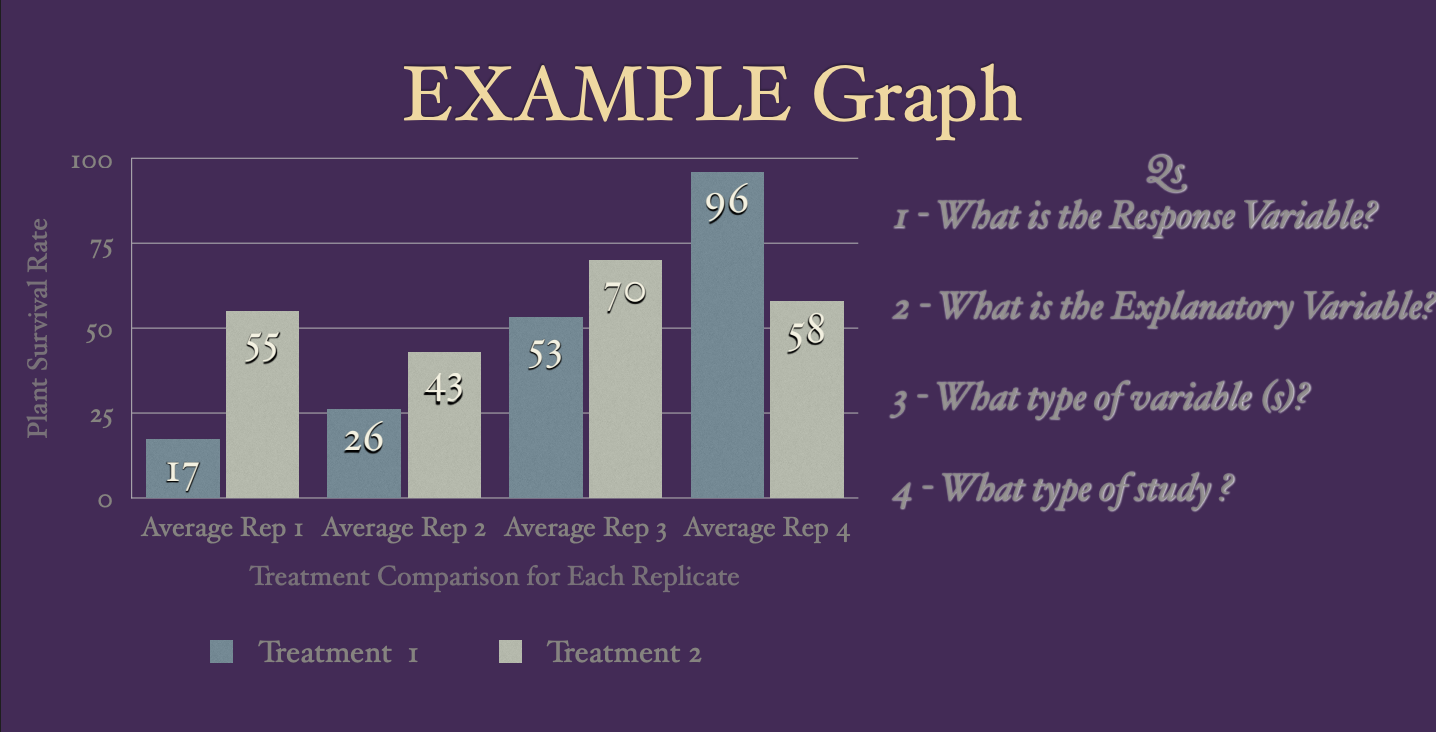
Any time there’s a comparison, there’s a side-by-side
Data - Visualization
We visualize our data in different ways based on what type of data it is.
Categorical Data - mosaic Charts , bar charts, pie charts
Numeric Data - histograms, box plots, dot plots, density plots
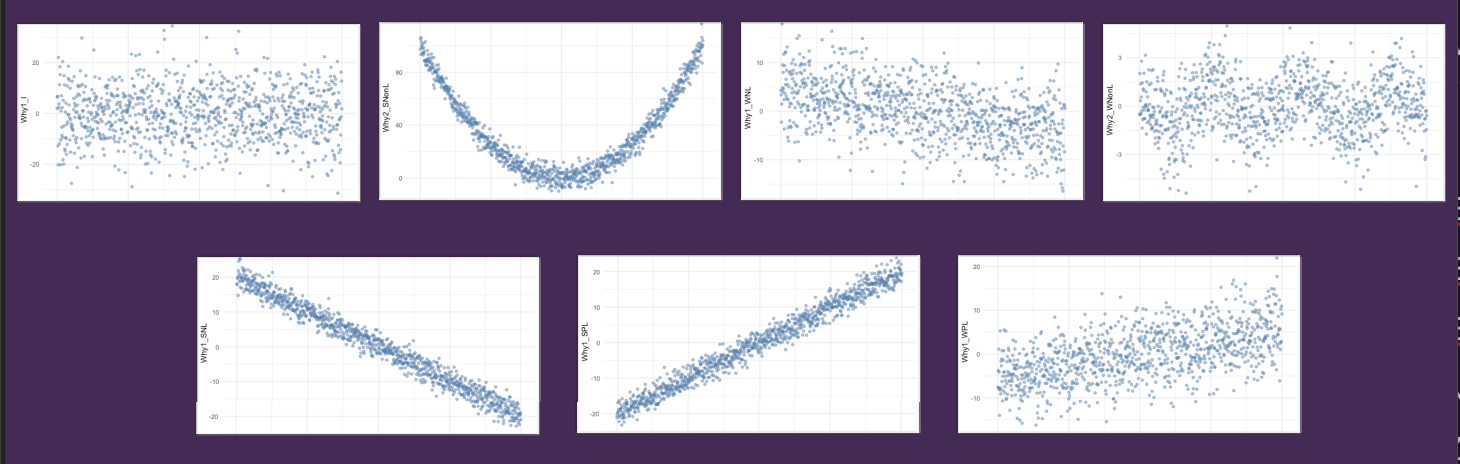
For a scatterplot, you need two quantitative (numeric) variables so you can see how one changes with respect to the other.
KNOW WHAT THESE LOOK LIKE
List how different variable types can apply to each visualization
Data - Summary / Descriptive Data / 5# summary / contingency tables
We summarize our data in different ways based on what type of data it is.
Categorical Data - contingency tables, frequency tables, 2x2 tables
Numeric Data - Numeric values that describe the center, spread, and shape
Mean/Median/Mode Σ(X)/N — loc N/2 + 1 —- highest frequency
Variation, Standard Deviation, MAD, Range, IQR
Skewness (le /neg, right/pos)
Numeric
Mean (X1+X2+X3+…Xn)/N
Median - location at N/2+1 or the average of the two center points
Mode - highest frequency
5-number summary: Min, Q1, Med, Q3, Max
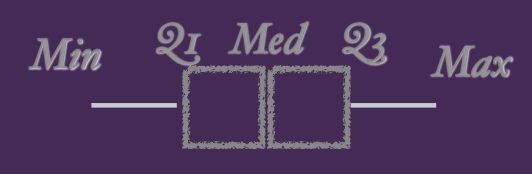
Range: Max-Min
InterQuartile Range (IQR) = Q3-Q1
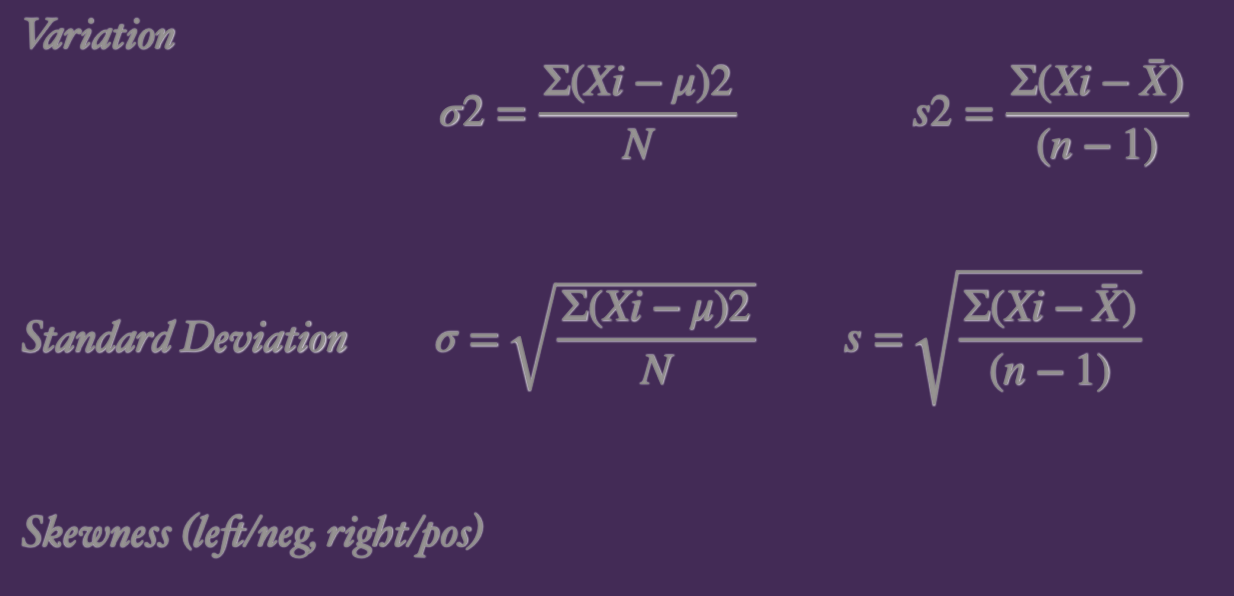
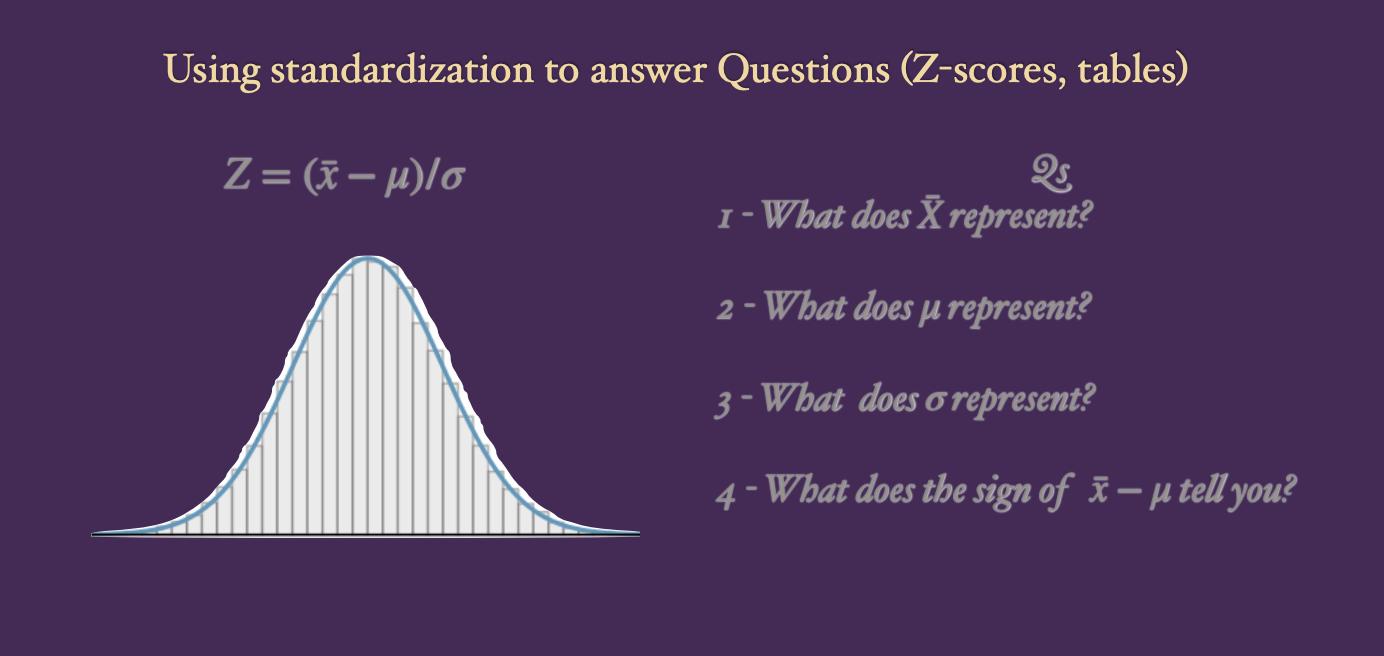
The formulas with greek letters have to do with a population
Outliers: Q1-1.5xIQR and Q3-1.5xIQR
Upper bounded data is a set of numerical values where there is a known, maximum limit that the data points
Calculating Standard Deviation
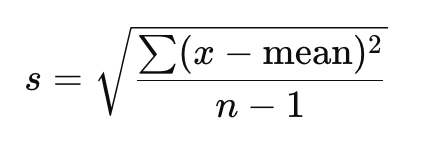
x = each data point
mean = the average of all the data points
(x - mean) = how far each point is from the mean
(x - mean)^2 = squared difference
sum( (x - mean)^2 ) = add up all the squared differences
n - 1 = number of data points minus 1 (degrees of freedom)
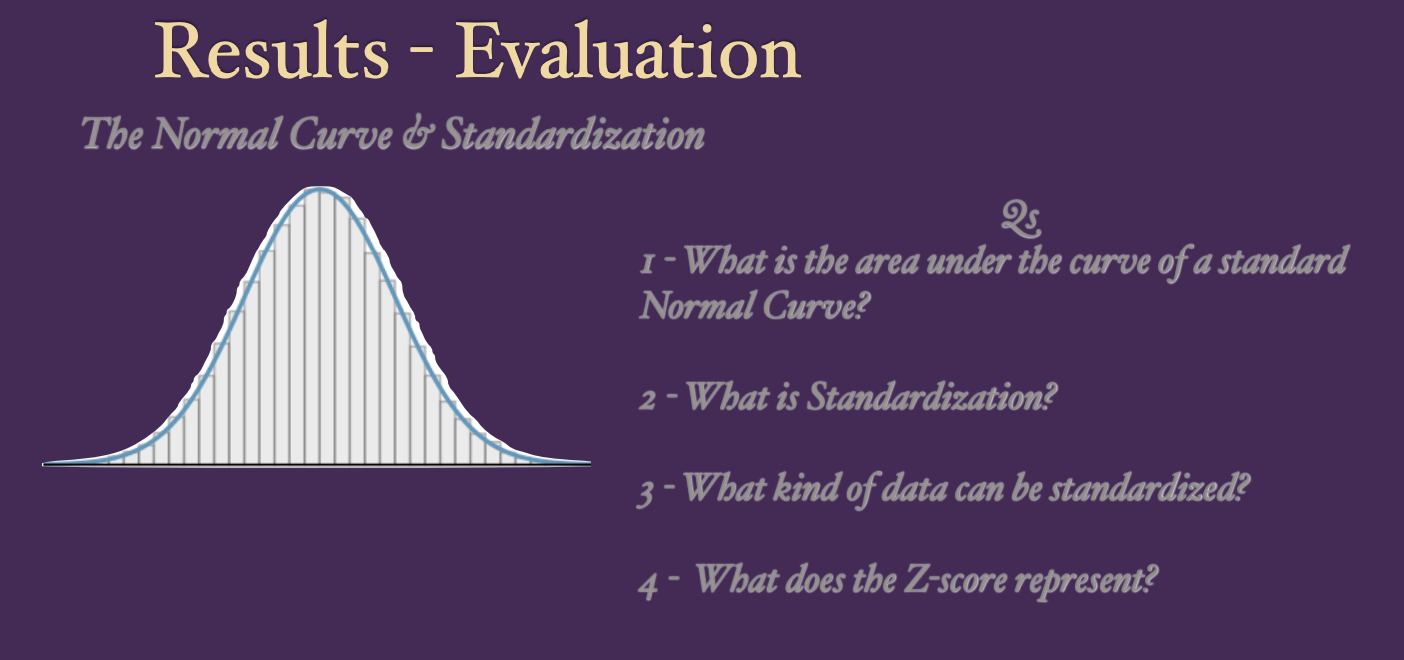
Always draw a picture when you do z-scores
Data - Relationship Plotting
We can investigate the relationship between variables by plotting them on a x/y plot where the RESPONSE variable is on the Y axis and the EXPLANATORY variable(s) is/are on the X axis
Experiment (Expt) - Hypotheses
Why are you doing this experiment in the first place?
Create a set of hypotheses around the question we are interested in answering
H0 : The data is independent aka Status Quo
Nothing will change how things are H0: μ1 = μ2
Ha : The data is not independent aka Something Changes
Ha: μ1 ≠ μ2
Expts - Types of experiments
Two main type of study:
Observational
Designed Experiment (sometimes referred to only as Experiment - this is a trap)
We will not consider anecdotal evidence as a type of study
Expt - Types of sampling methods
Simple Random: random selection of a number of cases/observational units
Stratified: First create groups within the population, and then randomly select from each group
groups are created, not naturally occurring
ex. a lab professor believes the section a student is in might affect how they feel about the course
Cluster: break up the population into multiple naturally occurring groups (clusters), and select some of the clusters, including a data from EVERYONE in the cluster
ex. groups of college students who live in dorms by year (freshman, sophomore, etc.) if you want to equally represent students from all years
Multistage sampling: break up the population into multiple groups (clusters), and select some of the clusters, including data from SOME members of the cluster
Expts - X/Y aka Ind/Dep aka Expl/Response
Based on the Question we asked, we de ne our Response Variable - or Y - or Dependent (because it is dependent on the changes of we make to our explanatory variables
USUALLY the Y or RESPONSE is depicted on the Y axis of our visualization
USUALLY the EXPLANATORY variable(s) are on the X axis of our visualization