Chapters 30.5-30.6: Interest Rates and Monetary Policy
Monetary Policy, Real GDP, and the Price Level
Cause-Effect Chain

Market for Money
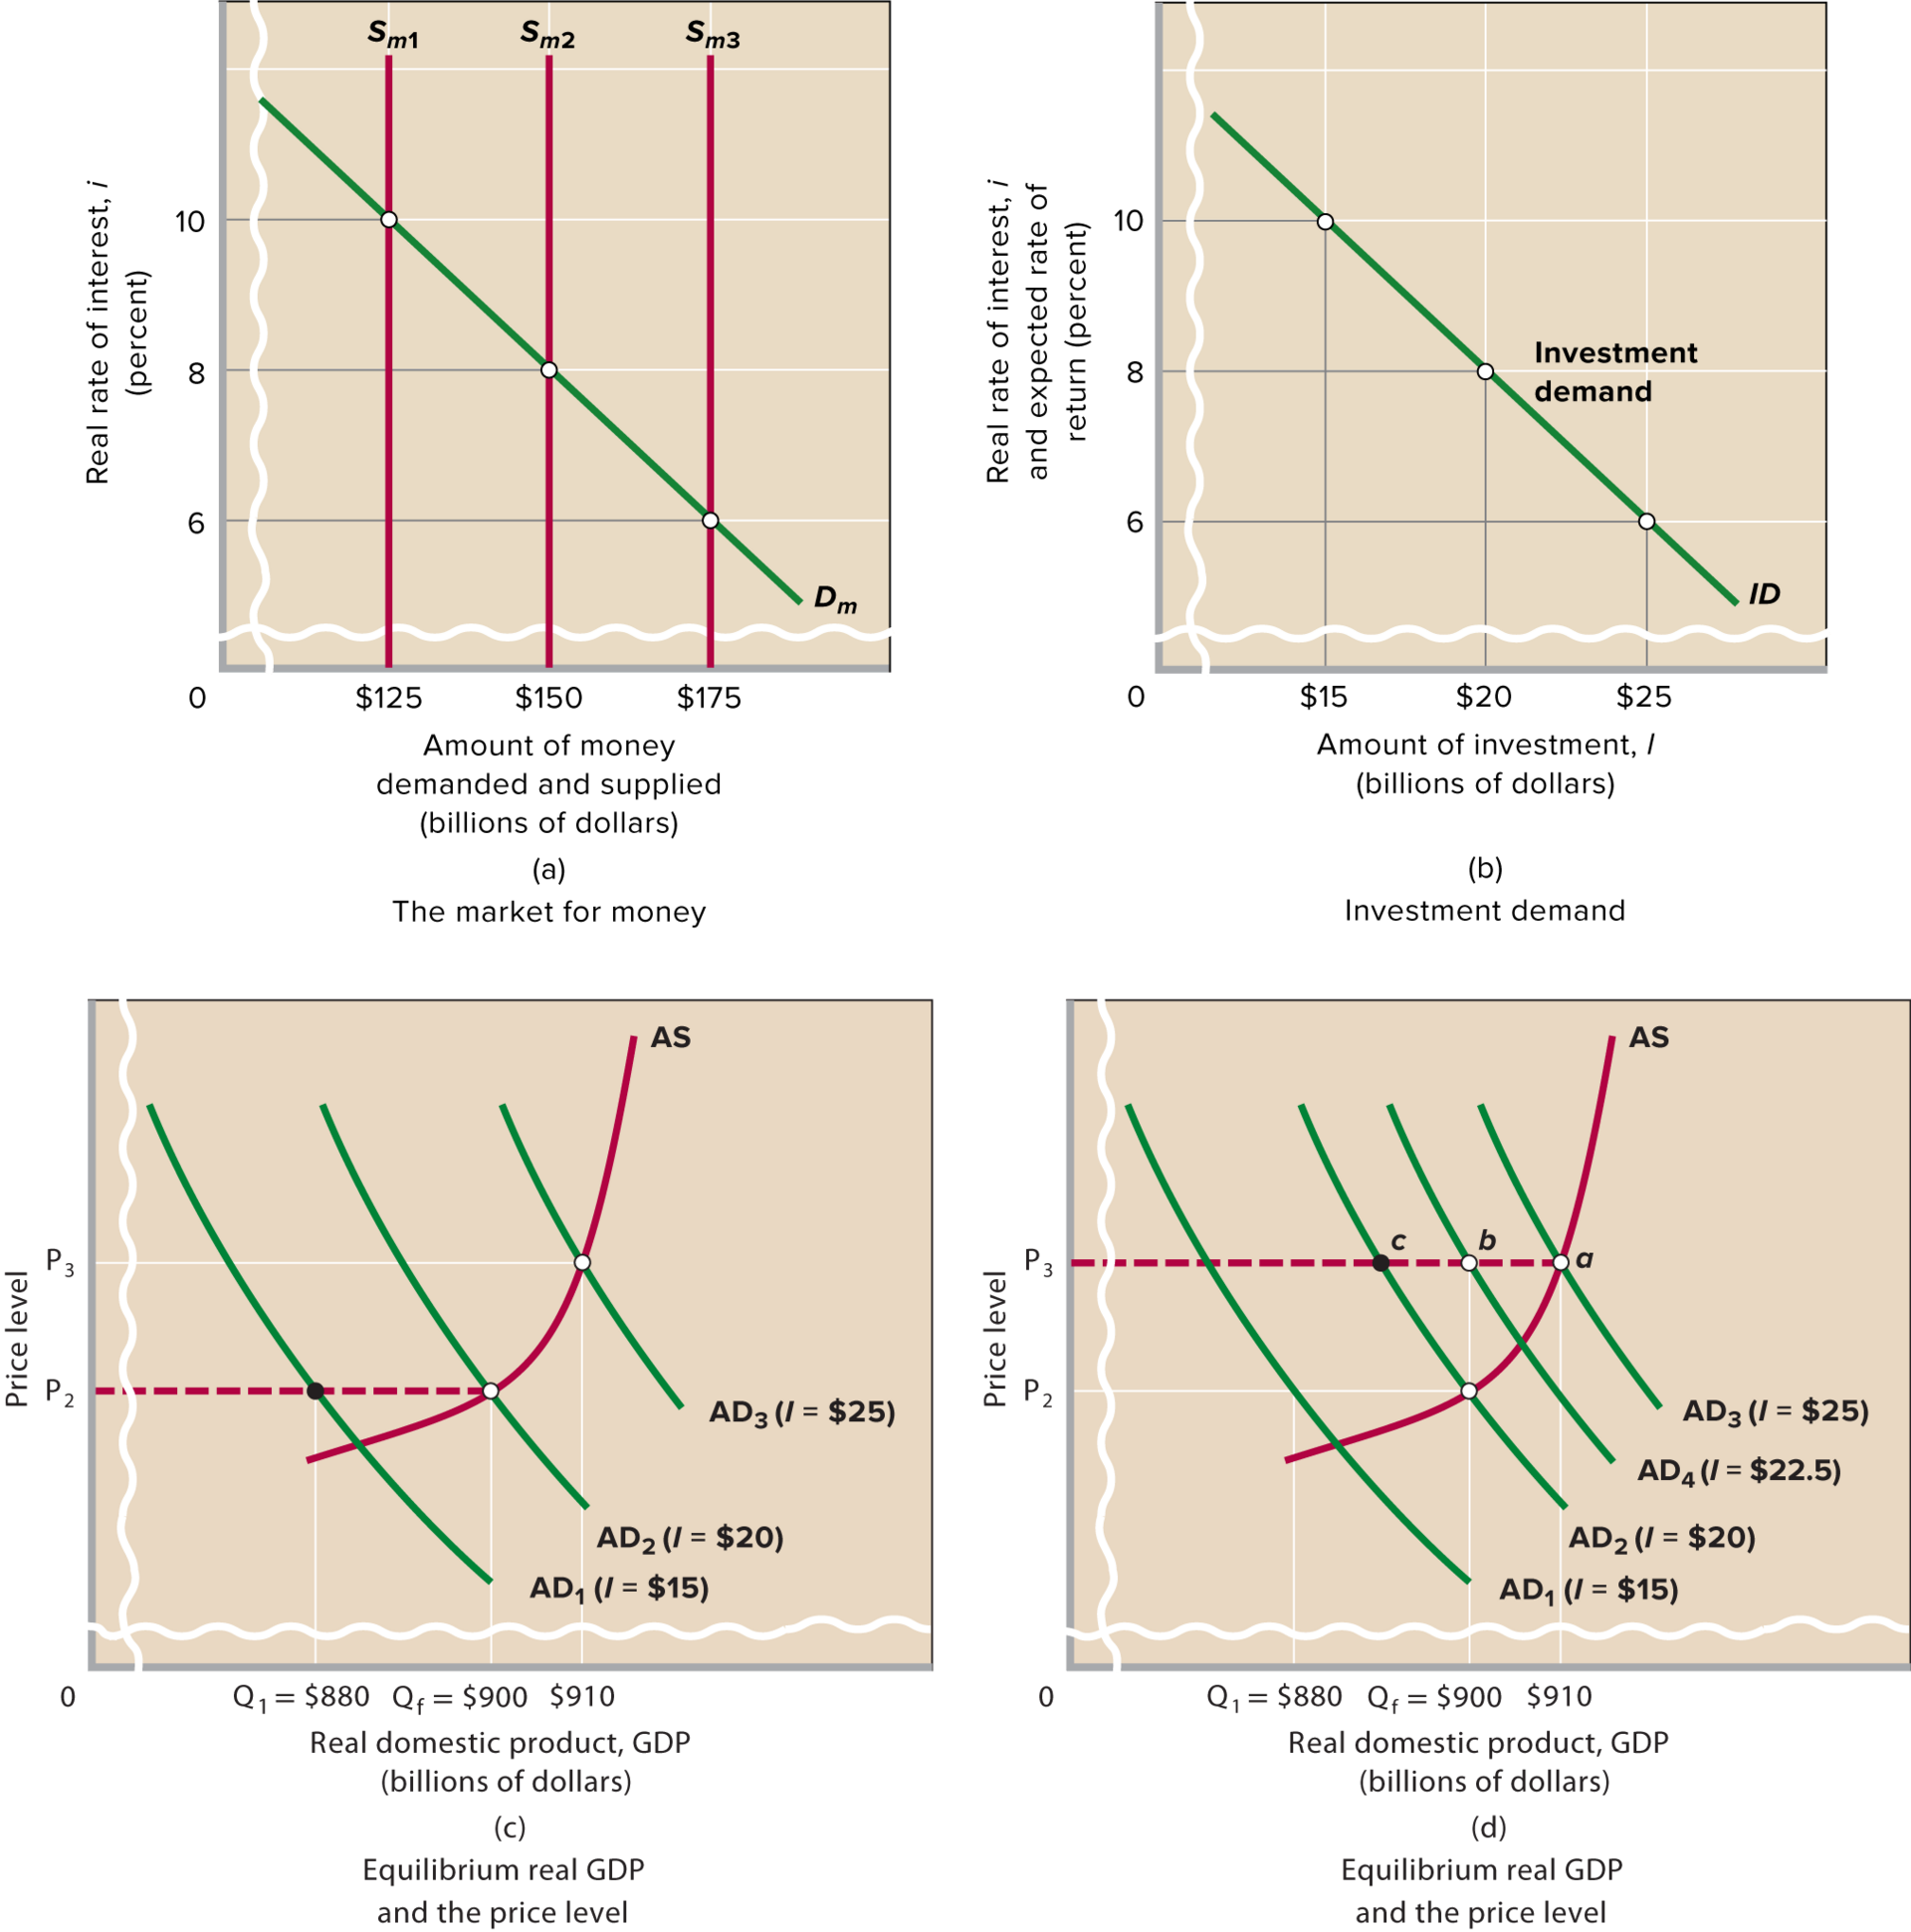
- graph a represents the market for money
- the demand and supply curves for money are brought together
- shows three potential money supply curves Sm1, Sm2, and Sm3
- In each case, the money supply is shown as a vertical line representing some fixed amount of money determined by the Fed.
- portrays real interest rates
- real interest rate (not nominal) is critical for investment decisions
Investment
- graph b is an investment demand curve
- shows the inverse relationship between the interest rate and the amount of investment spending.
- ex. At 10 percent interest rate, it will be profitable for the nation’s businesses to invest $15 billion
- Changes in the interest rate mainly affect the investment component of total spending, although they also affect spending on durable consumer goods (such as autos) that are purchased on credit.
- The impact of changing interest rates on investment spending is great because capital purchases (equipment, factories, etc) are large cost and long-term.
Equilibrium GDP
- graph c shows the impact of three real interest rates and corresponding levels of investment spending on aggregate demand.
- Suppose the money supply in graph a is $150 billion (Sm2), producing an equilibrium interest rate of 8 percent
- In graph b we see that this 8 percent interest rate will bring forth $20 billion of investment spending
- This $20 billion of investment spending joins with consumption spending, net exports, and government spending to yield aggregate demand curve AD2 in graph c
- The equilibrium levels of real output and prices are Qf = $900 billion and P2, determined by the intersection of AD2 and aggregate supply AS.
Effects of an Expansionary Monetary Policy
focus on graphs a, b, and c
the ratchet effect describes the real-world prices tend to be downwardly inflexible
- with our economy starting from the initial equilibrium where AD2 intersects AS, the price level will be downwardly inflexible at P2 so that aggregate supply is horizontal to the left of Qf.
- if aggregate demand decreases, the economy’s equilibrium will move leftward along the dashed horizontal line in graph c
- this would happen if the money supply fell to $125 billion (graph a)
- AD would shift left to AD1 and real output would fall to $880 billion, $20 billion less than full-employment output (graph c)
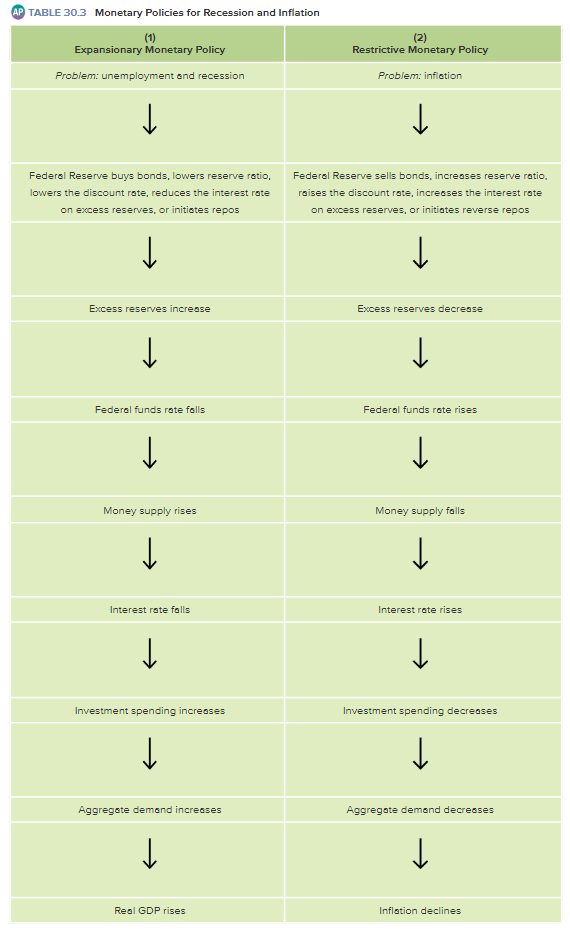
Fed will implement an expansionary monetary policy to increase excess reserves and lower the federal funds rate
Because excess reserves are how commercial banks and thrifts can earn profit by lending, the nation’s money supply will rise.
^^An increase in the money supply will lower the interest rate, increasing investment, aggregate demand, and equilibrium GDP.^^
- if money supply increases from $125 billion to $150 billion (Sm1 to Sm2):
- interest rate falls from 10 to 8 percent (graph a)
- investment increases by $5b from $15b to $20b (graph b)
- AD will shift right by the $5b * the spending multiplier (in this case, the multiplier is 4 and AD increases by $20b from AD1 to AD2 in graph c)

Effects of a Restrictive Monetary Policy
- focus on graphs a, b, and d
- economy moves from a full-employment equilibrium to operating at more than full employment so inflation is a problem and prompts restrictive monetary policy
- money supply increases from Sm2 to Sm3
- investment increases from $20 billion to $25 billion
- aggregate demand increases from AD2 to AD3
- output increases from the full-employment $900 billion to $910 billion
- when restrictive monetary policy is implemented
- Banks discover that their reserves are below those required and that the federal funds rate has increased.
- banks reduce their checkable deposits by refraining from issuing new loans as old loans are paid back.
- This will shrink the money supply and increase the interest rate.
- the ^^higher interest rate will discourage investment, lowering aggregate demand and restraining demand-pull inflation.^^
- the Fed cannot reduce the money supply all the way back to where it started b/c of the ratchet effect
- doing so would cause a recession
- if the Fed reduced the money supply back to Sm2, AD would shift from AD3 back to AD2
- but equilibrium would move across the dotted line from point a to point c b/c prices would not lower with the money supply (graph d)
- output would be below Qf=$900b
- Fed should move AD leftwards from AD3 to AD4 instead
- decrease aggregate demand by $10 billion so that equilibrium output falls from $910 billion at point a to Qf = $900 billion at point b
- shift money supply to $162.5 billion (graph a), resulting in an interest rate of 7% and investment spending of $22.5 billion (graph b)
- investment has reduced by $2.5 billion
- with the multiplier of 4, AD will move left by $10 billion (4 * $2.5 billion) to full-employment output of $900 billion
Monetary Policy: Evaluation and Issues
- Monetary policy has become the dominant component of U.S. national stabilization policy
- It has two key advantages over fiscal policy:
- speed and flexibility
- can be quickly altered while the application of fiscal policy can be delayed for months
- the Fed can buy or sell securities from day to day and affect the money supply and interest rates almost immediately.
- isolation from political pressure
- members of the Fed’s Board of Governors are appointed and serve 14-year terms
- so they are relatively isolated from lobbying and don’t need to worry about retaining popularity with voters
- they can readily can engage in politically unpopular policies (higher interest rates) that may be necessary
- monetary policy is subtler and more politically neutral than fiscal policy
- Changes in government spending directly affect the allocation of resources and changes in taxes can have extensive political ramifications
Recent U.S. Monetary Policy
The 2007–2009 Recession
- The Fed lowered the federal funds rate to near zero in response to the financial crisis
- helped to stabilize the banking sector and keep credit flowing, offsetting at least some of the damage done by the financial crisis
- most agree that the Fed’s actions were quick and innovative
- some economists claim that the Fed contributed to the financial crisis by holding the federal funds interest rate too low for too long during the recovery from the 2001 recession
- They say that the artificially low interest rates made mortgage and other loans too inexpensive and contributed to the borrowing frenzy
- Other economists counter that the low mortgage interest rates resulted from huge inflows of savings from abroad to a wide variety of U.S. financial markets.
After the Great Recession
- The U.S. economy recovered very slowly from the Great Recession of 2007–2009, especially in terms of employment
- The Fed moved towards a zero interest rate policy, or ZIRP in December 2008
- zero interest rate policy (ZIRP)::
- A monetary policy in which a central bank sets nominal interest rates at or near zero percent per year in order to stimulate the economy.
- Fed also acted as a lender of last resort, purchasing securities from banks and other financial institutions
- The purchases were so massive that the banking system’s excess reserves skyrocketed
- The solution was quantitative easing (QE):
- the Fed bought bonds solely with the intention of increasing the quantity of reserves in the banking system.
- Interest rates remained at the same (low but positive) levels to avoid the zero lower bound problem, but with excess reserves increasing, banks would lend more and stimulate the economy.
Problems and Complications of Monetary Policy
1. Lags
- Like fiscal policy, monetary policy faces a recognition lag and an operational lag
- but because the Fed can decide and implement policy changes within days, it avoids the administrative lag
- recognition lag affects monetary policy because of normal monthly variations in economic activity and the price level
- the Fed may not quickly recognize when a recession or inflation is actually starting
- Once the Fed acts, an operation lag of 3 to 6 months affects monetary policy
- that much time is typically required for interest-rate changes to have their full impacts on investment, aggregate demand, real GDP, and the price level.
2. Cyclical Asymmetry and the Liquidity Trap
- Monetary policy may be highly effective in controlling inflation but ineffective in pushing the economy from a severe recession
- cyclical asymmetry::
- The idea that monetary policy may be more successful in slowing expansions and controlling inflation than in extracting the economy from severe recession.
- The reason for this asymmetry is the asymmetric way in which people act in response to changes in bank reserves
- a restrictive monetary policy can deplete commercial banking reserves until banks must reduce the volume of loans.
- That means a contraction of the money supply, higher interest rates, and reduced aggregate demand.
- The Fed can absorb sufficient reserves and achieve its goal.
- But the Fed cannot be certain of achieving its goal when it adds reserves to the banking system because of the liquidity trap
- liquidity trap::
- a situation where adding more reserves (and therefore liquidity) to banks has little or no additional positive effect on lending, borrowing, investment, or aggregate demand
- ex.
- the Fed creates billions of dollars of excess reserves, driving down the federal funds rate and prime interest rate, but lending does not increase
- The Fed can create excess reserves, but it cannot guarantee that the banks will actually make additional loans and thus promote spending
- households and businesses may choose not to borrow excess reserves made available as loans
- when the Fed buys securities from the public, people may choose to pay off existing loans with the money received, rather than increase their spending on goods and services
- a severe recession may so undermine business confidence that the investment demand curve shifts to the left and overwhelms the lower interest rates associated with an expansionary monetary policy
- The liquidity trap during the severe recession was a primary reason why public policy in the United States turned toward fiscal policy in 2009