4.1b: Research methods
Hypotheses
These are statements that describe the aims of the study, as well as the outcome the investigator believes will occur.
It is done by operationalising - making measurable - the IV and DV.
Null hypothesis
Null hypothesis state there will be no relationship between the variables/no correlation.
For example, there will be no correlation between caffeine consumption and scores on a math test
Non-directional hypothesis
This states there will be a relationship between the variables, but not in which direction.
For example, there will be a difference in the math scores of those who have consumed caffeine and those who have not.
Directional hypothesis
This states there will be a relationship between the variables, and says what direction this relationship will occur.
For example, those who consume caffeine will have higher scores on a math test than those who don’t.
Variables
Variables are factors liable to change, and within a study there are many an experimenter must consider.
Some are directly manipulated by the researcher, and some are monitored and controlled.
Independent variable (IV)
Variable that is manipulated by the researcher in order to make it an experiment.
Dependent variable (DV)
The variable measured by the researcher.
If the study is effective, this will change slightly with the IV.
Extraneous/ confounding variables (EV)
EVs are variables other than the IV that may influence the DV.
These need to be controlled to have a successful study.
Confounding variables are usually found after an experiment, and are EVs that actually affected the study’s result. There are many types of these variables:
Confounding variables
These only affect individual participants, and are normally only discovered after a study once looking at outlying data.
An example is mood.
Situational variables
Environmental factors that may affect the participants, such as lighting, temperature and sound.
These are overcome using standardised procedures, which ensure all participants are tested under the same conditions.
Participant variables
This is the differences in participants, such as skills, emotional state and age.
This can be overcome using a repeated measures design, where the same participants are used in each condition.
Alternatively, a matched pairs design could be used, where participants are matched on a characteristic that may affect their results. For example, natural math ability may give participants higher scores on a math test.
Experimenter/investigator effects
The experimenter may unconsciously push participants to act a certain way, usually based on the outcomes they wish the study to have.
This is known as researcher bias. This can be done through small clues about the aims of the experiment, such as in leading questions or verbal and non-verbal encouragement.
This can be overcome with the double-blind technique, where the experimenter is also unaware of the aims of an experiment. For example, the experimenter may ask ‘why do you hate ---’ instead of ‘what are your opinions on ---‘.
Another version of experimenter effects is how their traits may subconsciously affect the participants, e.g gender, age or accent. For example, participants may not listen to a younger experimenter as they believe them to be less capable.
Demand characteristics
This is when a participant actively looks for clues on how they should behave in a study.
This is achieved by them guessing the purpose of the study, and acting in ways to disrupt the results. This can be them acting in a way to prove or disprove the studies aims.
This can be overcome using the double blind technique, where the experimenter is unable to reveal the aims as they are also unaware. For example, if the study is about math ability, the participant may purposely do badly on the math test.
Sampling methods
These are methods of recruiting people for a study, all with different advantages and disadvantages.
They will focus on the study’s target population - the sect of the population they wish to investigate. If the study is successful, the results can be generalised across the target population.
Random sampling
People are picked completely randomly from the target population.
This avoids any potential researcher bias, such as them only picking people who only fit a certain characteristic.
It is cheap, easy and fast.
Some minority groups may be skipped over by the randomiser, making the results ungeneralizable.
Systematic sampling
This involves listing all members of the target population and picking every nth participant, e.g every third or fifth.
Avoids researcher bias, and is cheaper.
If there is a large target population it may be difficult to compile the names of every person in order to create a full list, and then to pick every third person may be too time consuming.
May accidentally skip over some minority groups.
Opportunity sampling
Anyone available to participate is asked to participate, usually used in question studies.
This is the sampling method used most often.
Fastest and easiest way to study.
Allows for a large sample size.
This allows for researcher bias in who they decide to ask, and depending on the location selected will only target a small section of their target population.
Often these are done at universities, meaning lower class and older people are left out entirely.
Volunteer sampling
People volunteer to participate instead of being asked directly.
This is done via advertising the sample and allowing all volunteers to participate.
Easy and fast.
An advertisement is able to reach many people, leading to a large sample size.
This leads to issues as only certain people will volunteer, such as people interested in the study or those who want to help, causing a bias in the results.
Stratified sampling
The target population is divided into subgroups (stratas) and the percentage of them within the population is calculated. This will then be mimicked in the study, for example if the population is made up of 2% immigrants then 2% of those studied will be immigrants, with the exact people randomised.
Allows for a more representative sample, therefore more generalisable.
This is extremely difficult, as it takes a large amount of research to split the population into stratas.
Additionally, this can still have researcher bias, as a person may decide to include or exclude groups based on personal opinions.
It is more expensive and time consuming.
Snowball sampling
This is done by asking one person, who invites another person, who invites another person, etc.
This is less time consuming, money efficient and makes it easy to access a large group.
However, participants are likely to be extremely similar due to their close contact with each other.
It also allows for research bias in who the investigator first asks.
Validity
Validity is how well the IV and DV are measured, and whether any EVs or CVs affect the results. There is many different types.
Internal validity
This is what happens inside of a study, whether EVs are controlled enough to stop them from becoming CVs. It is valid if only the IV affected the DV. It is also how well operationalised the IVs and DVs are.
External validity
How well the results can be generalised across the target population. If they cannot be generalised, it means a selective group of participants were chosen and they don’t represent the population as a whole. This is also known as mundane realism - how realistic the study is. There are many types of external validity:
Ecological validity - This is the extent of how well the study can be generalised to other settings and environments.
Population validity - This is the extent of how well the results can be generalised to the rest of the population and the target population.
Measures of validity
Face validity - Method for checking validity where the measure is checked to see whether it looks like it measures what it is supposed to - whether it appears that the measure works.
Concurrent validity - Method for checking validity where the measure is tested based on how it compares to other existing measures.
Content validity - Method for checking validity where the measure is checked for whether it actually measures what it intends to.
Construct validity - Method for checking validity where the measure is checked for whether it actually measures all parts of what it aims to test.
Predictive validity - Method for checking validity where the measure is checked for whether it can be used to make testable predictions.
Reliability
Reliability is how well the study can be replicated with the same results. Some things cannot be replicated, such as earthquakes and other natural disasters.
There are many ways to measure this:
Test-retest:
A test is administered to the same group twice and the findings are compared. These are usually over a certain amount of time, to check for external, or temporal, validity.
Split-half:
The study is split into halves, which are then compared. This measures the internal validity.
Inter-rater:
Different measures are used and findings are compared. Only used for qualitative data.
Inter-observer:
Different observers are used to look at the same content.
Used for content/thematic analysis, or observations.
Experimental measures
Different ways of organising studies.
Studies have two conditions, the control and experimental.
The control is the baseline, and there can be multiple experimental conditions.
For example, a study measuring caffeine’s effect on math ability will have a control condition of participants with no caffeine taking the study, and the experimental conditions will be varying levels of caffeine consumption.
Repeated measures design
The same participants are used in both conditions, in order to avoid participant variables.
It also requires less participants, and is therefore cheaper.
It can cause demand characteristics.
It can also cause order effects - participant fatigue from repeating a study.
Order effects can be overcome using counterbalancing, of which there are two types. In these scenarios, A represents condition 1 and B condition 2.
AB or BA: The group is split, one doing the test in the morning first and the other doing it second. This cancels out the order effects of both groups.
ABBA: The entire group performs the conditions four times, and results of trials 1 and 4 and 2 and 3 are compared.
Independent measures design
Different participants are used in each condition.
Avoids demand characteristics and order effects.
Participant effects can cause issues.
Participant variables can theoretically overcome using random allocation, however in practice this rarely works.
It is also more expensive as more participants are needed.
Matched pairs design
Participants are matched on a certain characteristic that directly causes issues in a study, such as math ability for a study involving a math test.
Pilot studies are often used to identify the participant variables most likely to cause issues.
This means order effects, demand characteristics and most of participant variables are covered.
However, it is more time consuming and expensive.
Data types
There are many categories data can fall into, including the collection type, the level of measurement and the form of measurement.
Collection type
Primary data
This is data collected directly by the researcher.
It gives the researcher more control over the variables and allows it to fit the research exactly.
Can be time consuming and expensive.
Secondary data
This is data collected from already existing research.
It is cheaper, quicker and easier, however the researcher is no longer in control.
There is no guaranteed validity or reliability.
The experiment may not exactly fit the research.
Type of measurement
Quantitative data
This is numerical data, allowing it to be divided into many different charts and across every level of measurement.
It can range from ratings on a scale, to test scores, to hormone levels.
It is easier to compare data sets, but isn’t extremely in depth.
Qualitative data
This is written data, such as interviews, articles and questionnaires.
It is harder to compare data sets with overall values, but is quite in depth.
Levels of measurement
Nominal data
This is the lowest level of measurement, with data separated into named categories, e.g male and female, yes and no.
Data cannot overlap into multiple categories. It is usually used to measure frequencies.
When plotted onto a graph, this is normally a bar chart.
Ordinal data
This is the middle level of measurement, with ranked data categories, e.g happiness scales and positions in a race.
There is no equal measure between the ranks.
Interval/ratio data
The highest levels of measurements.
These two use real measurements of two numerical data sets, and always have an equal difference between them.
Ratio has a true 0, meaning it cannot go into the negative numbers, while interval can.
For example, interval is used for temperatures and ratio is used for height.
Measures
Measures are used to help summarise and explain data, as well as highlight issues.
Measures of central tendency
These are measures that help find the average of a data set.
Mean
This is when the data is added together, and then divided by the number of individual data points.
This can only be used for ratio and interval data.
This is quite representative, as all data points are used.
However, this means anomalous data can disrupt the results dramatically.
Mode
The mode is simply the most common data point.
It can be used for all sets of data.
It is unaffected by extreme values.
It doesn’t consider all data sets.
Additionally, sometimes multiple numbers can fit this criteria, which renders it useless.
It is also not helpful for small data sets.
Median
Median is when all numbers are ordered numerically, and the middle is found.
If there are two middle numbers, they are added and divided by two.
It cannot be used for nominal data.
It is unaffected by extreme values.
Doesn’t represent all data points.
It is also time consuming and unusable for large sets of data.
Measures of dispersion
These are needed to measure the amount of variability between data sets - which show how accurate the mean is.
Range
This is calculated by: highest data point - lowest data point.
Easy and quick.
Susceptible to extreme anomalous data issues.
Cannot show the spread of each data point, and doesn’t include every point.
Standard deviation
This is calculated by a formula:
the square root of - the sum of (each data point (x)- mean of the data points(x with line on top)) squared ÷ amount of data points (n)- 1.
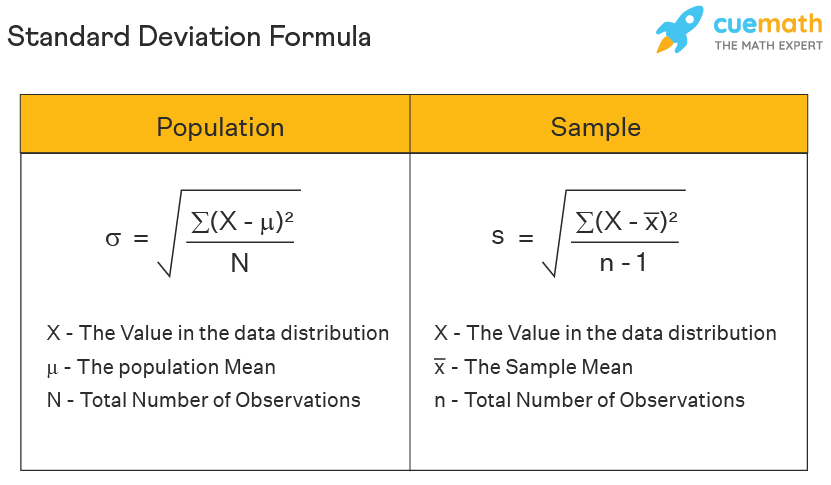

This is usually calculated through a table.
For example, a set of data with five points, 5, 7, 9, 15, 25. The mean is 12.2.
(Data point - mean) | (Data point - mean)2 | |
5 - 12.2 = -7.2 | 51.84 | |
7 - 12.2 = -5.2 | 27.04 | |
9 - 12.2 = -3.2 | 10.24 | |
15 - 12.2 = 2.8 | 7.84 | |
25 - 12.2 = 12.8 | 163.84 | |
Totals: | 5 - 1 = 4 | 260.8 |
Finally, 260.8 ÷ 4 = 65.2. 65.2 square rooted is 8.07(2DP).
This would make the mean quite inaccurate, as this is a high standard dispersion score.
Standard dispersion is used more widely, as it is more accurate than the range.
Representing data
This is done through charts and graphs, and helps visually represent the data trend.
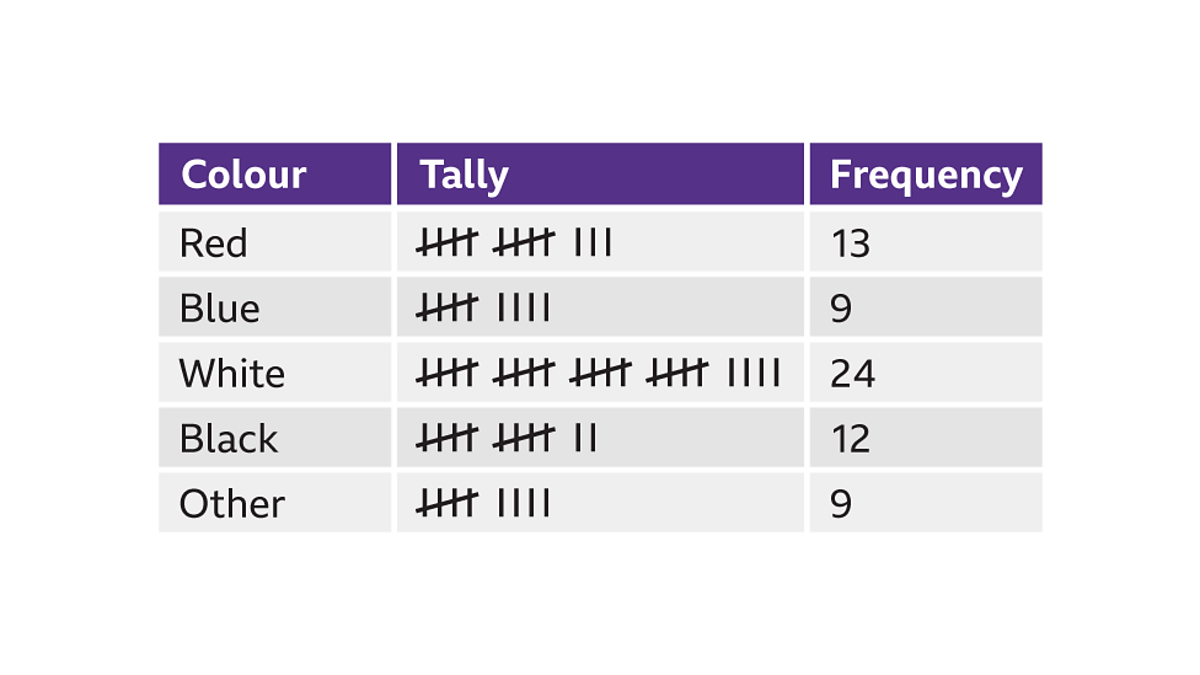
Frequency chart
This displays raw data, showing the amount of times a score occurred. It simplifies the data, but presents no trend.
Used for nominal data.
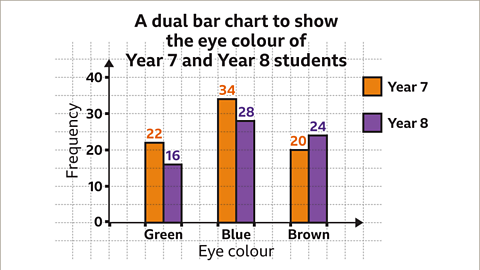
Bar charts
Bar charts show discrete data - data that can only fit in one category.
The categories are always named, with the variable on the horizontal line and it’s score on the vertical.
Used for nominal and ordinal.
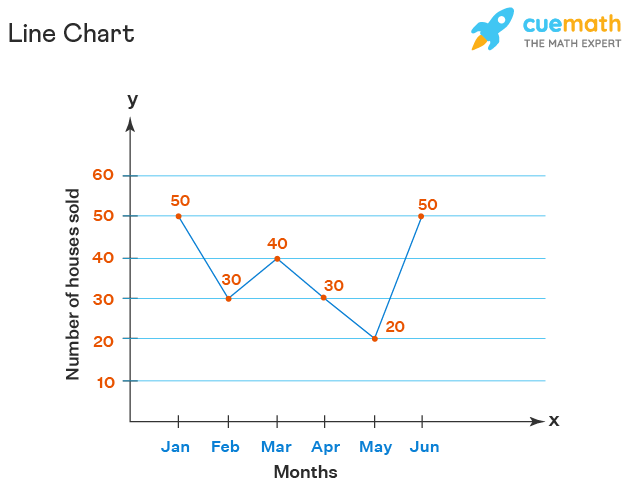
Line graphs
This presents quantitative data.
It has the variables on the horizontal line, and their scores on the vertical.
It is shown with dots on the points, which are all joined to each other.
It is used for interval and ratio data.
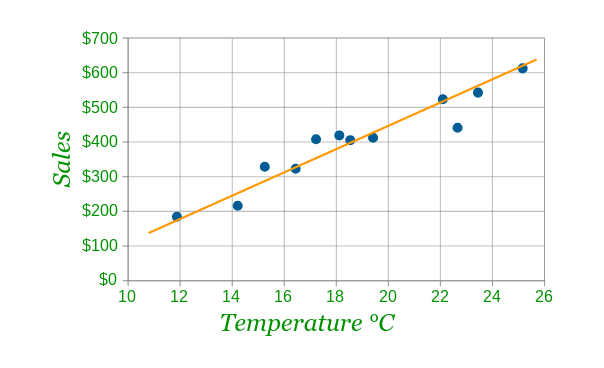
Scatter graphs
These are used to show correlation, with two numerical variables on the horizontal and vertical.
It uses a line of best fit - where the line does not go through every point but shows the overall trend. Of which there are three:
Negative correlation - as one variable increases the other decreases.
Positive correlation - as one variable increases, so does the other.
No correlation - no relationship can be seen between the variables, no line of best fit can be drawn.
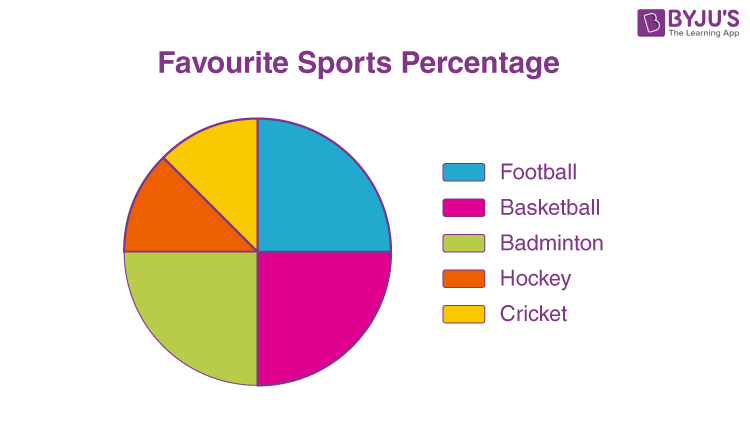
Pie charts
This is a circle with parts divided into named categories.
It is calculated by finding the total of all the data, and ÷ this into 360. This tells you how much one data point is worth, allowing you to draw these categories.
It can only be used for nominal and ordinal data, and is usually used to show popularity.
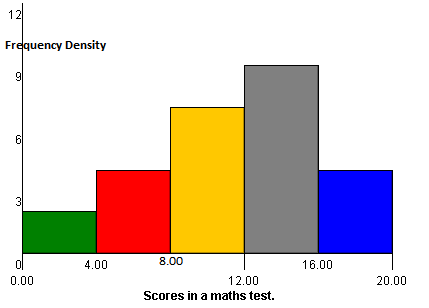
Histograms
These show population density, and are calculated from frequency graphs.
This is done by finding the difference between the boundaries and dividing this into the overall population density.
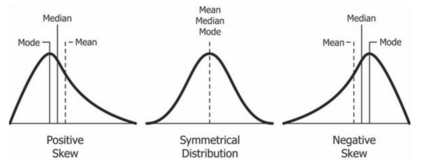
Distribution curves
This shows how data is distributed across values.
There are three types of distribution, positively skewed, normal and negatively skewed.
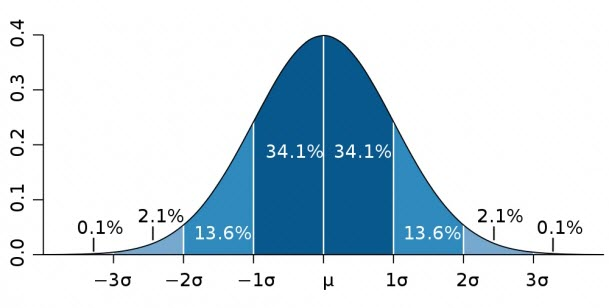
Normal distribution is a bell curve shape - peaks in the middle and equally declines either side. An example would be intelligence tests.
The middle value is the most common, and the values on the bottom use the standard deviation of the mean. If the standard deviation was 5, the three centre numbers would be 10, 15, 20.
To calculate the percentage of the sample within each measurement, normal distribution uses the 68%, 95%, 99.7% rule:
68% of the population is within the area one SD above and below the mean.
95% of the population is in the area two SD above and below the mean.
99.7% of the population is in the area three SD above and below the mean.
As these curves don’t end at the axis (they are continuous) 100% of the population cannot be found.
Positively skewed data leans to the left, and has an elongated right tail.
It occurs when the mean is higher than the mode and median.
An example is income, where the mean is affected by outlying high data.
Negatively skewed data leans to the right, and has an elongated left tail.
It occurs when the mean is lower than the mode and median.
Non-experimental methods
These are studies without an independent and dependent variable, instead with different ways of presenting information. Therefore, their variables are known as co-variables.
Correlational studies
These studies show a correlation - a relationship between two co-variables. This is shown through a scatter graph. It is done by asking the participant about the two variables, and then placing them accordingly on the graph.
After the graph is complete, the graph is then given a correlation coefficient. This is a number on a scale:
1 - high positive correlation, when when variables increases so does the other
0.5 - low positive correlation
0 - no correlation, no relationship visible between the variables
-0.5 - low negative correlation
-1 - high negative correlation, as one variables increases, the other decreases
Hypothesis are written differently, needing to reference correlation specifically, for example average caffeine intake and average test scores are positively correlated.
However, not all correlations equal causation. There are three explanations for every correlation:
X causes Y
Y causes X
Or an intervening variable causes these changes
Advantages are:
Correlation studies can help given experimenters ideas on how to investigate the variables further, determining cause and effect relationships.
This can work the other way, with no correlation saving researchers time on creating an experiment.
Can be used when replicating lifestyle choices is unethical, such as smoking and day drinking.
Can use existing data, such as attendance from schools.
Has high ecological validity, as there is no manipulation of behaviour required.
Correlations can be easily repeated, therefore high reliability.
Disadvantages are:
No cause and effect relationships can be inferred due to intervening variables.
There are still issues that remain relating to experiments, such as biased samples or invalid measurements.
A coefficient of zero may not form a random pattern, such as curvilinear patterns, which present as semi-circles.
Case studies
This is an in depth study of a group, person, institution or event. It uses a range of sources and examinations types, including interviews, questionnaires, etc.
This allows for a more in depth analysis, making it an idiographic method, often with qualitative data and longitudinal.
Advantages are:
Detailed information which may be missed by other research methods miss.
Rich data can develop new theories.
Information on unique circumstances which can be used to present wider theories.
High ecological validity.
Only method available for studying some situations due to ethical issues (injuries, trauma).
Disadvantages are:
Difficult/impossible to replicate, causing low reliability.
Lack of generalisability due to small sample size.
Cannot establish cause and effect.
Time consuming and expensive.
Methods can be subjective.
Longitudinal studies
These are studies that take place over long periods of time, such as years. They can track illness progression, aging, education, diet and childhood development.
Most case studies are also longitudinal studies, however not all longitudinal studies are non-experimental.
The same participants are usually used in a repeated measures design, by waiting a certain amount of time to retake the measurements, which could be a questionnaire, test or interview.
Strengths:
Participant variables are practically removed, as the people in both measurements are the same, differences can be attributed to the IV instead of any other factors.
These give deep insight, as they take place over time it allows us to see effects of various things, such as:
Aging.
Education.
Child development.
Weaknesses:
They are time consuming and expensive, as the people who take part must be tracked. Funding can run out before the study is completed.
Attrition, where people drop out of a study, increases with likelihood over time. This can be due to illness, boredom or death. This can cause a sample bias, where those remaining have similar traits, or a sample size too small.
Demand characteristics are likely, as the questions remain similar over time.
Order effects are also likely, as people are likely to get bored of repeated participation.
Cohort effects are generational experiences, as those born in the same time period would experience the same major events, such as children born in WW2 having poorer diets from rationing. This means the study may not be generalisable across multiple generations.
Self reporting techniques
These techniques involve a participant reports their own opinions and emotions about the topic.
Questionnaire
These are written questions responded to with written answers.
There are two different types of questions:
Open questions - the question is open for any response, with no limit to length. They produce qualitative data, which is more in depth but harder to generalise and analyse
Closed questions - the question has set responses which must be selected from. They produce quantitative data, which is easier to generalise and analyse. However, this can force people to pick unrepresentative answers, therefore lowering validity.
Strengths:
They are relatively easy to create, distribute and repeat.
Thoughts and feelings are directly asked instead of inferred.
Participants are more likely to reveal personal information due to anonymity and no fear of embarrassment.
Weaknesses:
People may deliberately answer in more socially acceptable ways due to the social desirability bias.
Leading questions can cause changes to responses, as seen in Loftus and Palmer.
A sample bias can be caused as certain people may be more likely to answer questionnaires.
They are inflexible as there is an unchangeable set of questions, so they cannot be tailored to specific needs.
Participants may lie or simply be unable to accurately report their feelings.
Questions can be interpreted differently, or read wrong.
Vague questions can lead to meaningless data, and questions may be left blank if too confusing.
Interviews
These are questions asked and responded to verbally, either over the phone or in person.
There are two types of interviews:
Structured - a set list of questions, which lead to less detailed responses and less depth as answers are restricted by the questions. These are easier to analyse, generalise and repeat.
Unstructured - while interviewers may have a few set answers, questions are allowed to veer off based on what the interviewer wants to ask or to continue a line of questioning. These are harder to analyse, but provide more in depth answers. It is hard to generalise as not all participants are asked the same questions, and is more open to interviewer bias.
Strengths:
Both quantitative and qualitative data can be collected based on different questions.
Weaknesses:
Interviewer bias may affect the participant, either by tone or leading questions.
Reliability can be affected by different interviewers, or the same interviewer acting differently.
Questions may be interpreted differently.
Content analysis
This is analysis of already existing content, for example, books, magazines, advertisements, etc to make statements on the world, for example stereotypes.
These are known as artefacts.
Type of observation and secondary data.
Can be used as a solo analysis or as a bigger study, such as a case study.
It identifies patterns or trends in order to make a conclusion.
It can develop quantitative data via tallying behavioural categories, which can be categories such as gender, clothing and actions.
It can also develop qualitative data via descriptions.
As the sample is not a group of people, it must be representative of ranges of content, such as different genres and authors.
Strengths:
High ecological validity.
No chance of demand characteristics.
Can be replicated by additional analysis.
Inter observer analysis can be used to check reliability.
Weaknesses:
Observer bias may occur.
Culture bias may occur.
No causal relationship can be derived.
Thematic analysis
Analyses content for themes.
Cross-sectional
Compare two or more groups of people who differ in some way, for example young and old people, men and women.
These groups are studied at the same time and are called snapshot studies as they are of a particular time.
Strengths:
Cheap and quick.
No risk of attrition.
Weaknesses:
Participant variables as independent groups is used.
Cohort effects if they are across different ages.
Superficial understanding of why differences may occur, no causal effects can be made.
Only provides a snapshot.
Observations
Observations are observations of behaviour, and can be quantitative or qualitative data. Examples are the Little Albert and Bandura Doll observations.
There are two types of methods:
Event sampling - tallying how frequently behaviours occur within one time frame.
Time sampling - tallying how frequently behaviours occur across multiple time intervals, such as every ten minutes.
There are two ways the research could be conducted:
Covert observation - observation done in secret, so the people being observed don’t know it is happening.
Strengths:
Reduces risk of demand characteristics and social desirability bias.
High ecological/external validity as this is a field experiment.
Weaknesses:
No informed consent is obtained, so based on the way data is used this may be unethical. For example, personal data such as names cannot be used.
No in depth data can be taken ethically, and no personal questions can be asked.
Overt observation - observation is done with informed consent from participants.
Strengths:
More ethical due to the informed consent.
A rapport can be built with participants meaning more in depth data can be obtained.
Weaknesses:
Demands characteristics are likely to occur.
People may conform to the social desirability bias.
May have low external validity, as it can take place in a lab and have a non-generalisable sample.
Brain scans
Brain research used to only take place post-mortem, such as by Paul Broca, who studied the brains of patients with speech production issues and found damage to one specific area.
EEG (ElectroEncephaloGram)
A brain scan where electrodes are placed on the scalp, and the electrical activity of different parts of the brain can be measured.
Often used for epilepsy and sleep studies.
Strengths:
The least invasive brain scan.
Does not require injections.
Does not require placement into a machine, which can trigger claustrophobia.
Weaknesses:
Not very accurate, can only give indications to the sources of the signal, not the specific brain areas.
CAT (Computed Axial Tomography)
A series of x-rays taken of the brain, which are combined to form 2D or 3D images.
Often, a dye is injected into the patient as a contrast material.
They are often used to detect abnormalities and advise courses of treatment.
Strengths:
It provides high quality images.
They are useful for showing abnormal structures, such as tumours, and structural damage.
Weaknesses:
They require more radiation exposure than normal x-rays, and take longer, as multiply x-rays are taken.
Only structural information is provided.
MRI (Magnetic Resonance Imaging)
Magnetic fields are used which cause the atoms in the brain to change their alignment.
Often used to diagnose brain abnormalities or injuries.
When turned off, various radio signals are emitted which are read by a detector to map the structure of the brain.
Strengths:
Use magnets so an individual is not exposed to radiation.
Give a more detailed image of the soft tissues in the brain.
Provide detailed, 3D images.
Weaknesses:
Takes a long time.
Can cause claustrophobia.
Extremely loud.
Quite expensive.
fMRI (functional Magnetic Resonance Imaging)
Magnetic fields are used which cause the atoms in the brain to change their alignment.
Can provide both structural and functional information by taking images of the brain in action.
Often used to show which areas of the brain are used in certain activities.
Strengths:
Use magnets so an individual is not exposed to radiation.
Give a more detailed image of the soft tissues in the brain.
Provide detailed, 3D images.
Show functions of different brain areas.
Weaknesses:
Take a long time.
Can cause claustrophobia.
Extremely loud.
Quite expensive.
PET (Positron Emission Tomography)
Slightly radioactive glucose is injected into a patient.
The areas with the most activity would need this glucose more, and radiation detectors are used to see these areas.
This shows the most active areas of the brain, and takes 10-40 minutes to complete a scan.
They can be used to check certain brain disorders, and also how certain activities affect certain areas of the brain.
Advantages:
Reveal chemical information, such as whether a tumour is malignant or benign.
They can show the brain in action.
Weaknesses:
It is extremely costly.
Can only be used a few times due to radioactivity.
Less precise than MRI.
Research location
Field experiments
These are experiments that occur in a natural environment, such as a school, street or hospital.
Strengths:
Higher mundane realism as situation is less artificial than a lab. Leads to higher ecological validity and higher external validity.
Lower chance of demand characteristics and participant effects as aims are less obvious and some people may not be aware they are even in an experiment.
Causal effects can be established as IV is controlled and DV is measured.
Weaknesses:
Extraneous and confounding variables are harder to control are experimenter does not have complete control over the experiment. This reduces internal validity.
Ethical issues arise as participants may not be aware their in a study and therefore do not give informed consent. This leads to privacy issues. Additionally, participants are deceived and may be placed in a situation that causes psychological harm.
Lower reliability, as they are harder to replicate due to lack of control over the environment.
Online experiments
Experiments that occur online, usually via questionnaires that are posted on social media.
This uses volunteer sampling, as people have to choose to fill them in.
Strengths:
Large samples are easy to obtain.
More diverse sample as most experiments usually use WEIRD participants.
Cheaper than face to face research, and software is easy to operate without hiring assistants.
Easy to replicate, high reliability.
Weaknesses:
Could have low population validity, as older people are online less.
Limited to mainly questionnaires.
Impossible for researcher to know extraneous or confounding variables as they are filled in by people in unknown environments.
Anonymity makes people more likely to lie, minimise or exaggerate their behaviour.
Informed consent is difficult as no participant will be likely to read through all the information.
Children may participate by lying about their age.
Lab experiments
Experiments that occur in a controlled environment, which doesn't have to be a lab, but any location with standardised procedures.
Strengths:
Experimenter has total control over the situation, and can remove all extraneous variables. This gives it high internal validity.
Usually result in quantitative data, which is highly objective.
Has high reliability as the standardised procedures can be replicated by other researchers.
Weaknesses:
Low ecological validity due to an artificial environment, which results in a lowered external validity.
Participants are likely to be aware they are in an experiment and demand characteristic may arise.
Quasi experiments
Experiments where the IV is not directly manipulated by the researcher and is naturally occuring.
There are two types, natural and difference studies.
Natural studies study a naturally occurring event, such as a natural disaster.
Difference studies look at pre-existing differences between participants, such as men and women.
Strengths:
Allow for research of real problems which can not be explored otherwise due to ethical and practical issues.
Weaknesses:
Causal conclusions cannot be drawn as IV is not directly manipulated. This causes low internal validity.
Experimental conditions cannot be randomly allocated, as there the IV is pre-existing.
Due to lack of control, EVs cannot be controlled for. The experiment is limited by real events, such as waiting for an earthquake to happen.
Replication is difficult, as researchers would have to wait for another similar event to occur in order to check the results.
Low generalisability as there is no choice as only a limited number of people can participate. This causes low external validity.
Ethical issues
BPS guidelines have to be followed in order for an experiment to be allowed.
However, these are vague and have many loopholes.
There are five mains areas of ethical issues:
Right to withdraw:
People must be allowed to leave.
If given money, they may feel obligated to stay.
BPS require this right to be evident at all times.
Deception:
If deception is done (via lying about the aims) a debrief must be done afterwards.
A debrief is a small interview to ask about the person’s welfare and outline the aims of the study.
However, this cannot be done for observation/field experiments as the people are not tracked down.
Risk of harm:
Psychological and physical harm should not occur to participants.
Consent:
A consent form should be filled in before the experiment, even though this cannot contain the full aims to avoid demand characteristics.
This cannot be done in field experiments, as people are not asked to participate.
There is presumptive consent, which is when a similar group consents and so consent is assumed.
There is also retrospective consent, which is given after the study.
BPS ethical guidelines require full informed consent.
Confidentiality:
A person’s name and personal information are kept private.
Privacy:
A person’s data is protected, and they cannot withdraw their data anytime during the experiment and during the debrief.
Inferential statistics
Table
Type of test Correlation or difference? Level of measurement Independent or related data Calculated values need to be equal or … to critical values | ||||
Chi-squared (X2) | Difference | Nominal | Independent | More than |
Sign test (s) | Difference | Nominal | Related | Less than |
Mann-Whitney U (U) | Difference | Ordinal, interval or ratio | Independent | Less than |
Wilcoxon (T) | Difference | Ordinal, interval or ratio | Related | Less than |
Spearman’s rank order | Correlation | Ordinal, interval or ratio | Related | More than |
Helpful terms to remember:
R in the name equals up (chi-squared, spearman’s rank order)
If there’s a -, it’s independent data.
Terms for looking at a data table:
One-tailed: For directional hypotheses.
Two-tailed: For non-directional hypotheses.