Chapter 12 - Monopolistic Competition Overview
Monopolistic Competition Overview
Characteristics:
A large number of sellers in the market.
Product differentiation allows firms to offer unique products.
Easy entry and exit from the market.
Firms engage in non-price competition (e.g., advertising), which reduces competition and enhances pricing power.
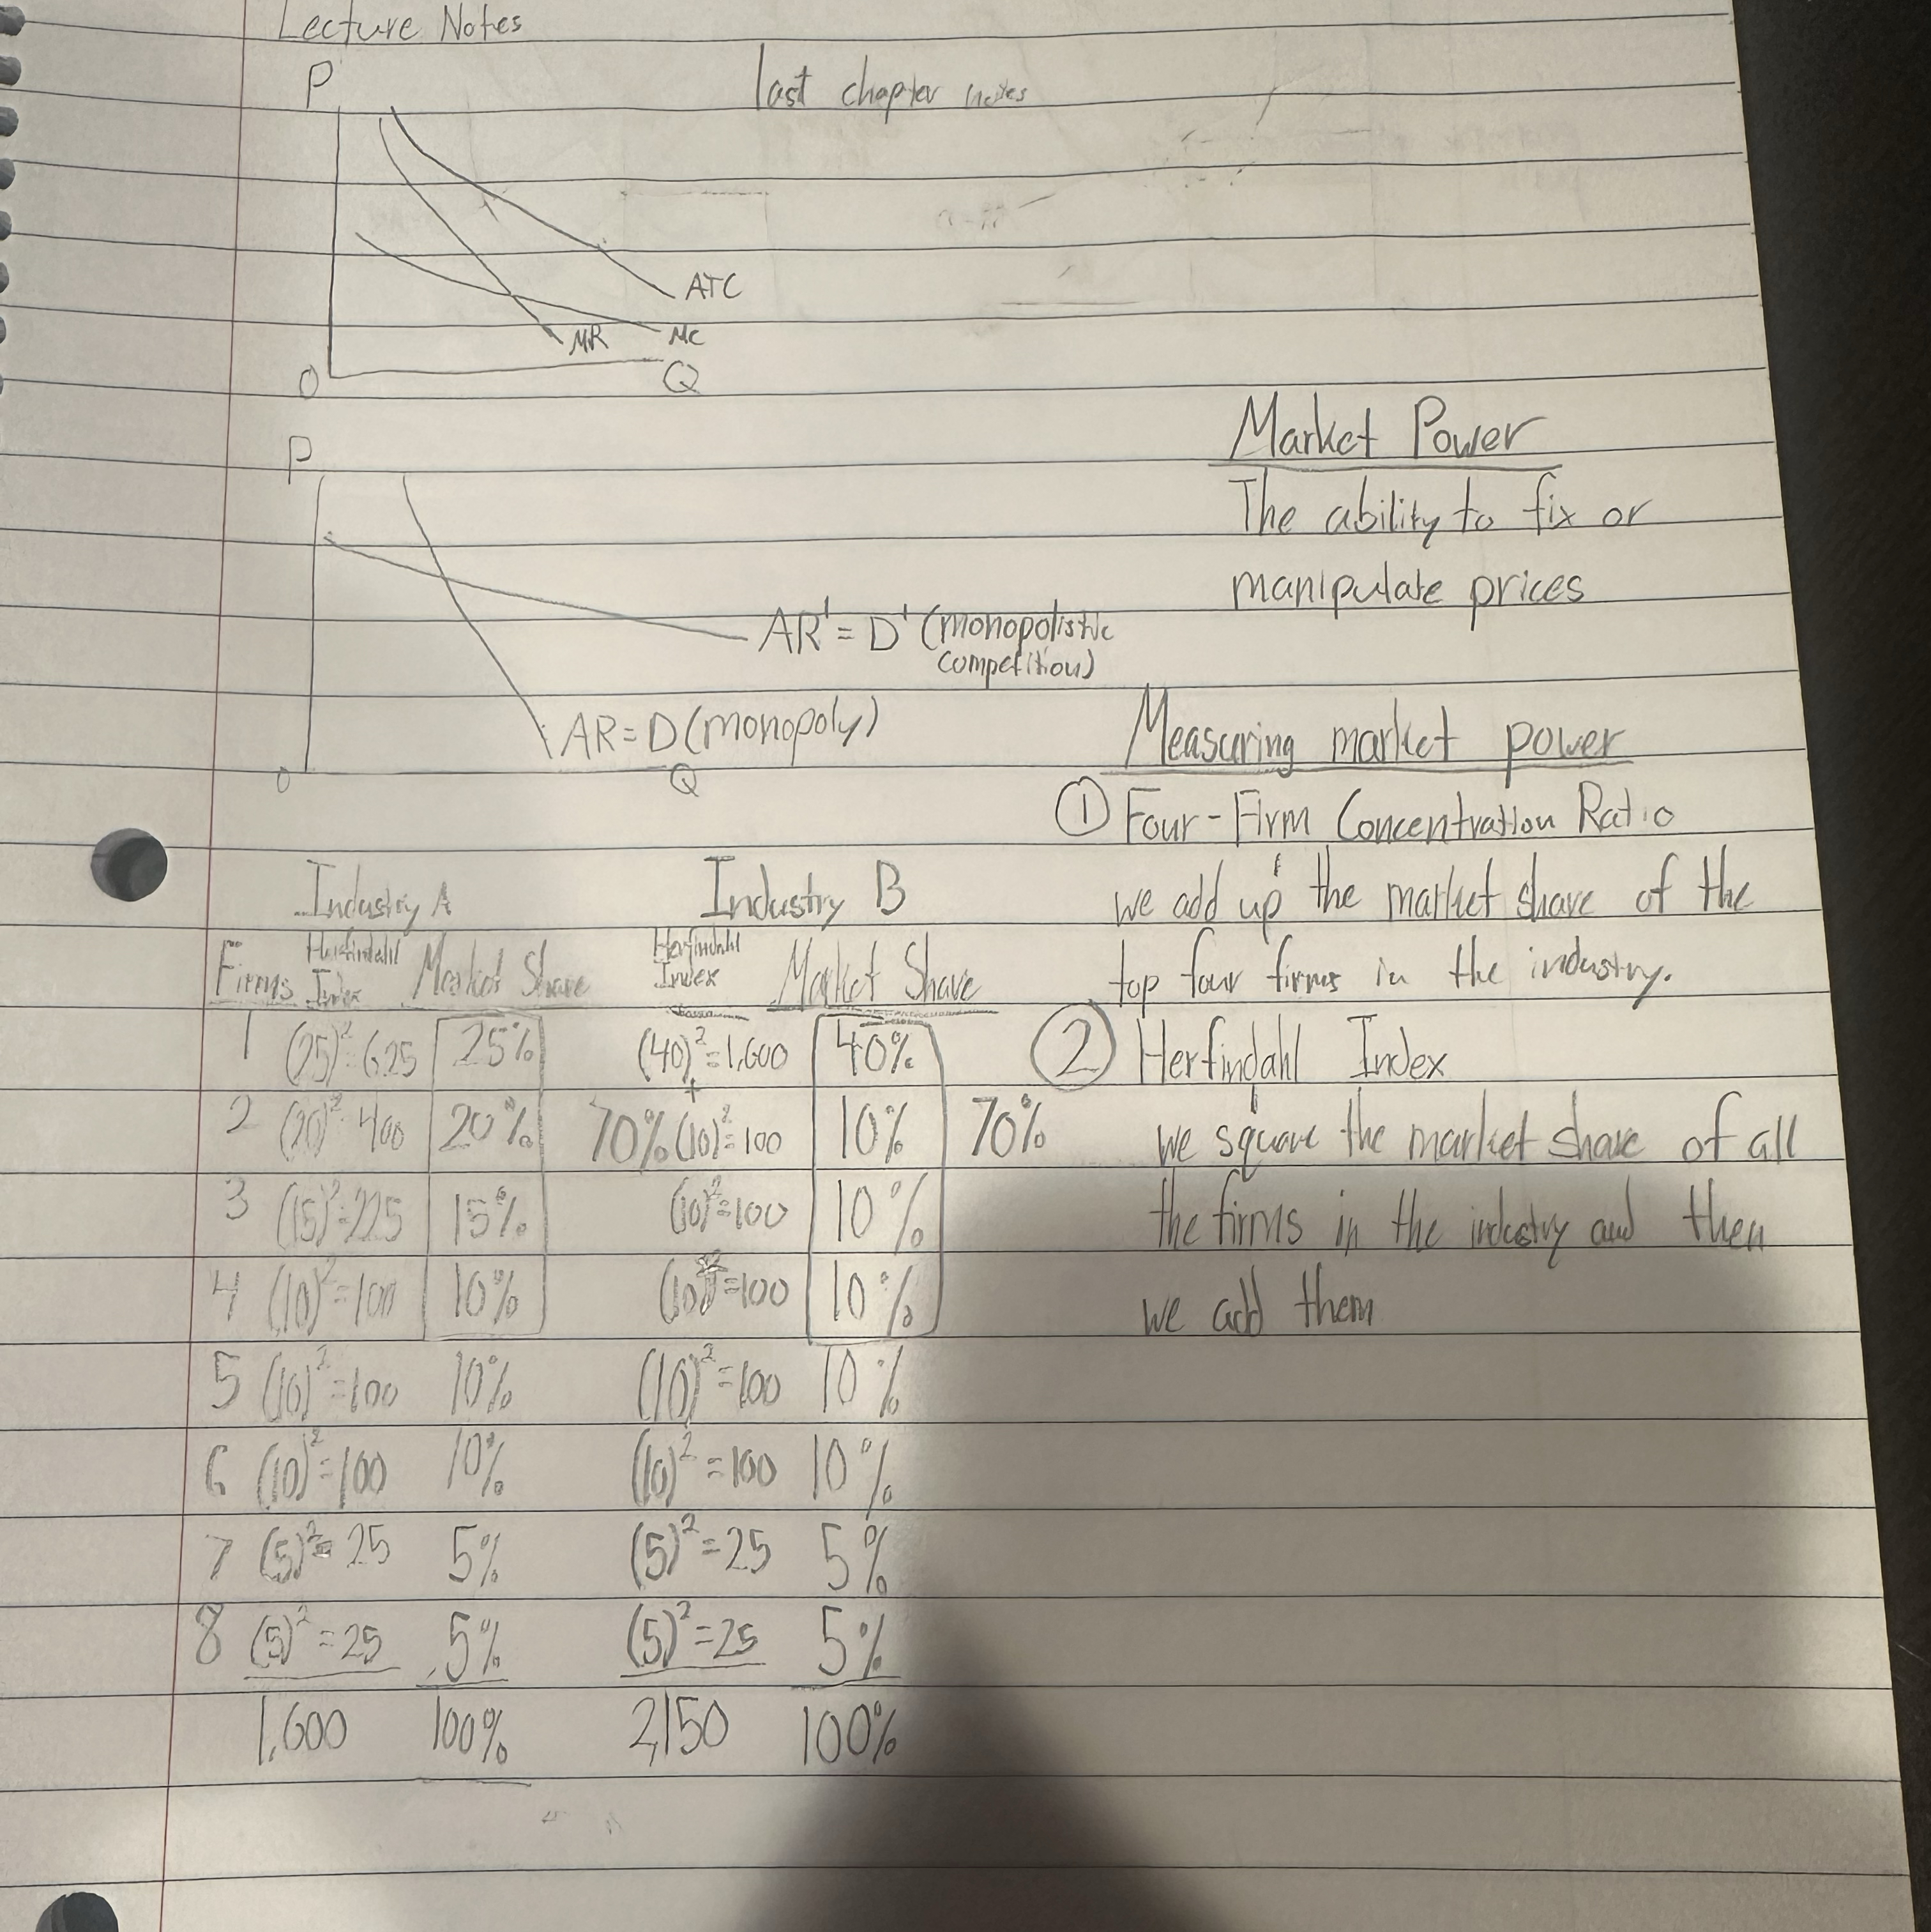
Industry Concentration Measures
4-Firm Concentration Ratio (CR):
This ratio measures the percentage of sales accounted for by the four largest firms in an industry. Basically add up the market share of the top four firms in the industry.
Formula: Output of Four Largest Firms / Total Output in the Industry .
Herfindahl Index (HI):
Measures market concentration by summing the squares of the market shares of all firms in the industry. Basically is the sum of squared market shares
Formula: HI = (%S1)2 + (%S2)2 + (%S3)2 + …. + (%Sn)2 HI={}\left(\%S1\right)
Examples of Low Concentration Industries
Jewelry: 32% - HI: 550
Plastic Bags: 28% - HI: 320
Women’s Dresses: 22% - HI: 236
Retail Bakeries: 5% - HI: 12
Price and Output in Monopolistic Competition
Demand for products is highly elastic.
Short-Run Profit or Loss:
Firms produce where MR = MC (Marginal Revenue equals Marginal Cost).
Long-Run Normal Profit:
Entry and exit lead firms to only earn normal profit in the long run.
Firm Behavior in Short Run
Short-Run Profits:
Firms can earn profits if P > ATC (Average Total Cost).
Example:
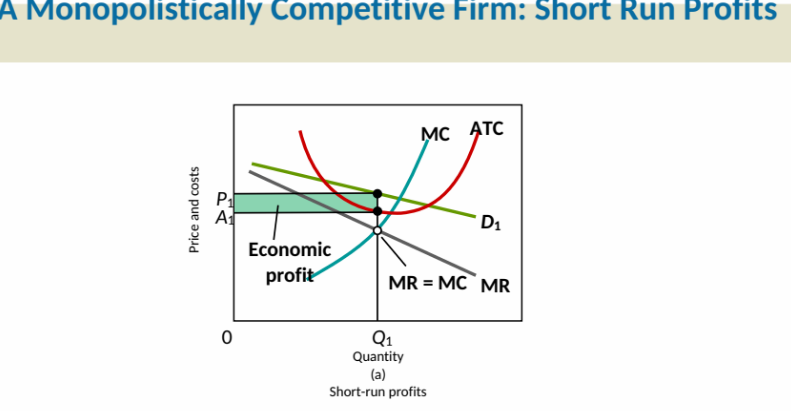
If Q1 is the output where P1 is the price, the firm can realize profits as shown in demand curve D1.
Short-Run Losses:
Firms incur losses if P < ATC.
Example:
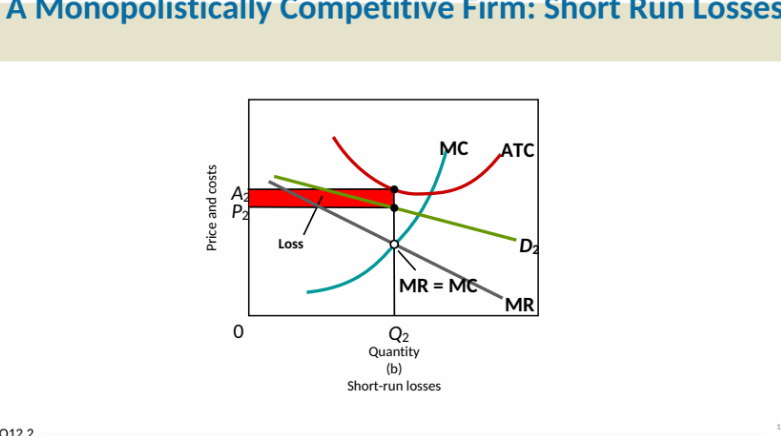
At output Q2 with price P2, losses may occur when price does not cover average total costs as displayed in demand curve D2.
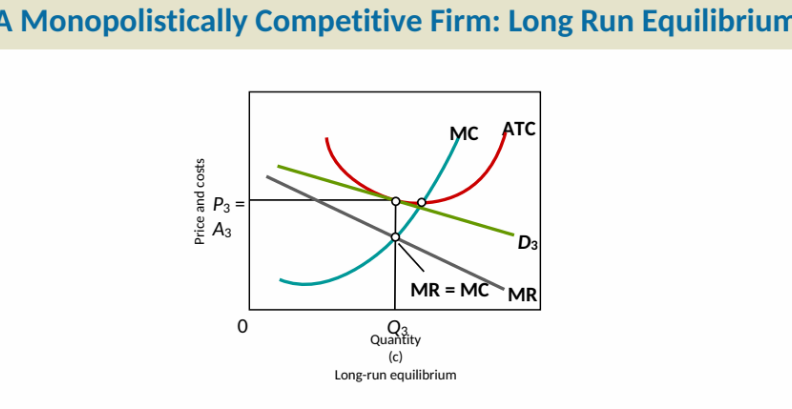
Long-Run Equilibrium
In long-run equilibrium, firms produce where:
P = ATC, creating zero economic profit.
Adjustments lead to price stabilization at P3 and output Q3 where MR = MC.
Example:
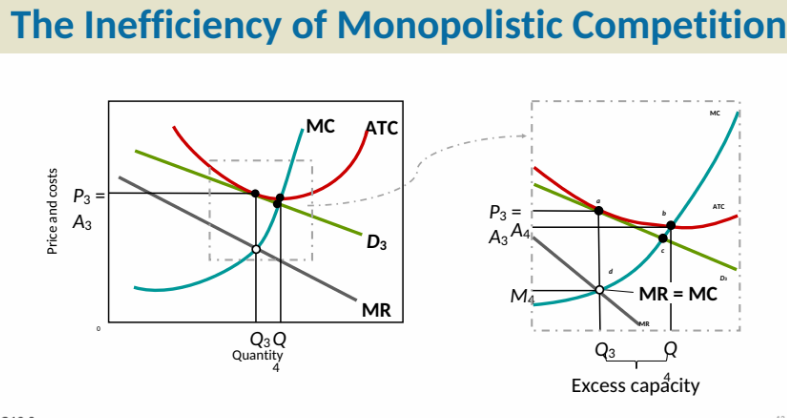
Inefficiency in Monopolistic Competition
Monopolistic competition is characterized by inefficiency due to:
Productive Inefficiency: The condition P > min ATC indicates that firms do not produce at the lowest cost.
Allocative Inefficiency: The condition P > MC signals that resources are not allocated efficiently in the economy.
This manifests as excess capacity in firms where production is below the optimal level.
Examples:
Product Variety Benefits
Monopolistically competitive firms enhance consumer welfare through:
Increased product variety and choice (types, styles, brands).
Better product differentiation and advertising strategies benefit consumers leading to higher quality products.
Economic Impact of Policies
Higher minimum wages affect different business types differently:
Large chains are often capital intensive and may absorb the cost well.
Small, labor-intensive shops, like mom-and-pop restaurants, may suffer significant financial strain leading to potential business closures.
Policymakers and the public must consider such implications of wage policies on small businesses.
4/7/25 LECTURE NOTES
Average Revenue and Marginal Revenue
Average revenue (AR) and marginal revenue (MR) are crucial metrics in understanding firm revenue during different phases of market competition.
For monopolies:
Average revenue is represented by a downward sloping demand curve, indicating that monopolies are price makers with market power.
A steep AR curve suggests that a small change in quantity sold can lead to a larger change in price.
Market Power
Market power refers to a firm's ability to influence the price of a good or service in the market.
We measure market power in different industries through various methods.
Measuring Market Power
Concentration Ratio:
The market share of the top four firms in an industry is summed to gauge market power.
Example: If the top four firms account for 70% of the market share, this indicates concentration but not the composition of power among them.
If one firm dominates this share significantly, it implies more market power than if the percentage were evenly distributed.
Herfindahl-Hirschman Index (HHI):
To accurately account for the market composition, the market shares of all firms in the industry are squared and summed.
HHI = ext{sum of (market share of each firm)}^2
A higher HHI implies higher market concentration and thus greater market power.
The government uses HHI to determine the competitive landscape and whether a market is approaching monopoly status.
If the HHI exceeds 2,500 after acquisitions or mergers, regulatory actions may be taken.
Monopolistic Competition vs. Monopoly
The graphical representation for monopolistic competition is similar to that of monopolistic markets but the slope of AR is flatter.
Pricing Decisions:
Firms maximize profit where marginal cost (MC) equals marginal revenue (MR).
Average price is determined by the average revenue curve.
Profit and Loss Analysis
Monopolistic competition does not guarantee profits; firms can incur losses as well.
Average profit is shown graphically along with the interaction of different curves such as MC and average total cost (ATC).
LECTURE NOTES 4/9/25
Measuring Market Power
Methods to Measure Market Power:
Herfindahl-Hirschman Index (HHI): A measure of market concentration calculated by squaring the market shares of all firms in the industry and adding them up.
Market Share of Top Firms: Another way to assess market power, often focusing on the leading firms in the industry.
Profit Maximization in Monopolistic Competition
Characteristics of Monopolistically Competitive Firms:
Firms maximize profits by determining output and price levels.
Graph analysis: Understanding output levels that maximize profit (e.g., where marginal cost (MC) equals marginal revenue (MR)).
Differences with Monopoly:
Unlike monopolies, monopolistically competitive firms face competition, leading to different profit dynamics in the short and long run.
Profit and Loss Dynamics:
In the short run, firms can earn profits or incur losses similar to pure competition.
**Long Run Adjustments: **
As firms earn profits, new firms enter the market, increasing supply, which lowers prices.
Conversely, losses lead to exiting firms, reducing supply and raising prices.
Shifts in Supply and Price
Graph Interpretation: Listening for average revenue (AR) curve dynamics -- in monopolistic competition, as supply increases, price decreases, influencing average revenue.
Short Run Effects: When profits exist, the average revenue shifts, decreasing due to increased supply.
Long Run Equilibrium: Price eventually becomes equal to average total cost (ATC) at zero economic profit, where AR is tangent to ATC.
Comparing Prices and Outputs
Price and Output Comparison:
Monopolistic competition generally results in higher prices and lower outputs compared to pure competition.
Price tends to be higher in monopolistic structures as firms can exercise some market power.
Efficiency: Neither pure competition nor monopolistic competition achieves productive efficiency due to excess capacity.
Characteristics of Monopolistic Competition:
Excess Capacity: Firms operate below their minimum average cost level due to the competition among many sellers.
Firms do not produce at the minimum average cost due to market structure limitations.
Economic and Productive Efficiency
Key Distinction:
Pure competition achieves zero economic profit where price equals minimum average cost in the long run.
Monopolistic competition can sustain positive profits due to brand differentiation and lack of perfect substitutes.
Consumer and Producer Behavior:
Consumers maximize satisfaction where price equals marginal utility.
Producers aim for profit maximization at output level where MR equals MC.
Inefficiencies: Marginal utility often exceeds marginal cost in monopolistic competition, suggesting that resources are not allocated efficiently, leading to consumer benefits that do not translate to increased producibility.
LECTURE NOTES 4/11/25
Economic Predictions and Trends
Understanding the current economic landscape is essential for anticipating future developments.
Key metrics, such as a computation focused on contributions, indicate areas of concern in economic performance (e.g. not maximizing output).
Excess capacity refers to the situation where firms do not operate at full efficiency, leading to potential economic inefficiencies.
Monopolistic vs. Pure Competition
Monopolistic Competition: Firms compete in a market where they sell products that are differentiated from one another.
Understanding if monopolistic competition has advantages over pure competition is crucial for analyzing market dynamics.
Product Differentiation: Essential in monopolistic competition as it allows firms to capture niche markets and consumer preferences.
Advertising and Market Behavior
Advertising is characterized as a non-price method of competition, aimed at shifting demand curves and increasing market share by appealing to consumers.
This strategy can lead to more steeply inclining demand curves, indicating a higher consumer willingness to pay as perceived value increases.
Compensation and Wage Dynamics
Employee compensation is a significant portion of economic activity, contributing over two-thirds to the incoming economy.
Many businesses enter wage contracts which can influence operational costs and market behavior.
Menu Costs
Menu Costs: Represents costs incurred by a firm when changing prices (e.g., printing new menus). This concept is often highlighted in restaurant economics but is applicable across various industries.
Firms may avoid frequent price changes to reduce these costs, which can impact pricing strategies and consumer behavior.
Market Share and Pricing Strategies
Understanding how market share affects profits is crucial. For example, a firm can achieve a 75% market share by offering competitive pricing.
Price reductions can lead to increased demand, but firms must evaluate the impact on their customer retention and employee satisfaction.
Employee Retention and Market Dynamics
Lowering wages could result in a loss of skilled employees since good employees have options and may leave for better opportunities.
Inefficiencies linked to high turnover can lead to increased hiring costs and operational disruptions.
Conclusion
Understanding these economic concepts helps in grasping the bigger picture of market behaviors and firm strategies. Focus on monopolistic competition, wage dynamics, and impacts of advertising are particularly relevant in today's economic environment.
HANDWRITTEN LECTURE NOTES CHAPTER 12
Monopolistic Competition - “Mix of pure and monopolistic (monopoly) competition”
Characteristics
Large number of sellers
Free entry and exit or no barriers to entry
Differentiated products
Price makers
Advertising
Ways to differentiate products
Product attributes and features
Locations
Service - before and after sale
Brand names
Packaging
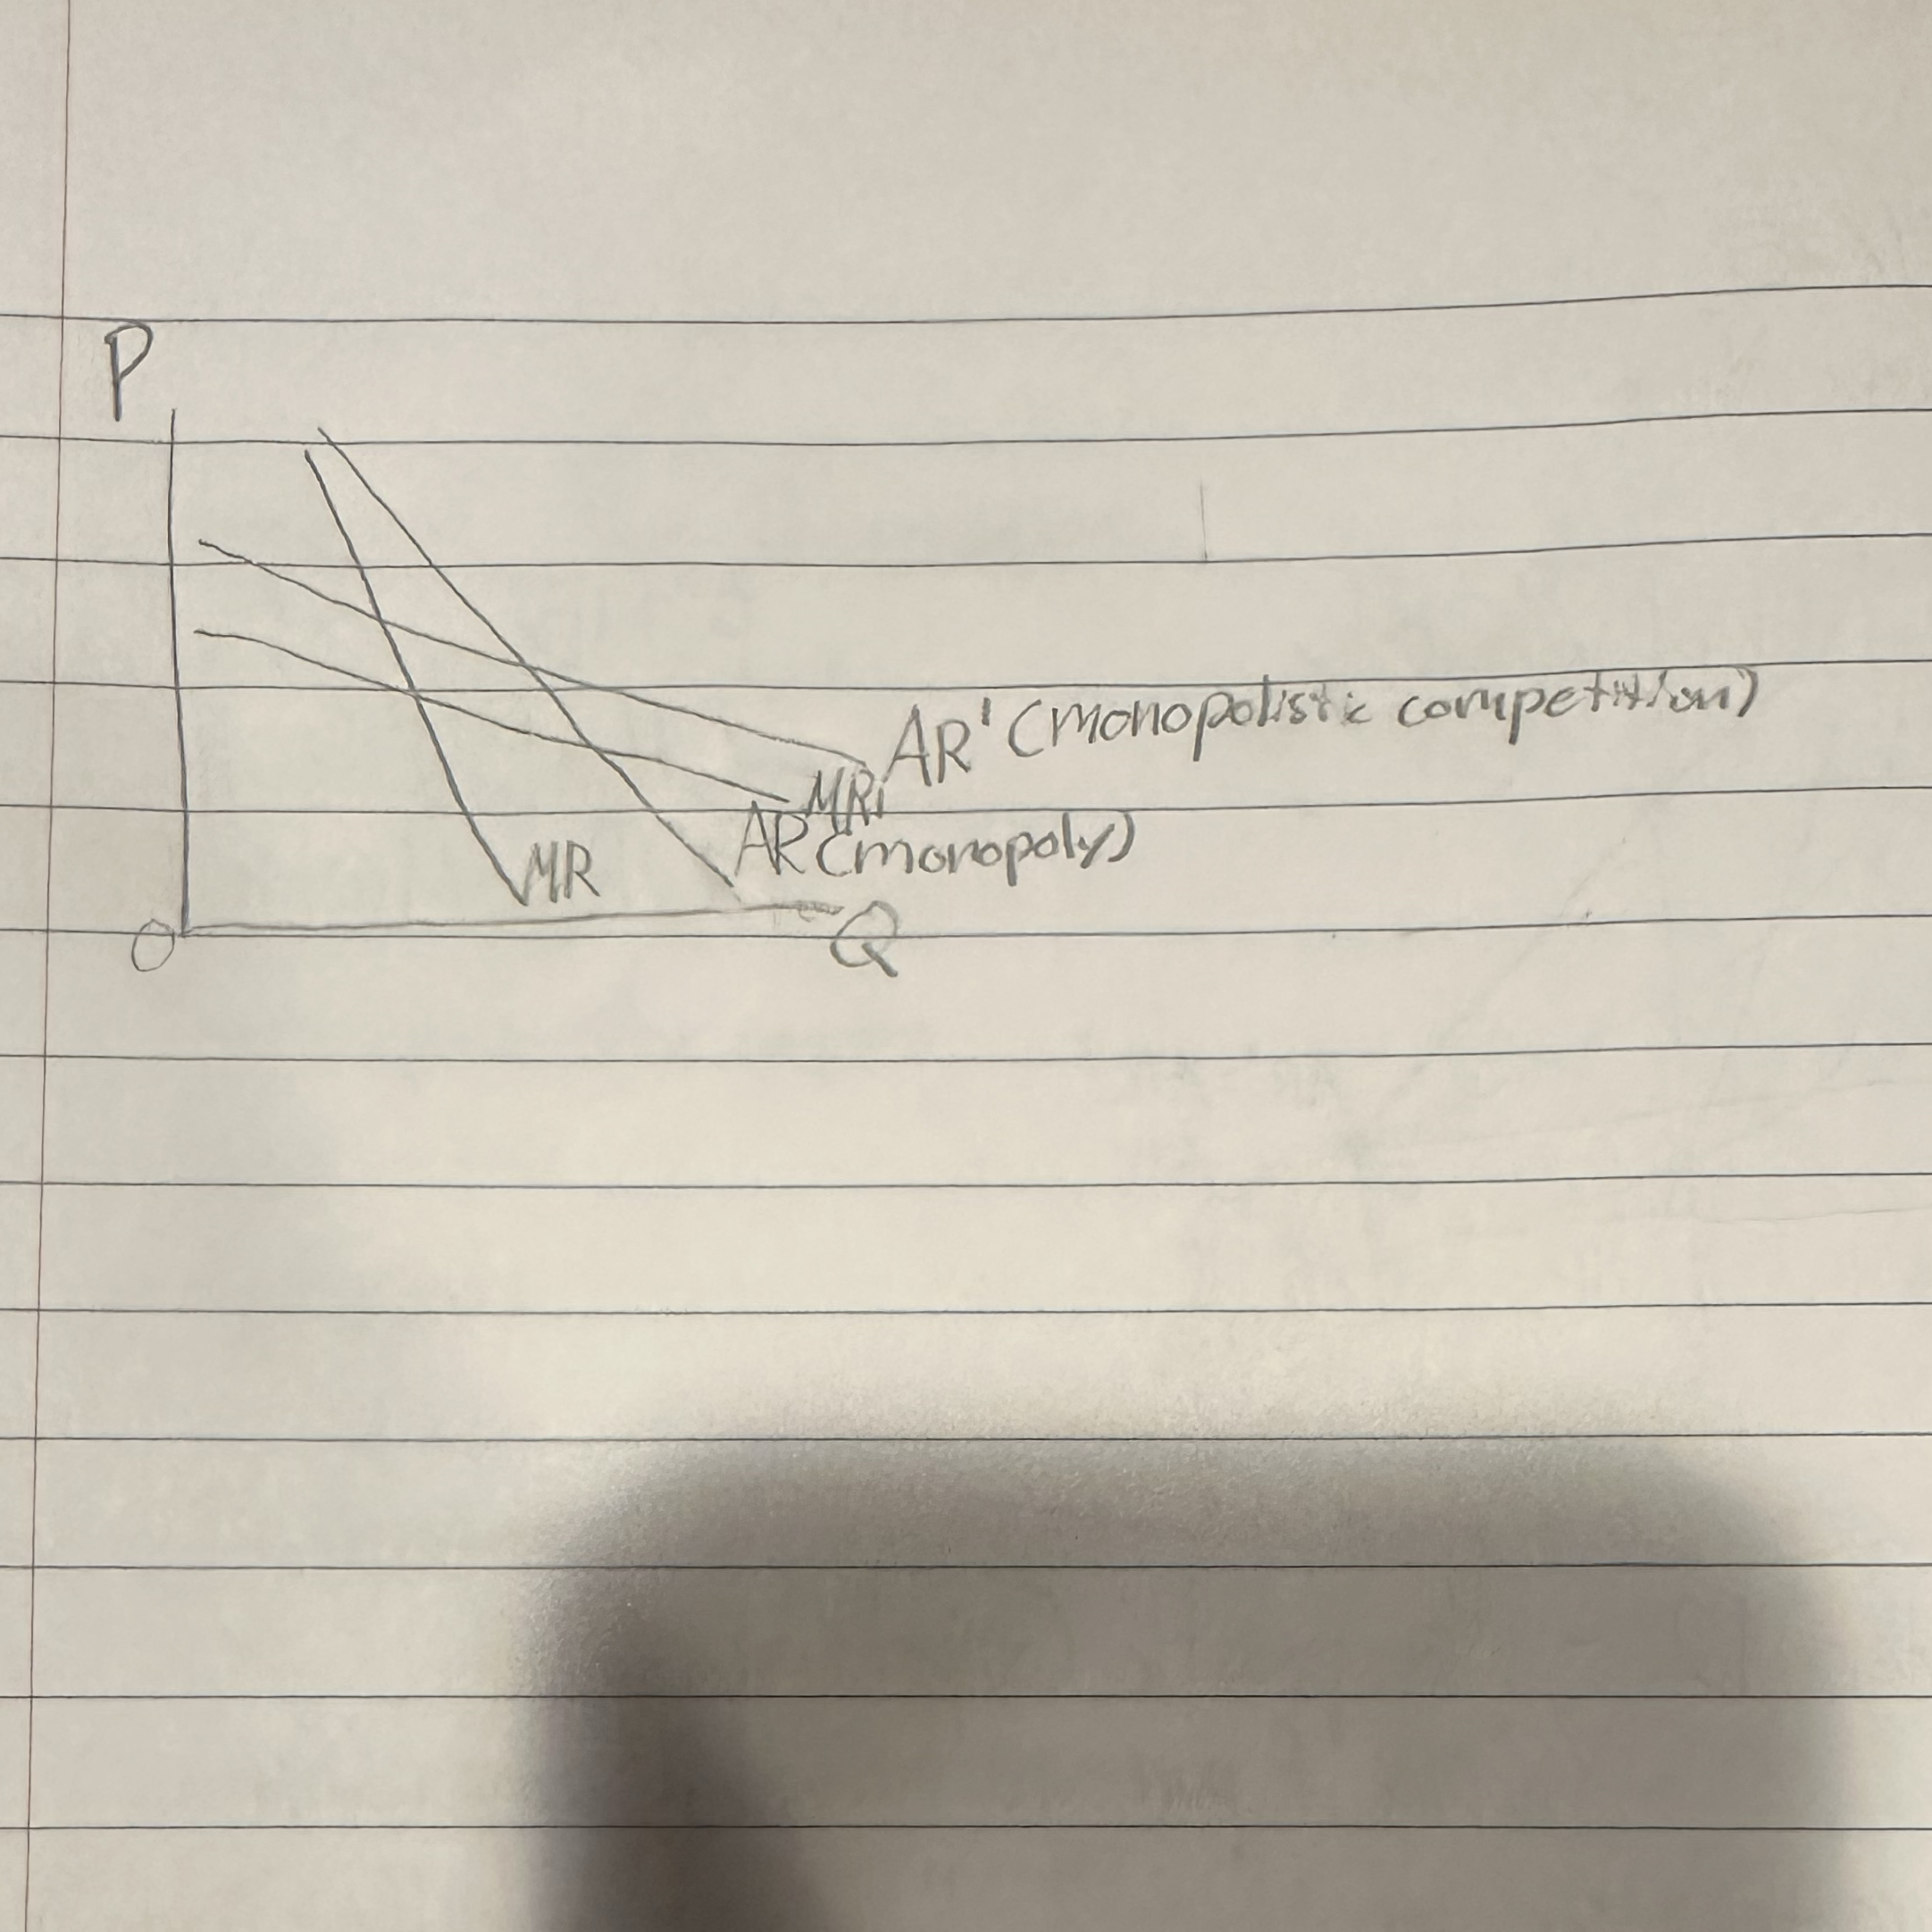
Average Revenue (AR) and Marginal Revenue (MR) Comparison
The graph illustrates the relationship between average revenue and marginal revenue for both monopolistic competition and monopoly.
In monopolistic competition, the average revenue (AR) curve is relatively flat, indicating that firms have some pricing power but are still influenced by competition.
The marginal revenue (MR) curve for monopolistic competition lies below the AR curve, showing that to sell more, firms must reduce the price.
In contrast, the monopoly's average revenue curve is steeper, reflecting a stronger ability to influence prices. The marginal revenue curve for monopolies is also below its AR curve but drops faster than that of monopolistic competition, indicating greater pricing power.
This difference highlights how firms in monopolistic competition have more competitive pressures affecting their pricing strategies compared to monopolies, which can set higher prices without losing customers.
Example of AR and MR Comparison
Market Power - The ability to manipulate prices
Measuring Market Power
Four-Firm Concentration Ratio - We add up the market share of the top four firms in the industry
Herfindahl Index - We square the market share of all the firms in the industry and add them all together
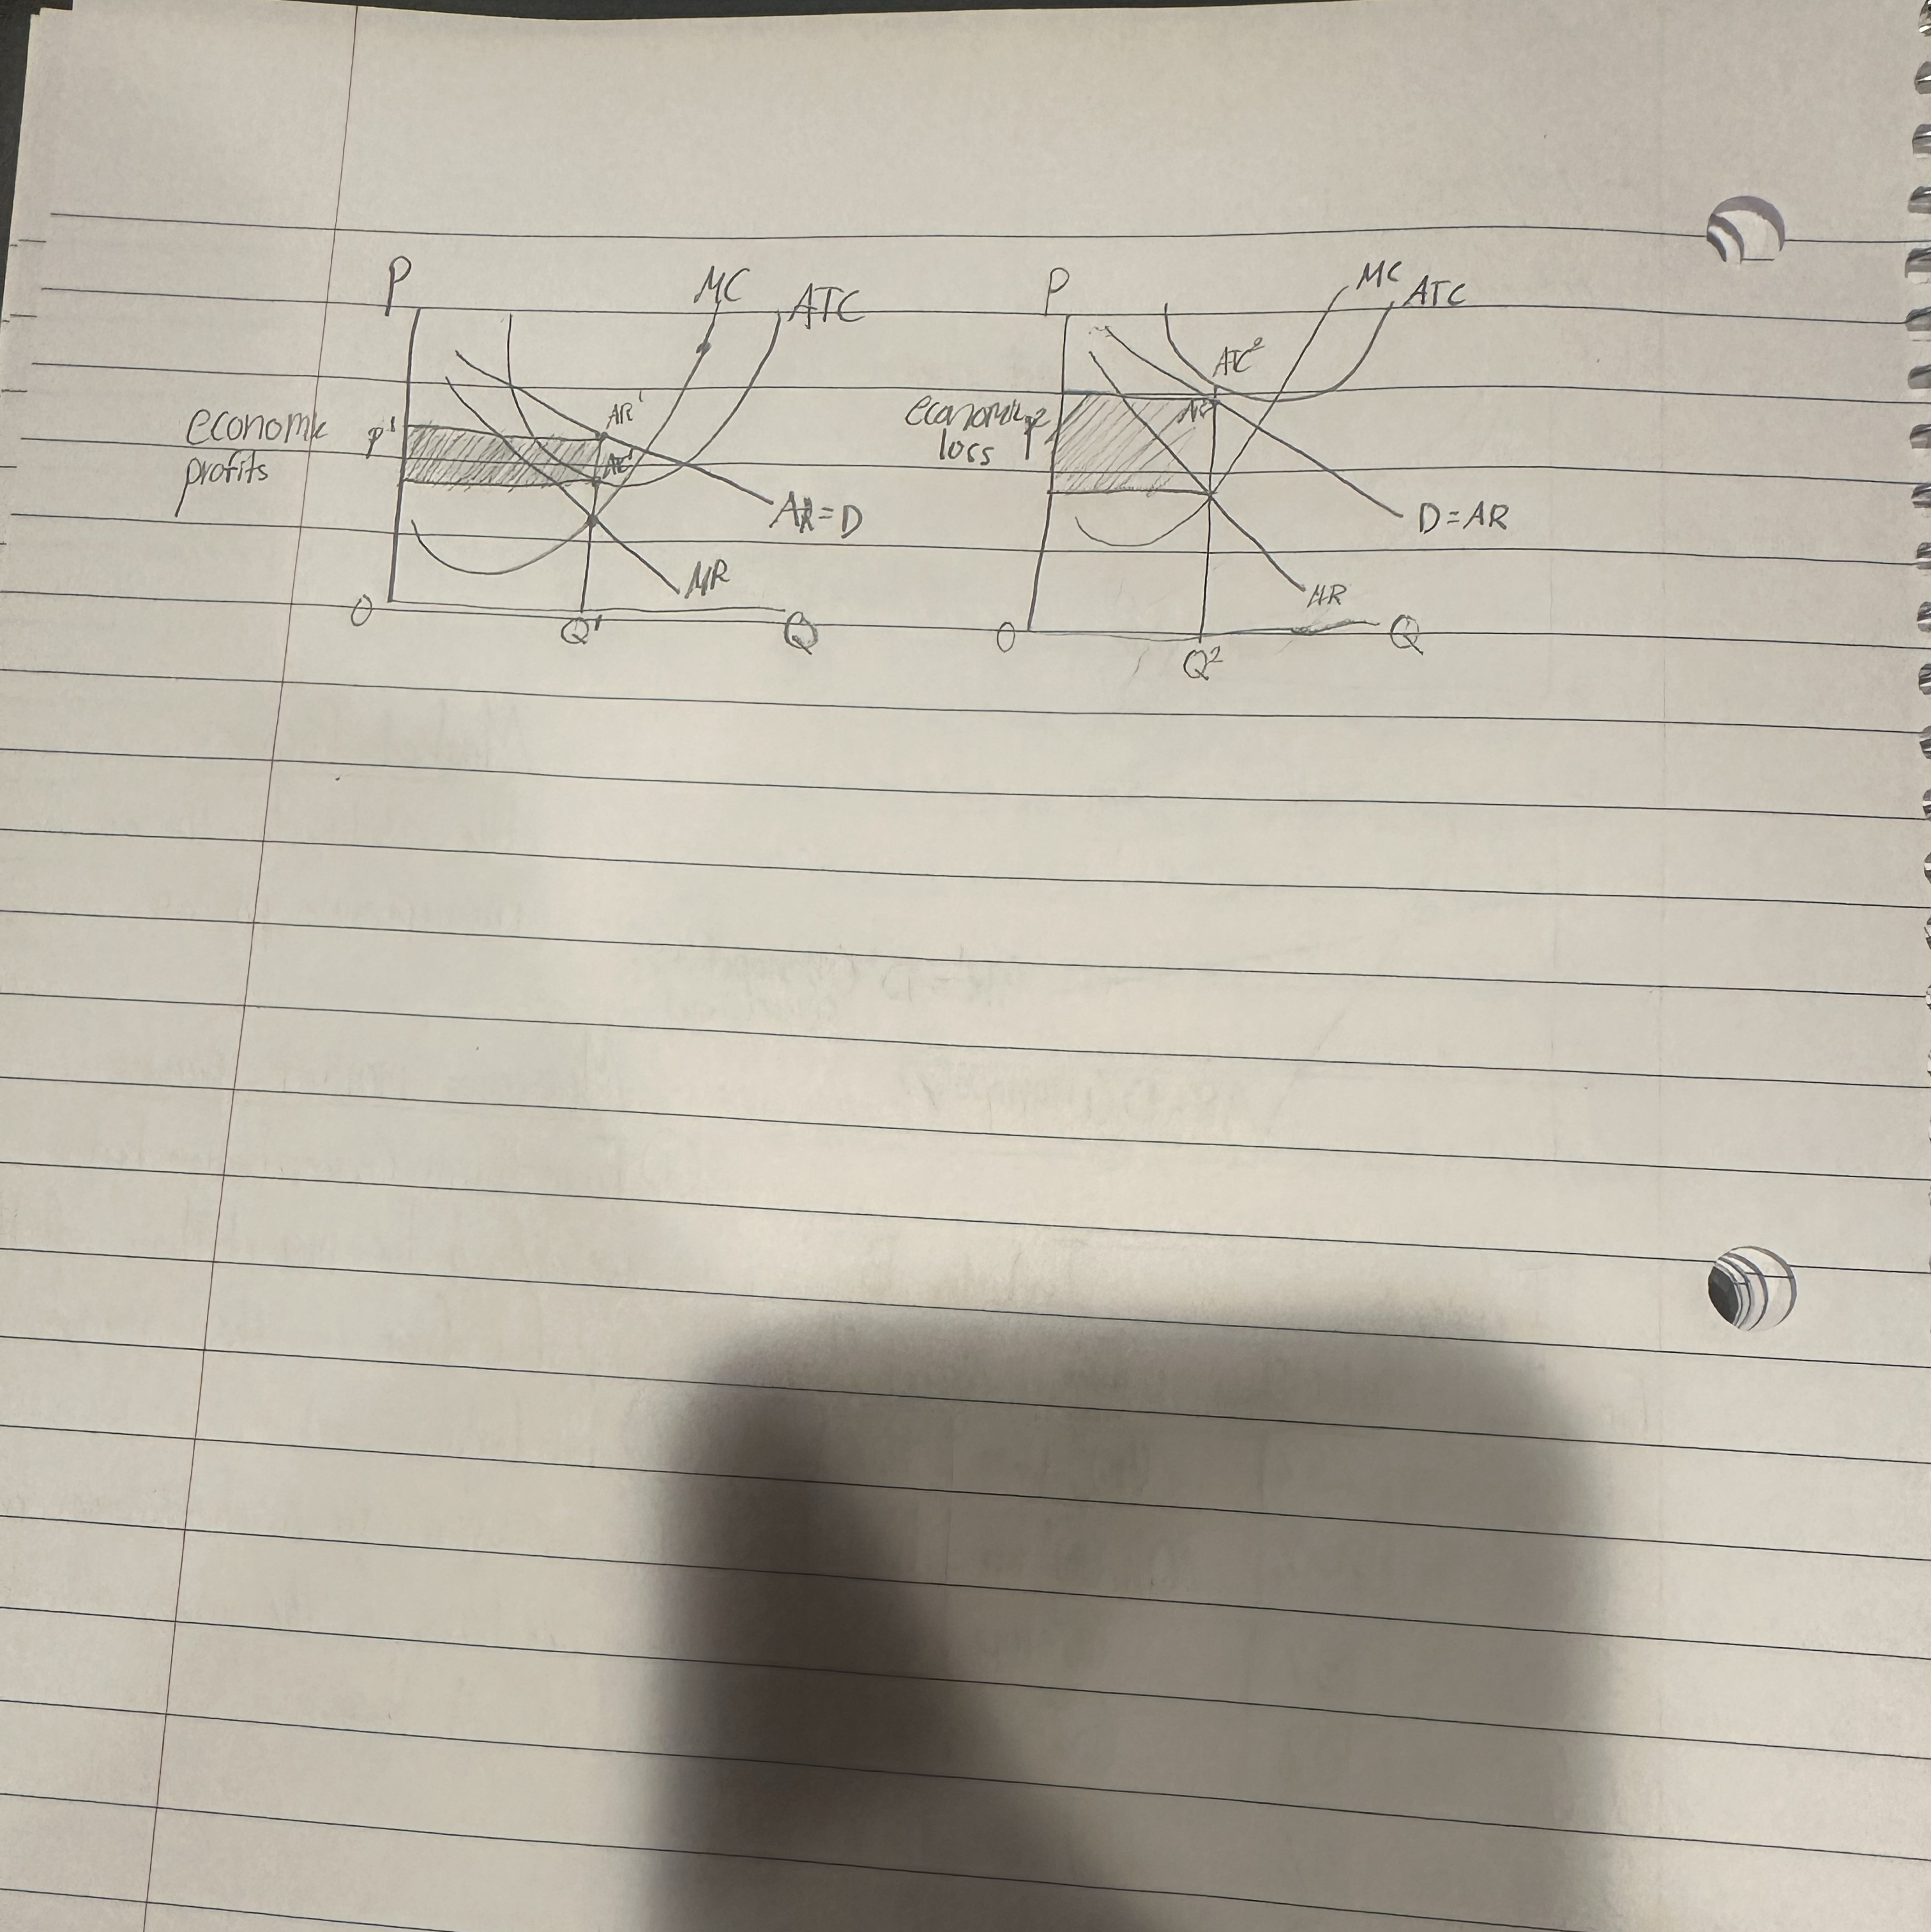
Here's the graph showing economic profit. It illustrates the relationships between price (P), average revenue (AR), marginal cost (MC), average total cost (ATC), and demand (D=AR), along with the quantity produced (Q'). The shaded area indicates where the firm experiences an economic profit.
Here's the graph showing economic loss. It illustrates the relationships between price, average revenue (AR), marginal cost (MC), average total cost (ATC), and demand (D=AR), along with the quantity produced. The shaded area indicates where the firm experiences an economic loss.
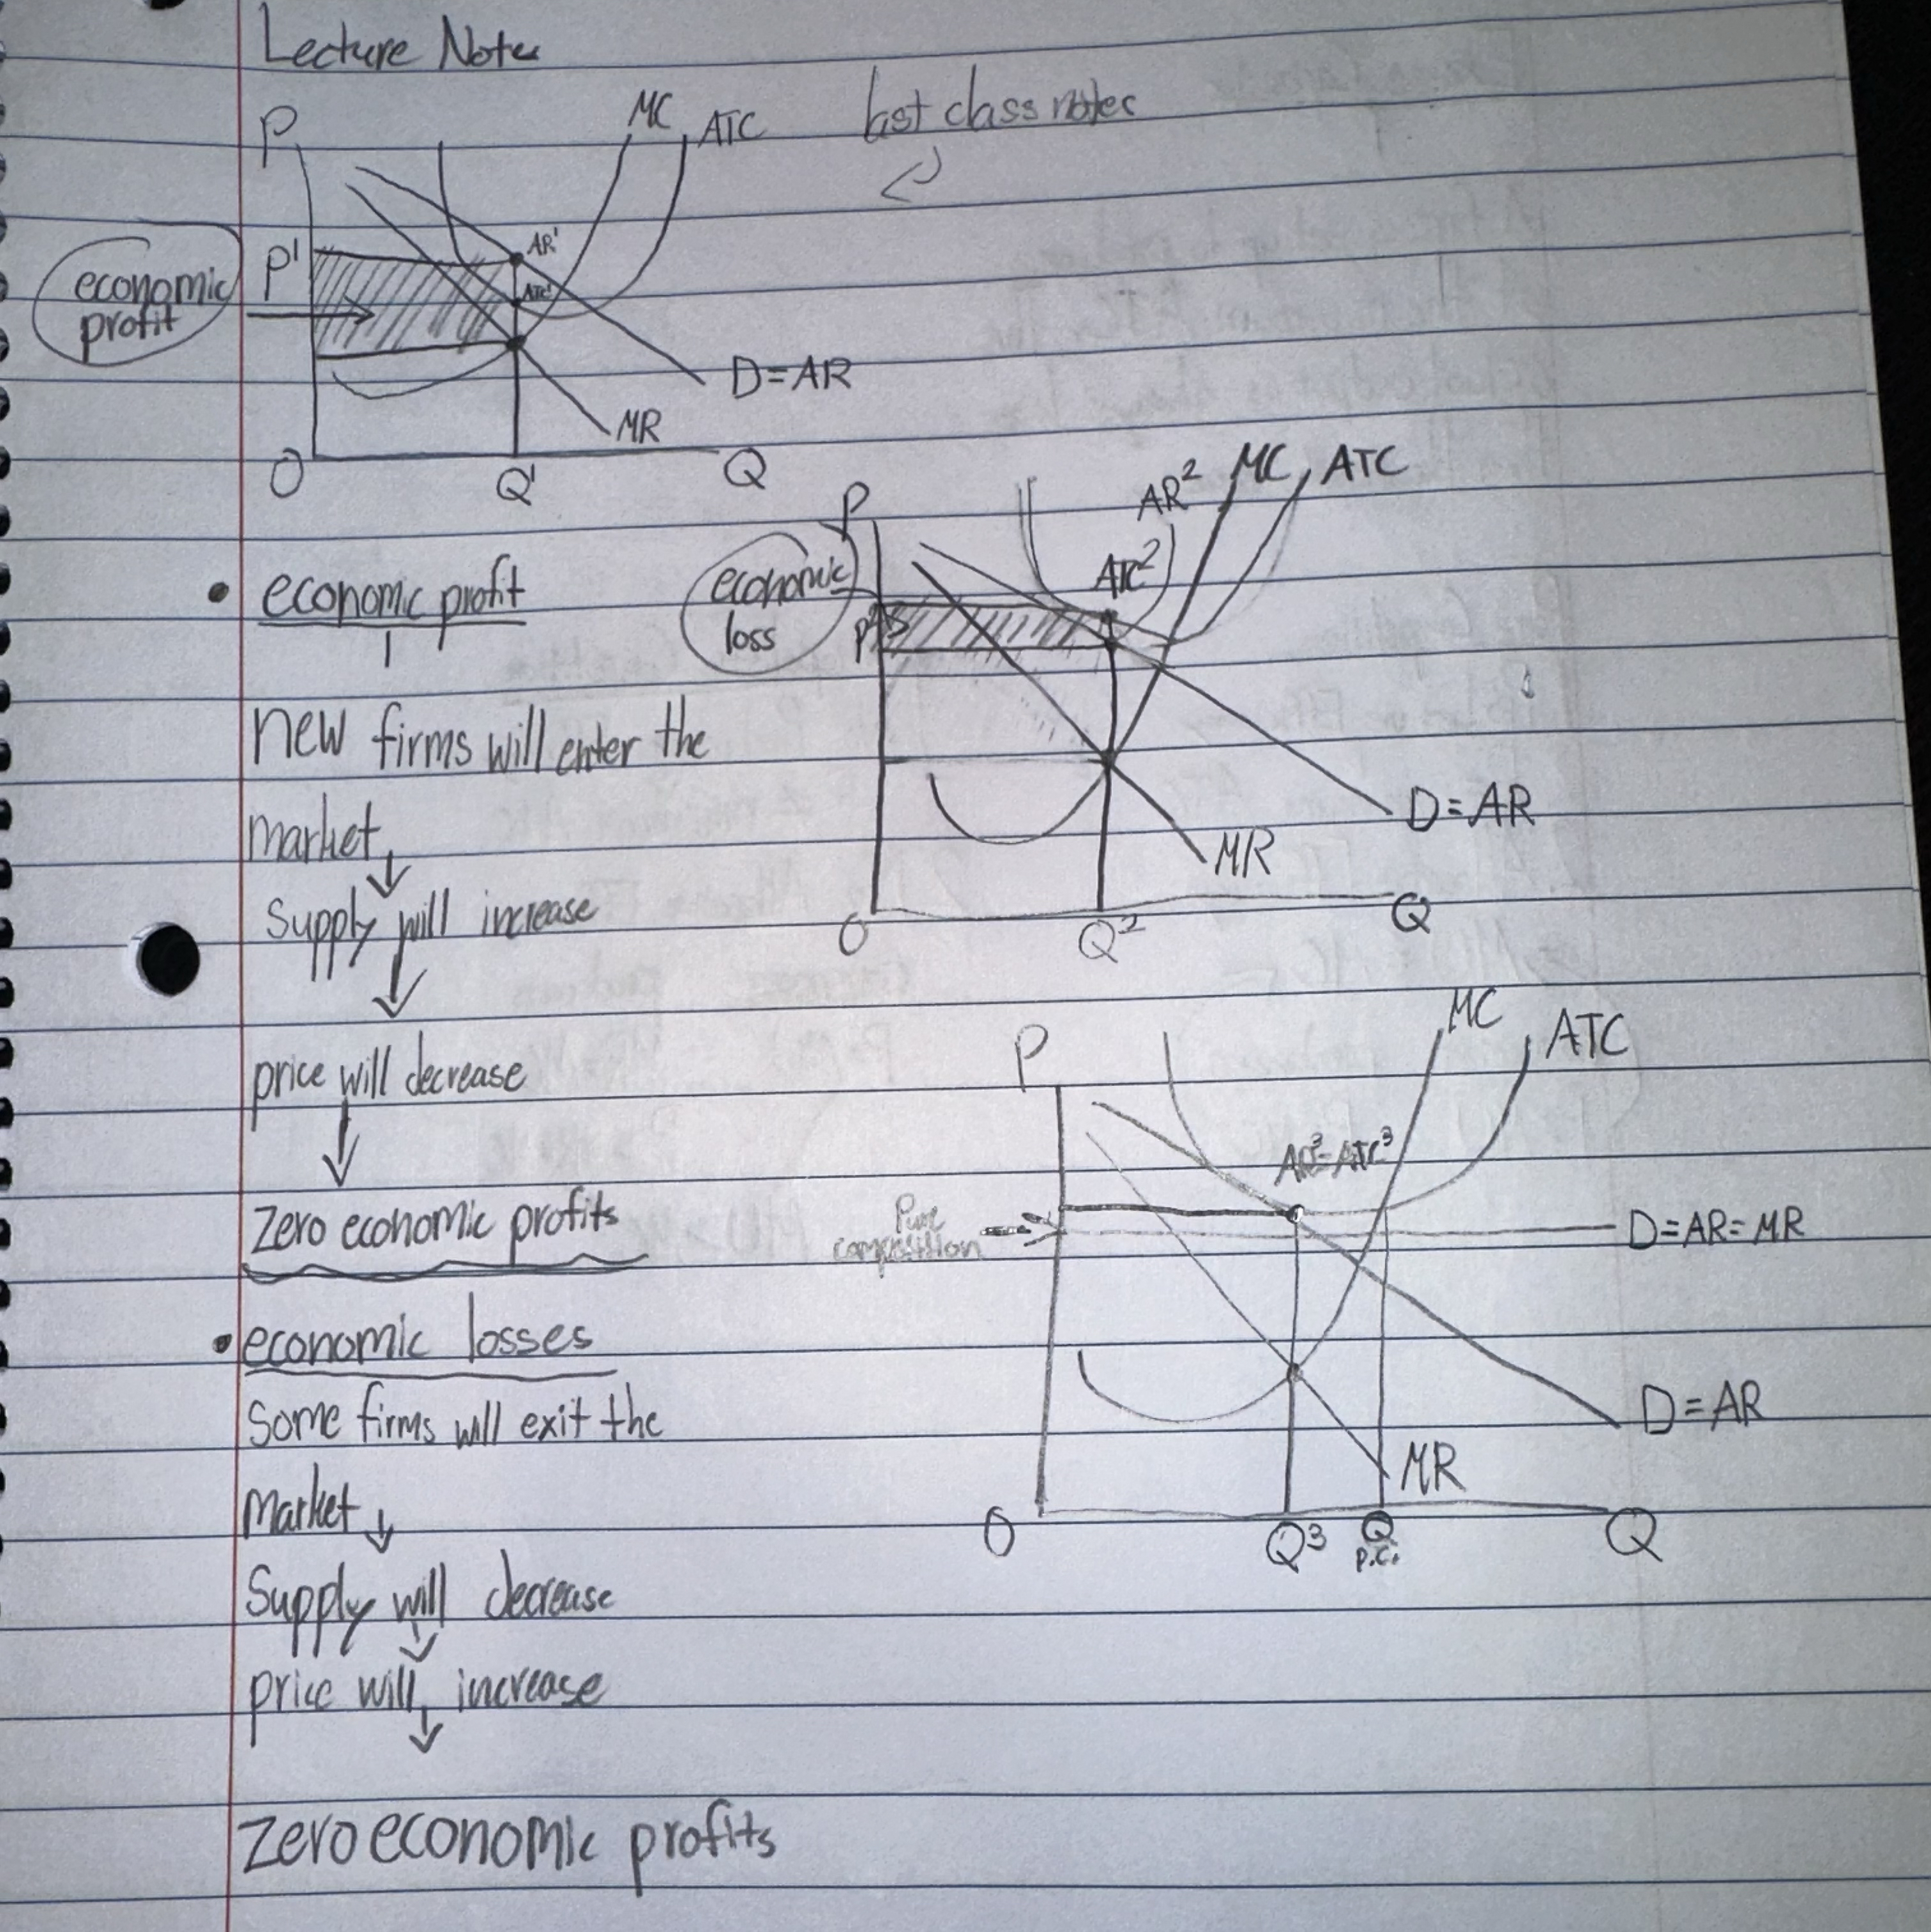
Economic profits/losses
Economic Profit
New firms will enter the market
Supply will increase
Price will decrease
Zero economic profits
Economic Losses
Some firms will exit the market
Supply will decrease
Price will increase
Zero economic profits

Excess Capacity
A firm is set up to produce at the minimum ATC. The actual output is always output is always less than the installed capacity
Pure Competition
Productive Efficiency: P = minimum ATC
Allocative Efficiency: MU = MC
Consumers - P = MU
Producers - P = MC
Monopolistic Competition
No Productive Efficiency: P not = minimum ATC
No Allocative Efficiency: M > MC
Consumers - P = MU
Producers - MR = MC - P > MR = MC
Pure Competition - Similar Product (Disadvantage), which gives no incentive to advertise.
Monopolistic Competition - Product Variety (Advantage), which gives incentive to advertise, to shift the AR or D curve to the right and make it steep - Nonprice way of competition.
Why prices are inflexible downward
Wage contracts
Minimum wages
Menu costs
Avoid price wars
Efficiency wages - wages that are above the market wage rate
Hiring and training costs
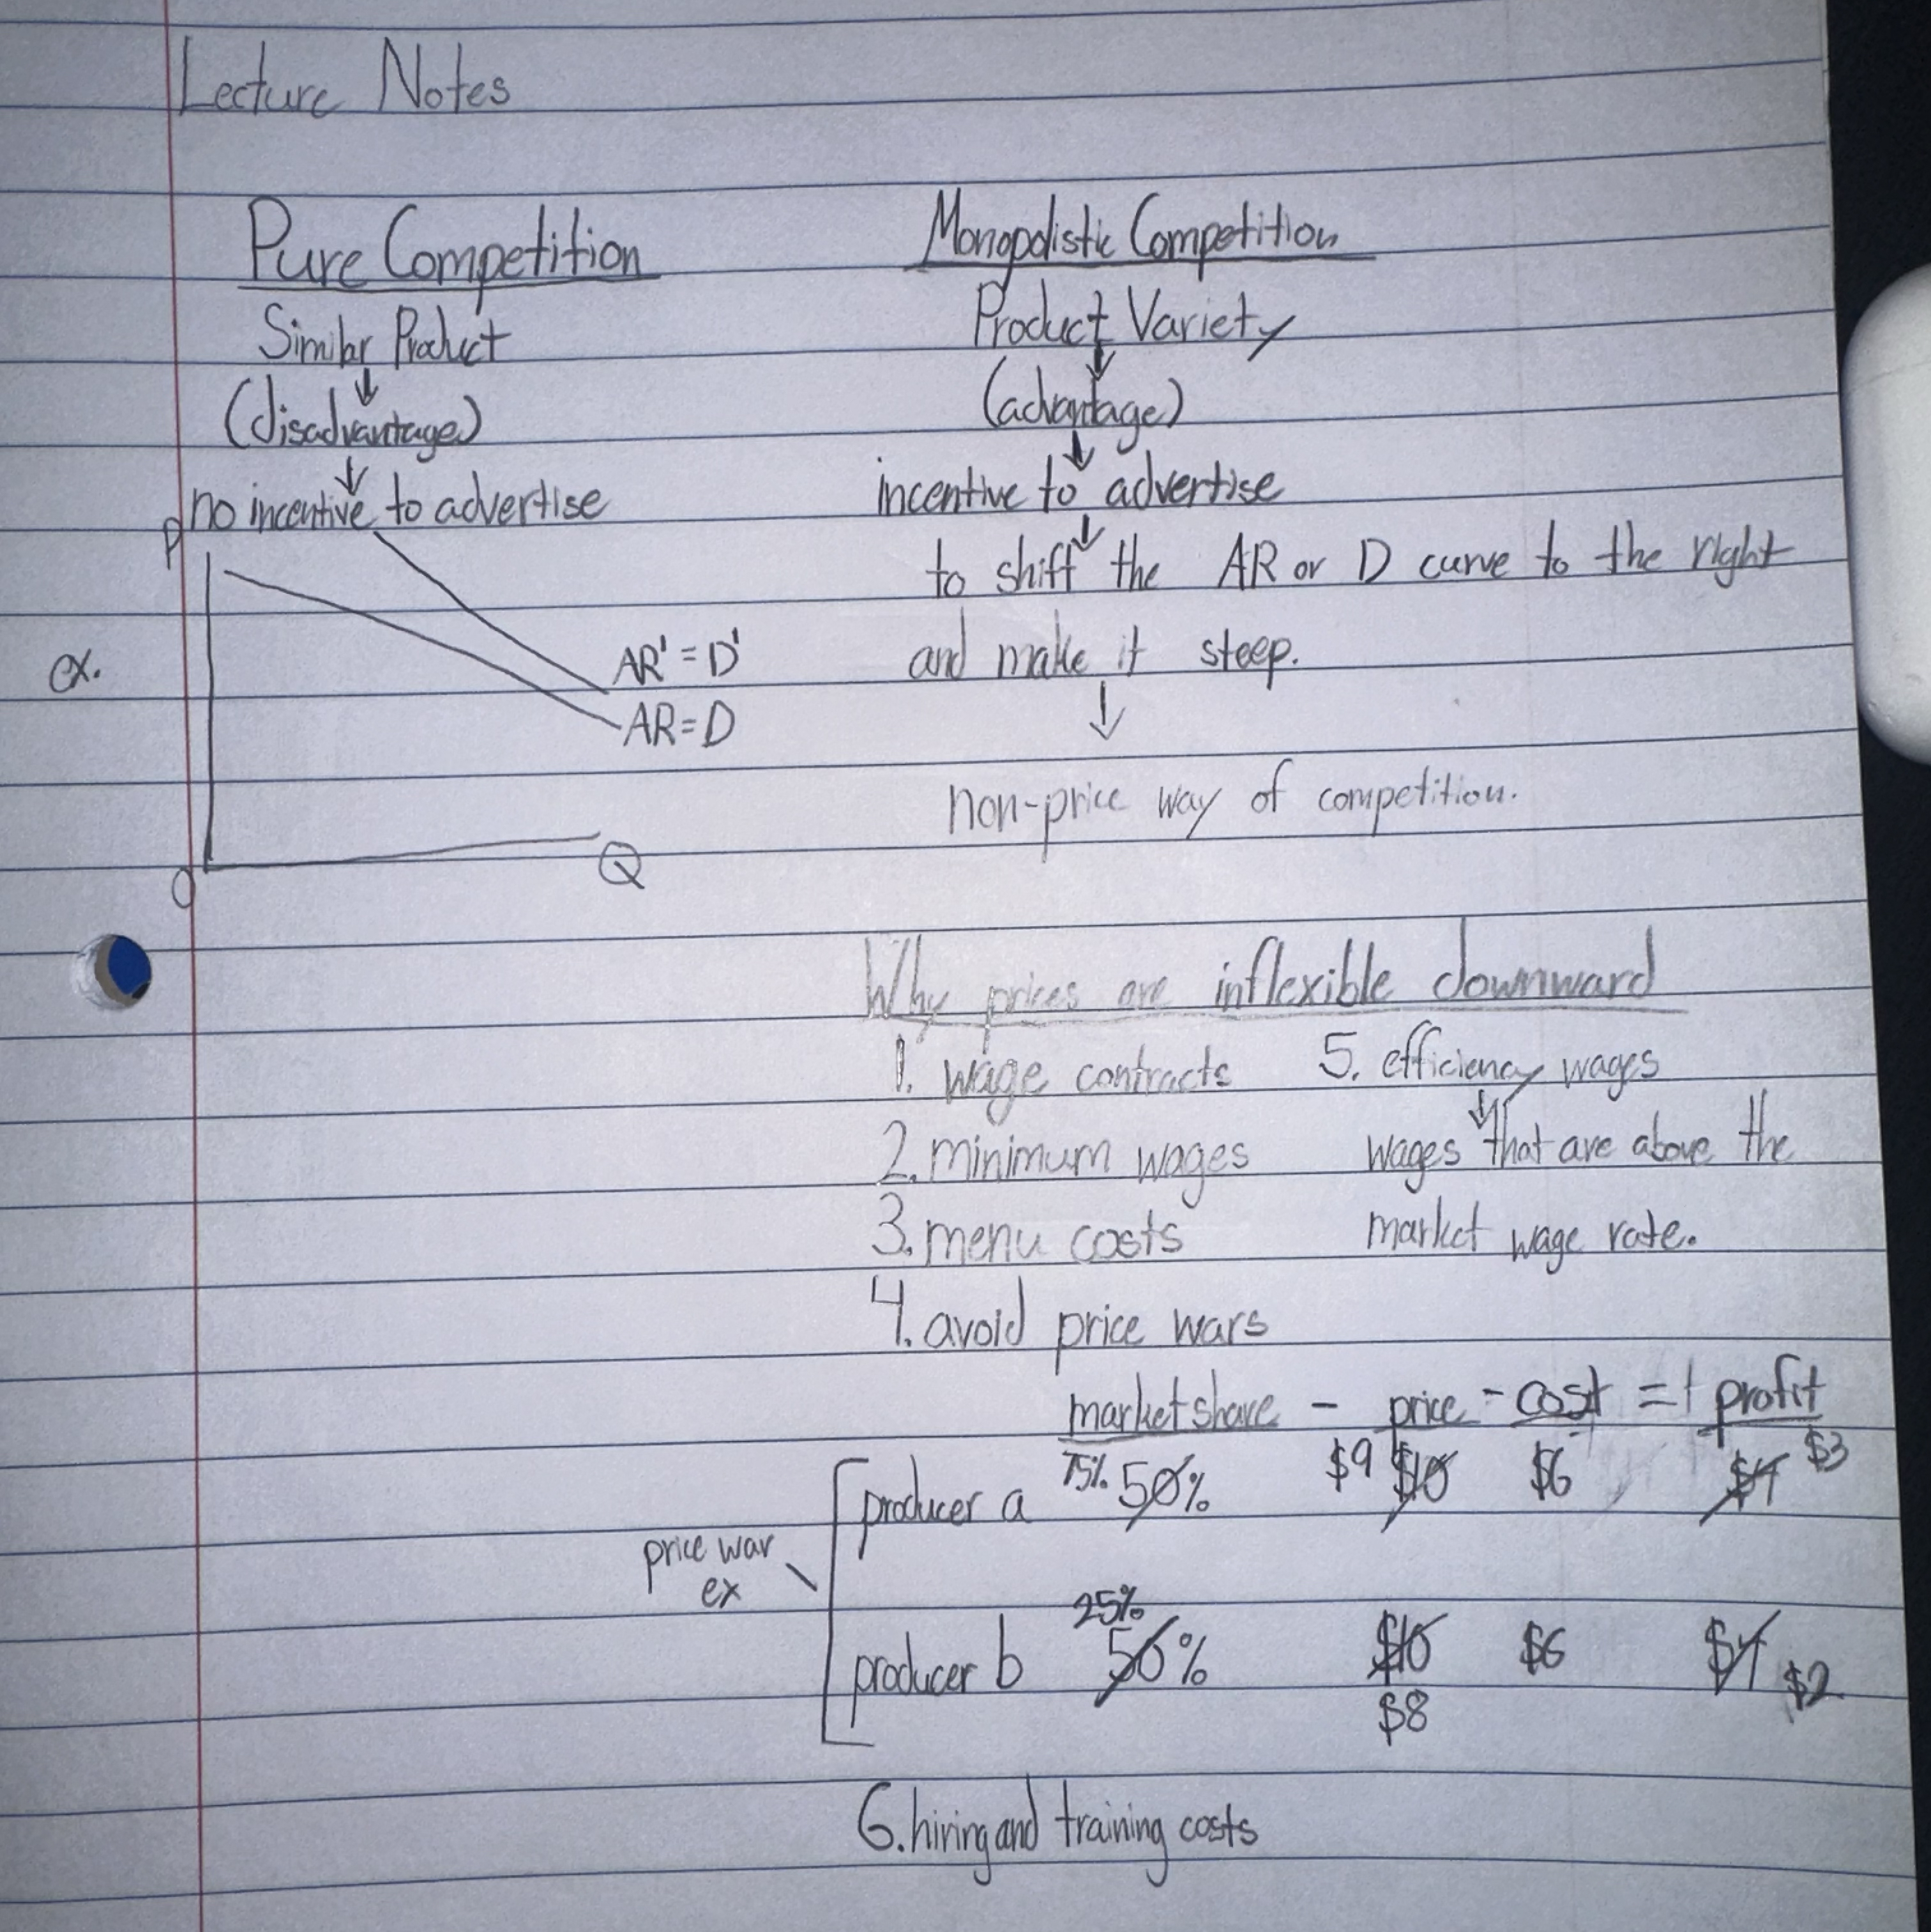
This example illustrates a scenario of a price war between two producers, A and B, each holding a 50% market share. The key components are as follows:
Producer A:
Price: $9
Cost: $6
Profit Calculation: Profit is calculated as Price - Cost, which would be $9 - $6 = $3.
Producer B:
Price: $10
Cost: $6
Profit Calculation: Profit is calculated as $10 - $6 = $4.
In a price war, these producers may lower their prices to attract more customers, leading to changes in their profits. For instance:
If both cut their prices to compete, Producer A’s price drops to $8, while Producer B maintains a price of $10. This would result in:
Producer A: Profit would be calculated as $8 (new price) - $6 (cost) = $2,
Producer B: Profit would remain at $4 if they keep their price at $10.
Such price reductions can lead to decreased profits for both producers, and the consequences of these actions can impact market dynamics significantly. The desire to gain or maintain market share motivates these price adjustments, but lead to complications such as decreased overall profitability in the industry, indicative of the heightened competition in monopolistic markets
Analysis of Monopolistic Competition and Market Power
Based on the lecture notes provided, I'll synthesize the key concepts about monopolistic competition, market power, and related economic principles.
Monopolistic Competition Characteristics
Monopolistic competition is a market structure that combines elements of both monopoly and perfect competition:
Demand and Revenue Curves:
AR (Average Revenue) curve is downward sloping (AR = D)
MR (Marginal Revenue) lies below AR
Firms have some market power to set prices
Efficiency Outcomes:
No productive efficiency (P ≠ minimum ATC)
No allocative efficiency (MU > MC)
Excess capacity exists (actual output < installed capacity)
Comparison with Pure Competition:
Pure competition achieves productive efficiency (P = minimum ATC)
Pure competition achieves allocative efficiency (P = MC = MU)
Monopolistic competition offers product variety as an advantage
Market Power Measurement
Market power refers to a firm's ability to influence prices. Two key measures are:
Four-Firm Concentration Ratio:
Sum of market shares of the top four firms in an industry
Example shown: Industry A (00%:625, 00%:146, 65%:225, 100%:101) vs Industry B (25%, 20%, 15%, 10%)
Herfindahl-Hirschman Index (HHI):
Sum of squared market shares of all firms in the industry
More comprehensive than four-firm ratio
Non-Price Competition
Firms in monopolistic competition often engage in non-price competition:
Advertising to shift AR/D curve right or make it steeper
Product differentiation strategies
Avoiding price wars to maintain profits
Price Rigidity Factors
Several factors contribute to downward price inflexibility:
Wage contracts and minimum wages
Menu costs (costs of changing prices)
Efficiency wages (paying above-market wages)
Desire to avoid price wars
Hiring and training costs
The notes provide examples of market share, price, and cost relationships that affect pricing decisions.
Key Takeaways
Monopolistic competition offers product variety but results in inefficiencies compared to perfect competition. Firms in this market structure have some pricing power, which they maintain through product differentiation and non-price competition. Market concentration measures help assess the degree of competition in an industry, while various real-world factors contribute to price stickiness in these markets.
Lecture Notes: Economic Profit and Loss in Perfect Competition
1. Economic Profit
Diagram Features:
Price (P) is above Average Total Cost (ATC)
Area between Price and ATC is labeled as "economic profit"
MC (Marginal Cost) = MR (Marginal Revenue) at profit-maximizing quantity Q
AR = D (Average Revenue = Demand)
Outcome:
New firms will enter the market
⬇ Supply will increase
⬇ Price will decrease
➡ Zero economic profits in the long run
2. Economic Loss
Diagram Features:
Price (P) is below ATC
Area between ATC and Price is labeled as "economic loss"
MC = MR at quantity Q²
AR = D; MR is downward sloping
Two average revenue curves (AR and AR²) shown
Outcome:
Some firms will exit the market
⬇ Supply will decrease
⬆ Price will increase
➡ Zero economic profits in the long run
3. Long-Run Equilibrium (Perfect Competition)
Diagram Features:
Price = Minimum ATC
AR = MR = D
Firms earn zero economic profits
No incentive for entry or exit