Quiz Revision
Past quiz answers:
Quiz 1 - Assumptions, Power, and Effect
1) Your CEO has just read a book on criticisms of the NHST and worries that all company data analysis is now flawed and will lead to huge financial losses. How might you reassure her?
NHST does have its flaws but if we incorporate an examination of effect sizes into our analysis, we should be able to trust our research outputs.
2) You lead a product-testing unit for a large pharmaceutical company. Your team has conducted forty trials of a new antibiotic but you are not sure if the results are conclusive enough to urge the company to start producing the new drug. A new data analyst has joined your team suggesting that meta-analysis might be a good idea, do you agree?
Yes, because the forty trials were identical and tested the same research question and therefore we can calculate an average effect size for the new drug.
3) What is the purpose of pre-registration in scientific research?
To publicly document the research plan, including hypotheses and analysis methods, before data collection begins.
4) A trainee data analyst for a large social media company, which has falling site usage, has just completed a study into factors that affect site users’ satisfaction levels. However, he finds only one statistically significant factor, which he includes in his report but he deliberately, omits the other six non-significant findings. What is the term for what the data analyst has done?
p-hacking
5) Your CEO wants you to measure effect sizes. You report a Pearson’s r of 0.50 for the impact of Unblock Me Now drain cleaner on reducing drain blockage time. Your CEO wants to know if this is bad, as she remembers that a p-value of 0.30 is not good. What do you tell her?
You tell her that effect size and p-values are not the same and that a Pearson’s r of 0.50 is a large effect, suggesting she should rollout the launch of Unblock Me Now.
6) What does the effect size in a statistical study measure?
The strength or magnitude of the relationship between variables.
7) Which of the following is true about a 95% confidence interval of the mean:
95 out of 100 confidence intervals will contain the population mean.
8) Assume a researcher found that the correlation between a test she had developed and exam performance was 0.5 in a study of 25 students. She had previously been informed that correlations under 0.30 are considered unacceptable. The 95% confidence interval was [0.131, 0.747]. Can you be confident that the true correlation is at least 0.30?
No you cannot, because the lower boundary of the confidence interval is 0.131, which is less than 0.30, and so the true correlation could be less than 0.30.
9) What does HARKing refer to in scientific research?
Formulating hypotheses after knowing the results and presenting them as if they were made beforehand.
10) If a study has low statistical power, what is the most likely consequence?
The study is less likely to detect a true effect.
11) In general, as the sample size (N) increases:
The confidence interval gets narrower.
12) The 99% confidence interval usually is:
Wider than the 95% confidence interval.
13) Confidence intervals:
Can be used instead of conventional statistics based on point estimates.
14) Which of the following factors increases the statistical power of a hypothesis test?
Increasing the sample size.
15) A researcher in a Human Resources Unit presented a recent study, which showed a statistical significance between length of staff lunch breaks and low productivity; how can she explain to her manager that this does not mean that the length of staff lunch breaks should be reduced?
A significant result does not mean that the effect is important.
16) What does a significant test statistic tell us?
That the test statistic is larger than we would expect if there were no effect in the population.
Quiz 2 - Simple regression
1) What is linear regression
It identifies significant predictors for a continuous outcome variable.
It models a linear relationship between two continuous variables.
It quantifies a relationship between two continuous variables.
2) The variable the regression model predicts - Outcome Variable
A representation of the regression model - Regression line
The difference between an actual outcome value and the value predicted by the model - Residual
Represents how much of the outcome the regression model explains - Coefficient of determination
3) What would be the Null hypothesis be for a linear regression model of Gestational Age (Independent variable) and Birth Weight (dependent variable)?
There is no linear relationship between Gestational Age and Birth weight
4) We have a regression equation where Y = 10X + 20, if X is 5.3 what is Y?
We start with Y = 10X +20, replace X with 5.3, so we get Y=10*5.3 + 20 which becomes Y = 53+20 and then Y=73.
5) A researcher wants to perform a simple linear regression to find out if the socio-economic status of a teacher can predict whether they work at a primary or a secondary school. Why can’t this be done?
Because the outcome variable is nominal not continuous
6) If the correlation coefficient output from linear regression is 0.64. How much of the variation of the Y axis variable is explained by the X axis variable?
The variation is given by r2, where r is the correlation coefficient. In this example r = .64 so r2 = 0.64 *0.64 = 0.41 = 41%. So, the X or independent variable explains 41% of the Y or dependent variable. In which case 59% of the variation is the Y variable is unexplained in this simple linear regression model.
7) It is important that the residuals are normally distributed when performing a regression analysis.
True
8) which are true of regression lines.
A regression line can be used to predict one variable from another
A regression line is created by minimizing the difference between the line and the data points
9) What does the following plot tell us about our regression model?
The assumption of constant variance for the regression model has not been violated.
10) The following formula represents a regression model which uses the number of days a student spent revising to predict their score on a Spanish test (%). y = 5x + 15. Please match the explanations with the figures in the boxes by dragging and dropping each one – note each figure may have more than one matching explanation.
The value of Y when X is 0 (intercept) → 15
Extra % scored on test with each day spent revising → 5
The number of days revision which the model predicts are necessary to score 100% → 17
The expected exam score if the student did not spend any days revising → 15
The gradient of the regression line → 5
11) A linear regression analysis of Birth Weight (grams) and Gestational Age (weeks) gave the following output.
Model | Beta Coefficient | 95%CI | p-value |
Gestational Age | 96.56 | 14.41 to 178.72 | 0.02 |
Constant | -230.34 | -3340.0 to 3180.30 | 0.39 |
Calculate the predicted birth weight of a baby born at 40 weeks gestational age.
3632
Quiz 3 - Multiple linear Regression
1) R2 is:
The proportion of variance in the outcome accounted for by the predictor variable or variables
2) A psychologist was interested in whether the amount of news people watch predicts how depressed they are. In this table, what does the value 3.030 represent?
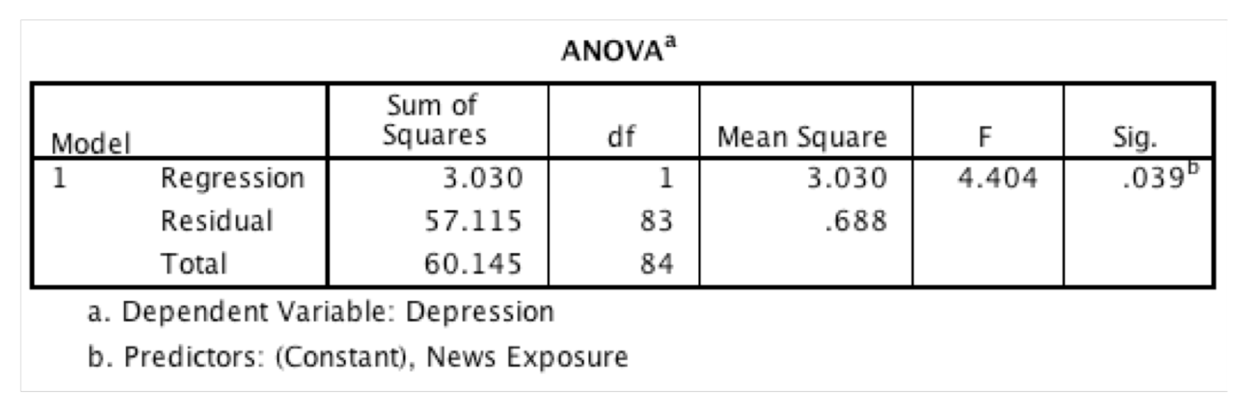
The improvement in the prediction of depression by fitting the model
3) A consumer researcher was interested in what factors influence people's fear responses to horror films. She measured gender and how much a person is prone to believe in things that are not real (fantasy proneness). Fear responses were measured too. In this table, what does the value 847.685 represent?
The total error in predicting fear scores when both gender and fantasy proneness are included as predictors in the model
4) Which of the following statements about the F-ratio is true?
The F-ratio is the ratio of variance explained by the model to the error in the model
5) A psychologist was interested in predicting how depressed people are from the amount of news they watch. Based on the output, do you think the psychologist will end up with a model that can be generalized beyond the sample?
No, because the errors show heteroscedasticity
6) true statements:
The tolerance is 1 divided by the VIF (variance inflation factor)
If the average variance inflation factor is greater than 1 then the regression model might be biased
Multicollinearity in the data is shown by a VIF (variance inflation factor) greater than 10.
7) Recent research has shown that lecturers are among the most stressed workers. A researcher wanted to know exactly what it was about being a lecturer that created this stress and subsequent burnout. She recruited 75 lecturers and administered several questionnaires that measured: Burnout (high score = burnt out), Perceived Control (high score = low perceived control), Coping Ability (high score = low ability to cope with stress), Stress from Teaching (high score = teaching creates a lot of stress for the person), Stress from Research (high score = research creates a lot of stress for the person), and Stress from Providing Pastoral Care (high score = providing pastoral care creates a lot of stress for the person). The outcome of interest was burnout, and Cooper’s (1988) model of stress indicates that perceived control and coping style are important predictors of this variable. The remaining predictors were measured to see the unique contribution of different aspects of a lecturer’s work to their burnout.
What analysis has been carried out?
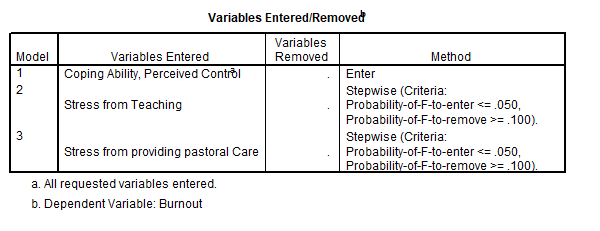
Hierarchical multiple regression
8) Recent research has shown that lecturers are among the most stressed workers. A researcher wanted to know exactly what it was about being a lecturer that created this stress and subsequent burnout. She recruited 75 lecturers and administered several questionnaires that measured: Burnout (high score = burnt out), Perceived Control (high score = low perceived control), Coping Ability (high score = low ability to cope with stress), Stress from Teaching (high score = teaching creates a lot of stress for the person), Stress from Research (high score = research creates a lot of stress for the person), and Stress from Providing Pastoral Care (high score = providing pastoral care creates a lot of stress for the person). The outcome of interest was burnout, and Cooper’s (1988) model of stress indicates that perceived control and coping style are important predictors of this variable. The remaining predictors were measured to see the unique contribution of different aspects of a lecturer’s work to their burnout.
How much variance in burnout does the final model explain for the sample?
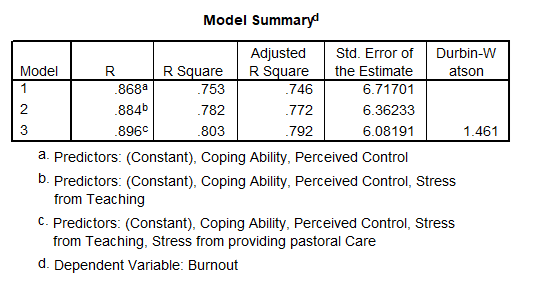
80.3%
9) A consumer researcher was interested in what factors influence people's fear responses to horror films. She measured gender (0 = female, 1 = male) and how much a person is prone to believe in things that are not real (fantasy proneness) on a scale from 0 to 4 (0 = not at all fantasy prone, 4 = very fantasy prone). Fear responses were measured on a scale from 0 (not at all scared) to 15 (the most scared I have ever felt). What is the estimated value of the parameter describing the relationship between gender and fear?
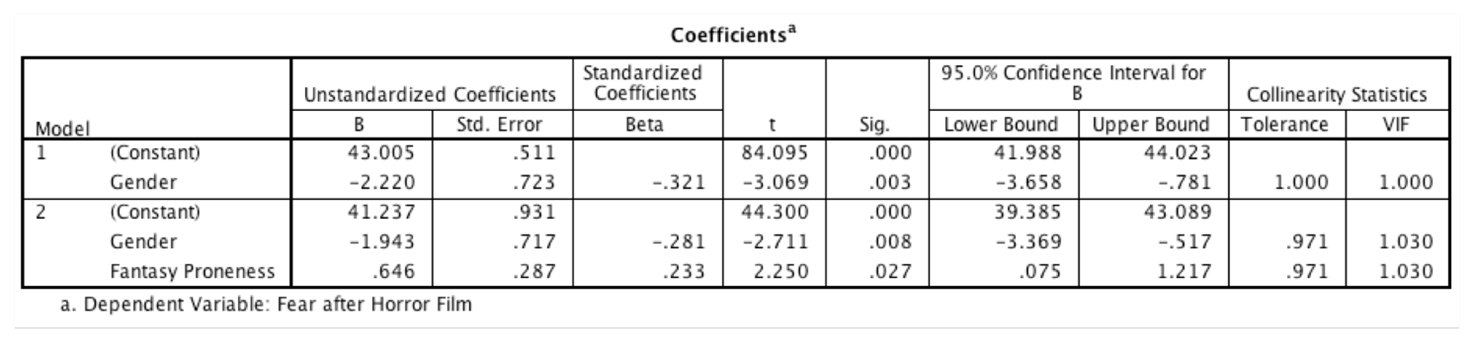
-1.943
10) A multiple linear regression with two Explanatory variables is carried out, explaining 70% of the total variance in the outcome. Variable A uniquely accounts for 30% of the total variance and Variable B for 25% of the total variance. What accounts for the remaining 15% of variance which has been explained?
Variance shared between Variable A and Variable B
11) When we want to determine the goodness of fit in a Linear regression model, we need to review which two items.
R 2 and the F statistic.
12) When assessing the influence of a predictor in a linear model which of the following would you review.
t-statistic
13) A consumer researcher was interested in what factors influence people's fear responses to horror films. She measured gender (0 = female, 1 = male) and how much a person is prone to believe in things that are not real (fantasy proneness) on a scale from 0 to 4 (0 = not at all fantasy prone, 4 = very fantasy prone). Fear responses were measured on a scale from 0 (not at all scared) to 15 (the most scared I have ever felt). How much variance (as a percentage) in fear is shared by gender and fantasy proneness in the population?
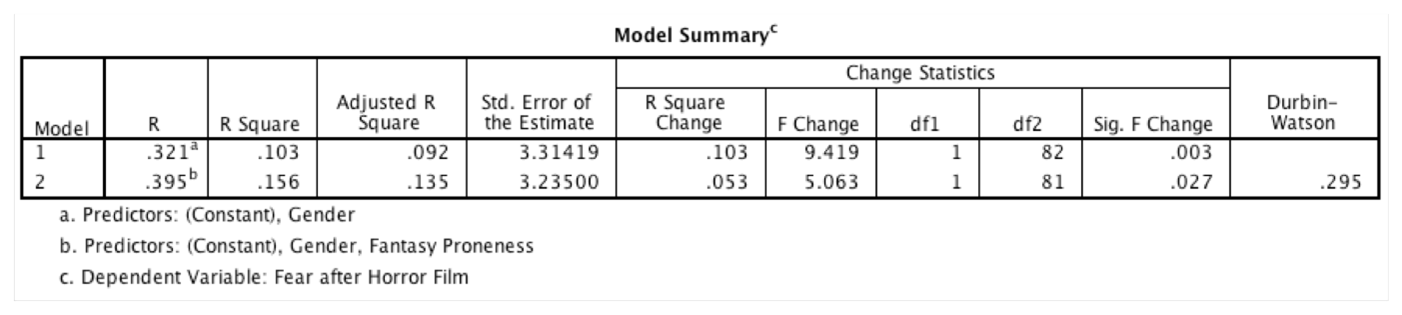
13.5%
14) What is multicollinearity?
When predictor variables correlate very highly with each other
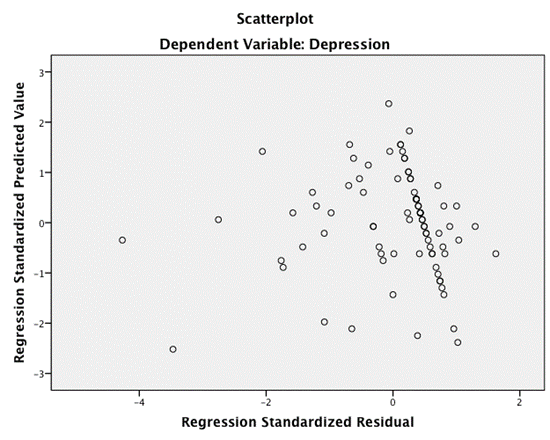
15) The following graph shows:
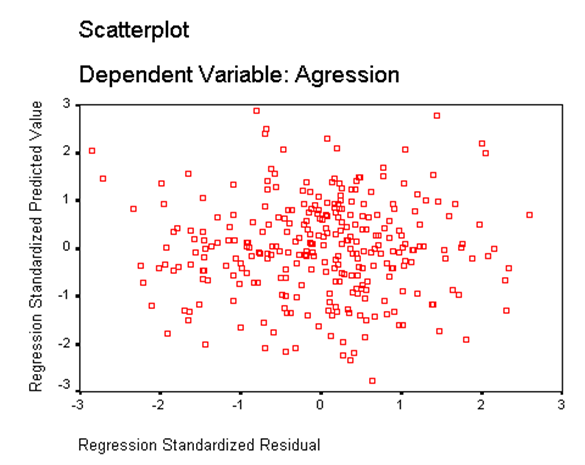
Regression assumptions that have been met or homoscedasticity
Quiz 4 - Practice test
1) A multiple regression model in which all predictors are entered in to the model simultaneously is usually referred to as:
Forced method
2) Variance is:
The average error between the mean and the observations made
3) If we want to examine how scores on one or more variable predict scores on another variable, the most appropriate form of analysis would be:
Linear/Multiple Regression
4) Outcome = model + error is more commonly referred to as:
General Linear Model
5) In terms of ethical documentation, a PIS is a:
Participant Information Sheet