Lec2_Data analytics basics - data quality
Data Cleansing Overview
Focus: Outliers, Missing Data, and Data Noise
Instructor: Professor Zuduo Zheng
Course: CIVL3530: Data Analytics in Civil Engineering
University: The University of Queensland, Semester 1, 2025
Key Inspirational Message
"Passion and obsession, even talent, are only useful tools if you have the work ethic to back them up." - David Goggins
Outline of Topics
Introduction
Outliers
Missing Data
Data Noise
Introduction to Data Quality Issues
Real-world data collection is fraught with errors and noise.
Common issues include:
Outliers
Missing Values
Noisy Values
Purpose of Data Cleansing:
Detect and correct errors
Replace or remove inaccurate or irrelevant observations
Data Cleansing Process
Focused on quality aspects:
Completeness
Validity
Accuracy
Consistency
Methods of addressing issues:
Data imputation for missing values
Denoising and outlier detection
Importance of Data Cleansing
Emphasizes the phrase "Garbage In, Garbage Out":
The quality of data directly affects the results of analysis.
Outliers
Defined as extreme values outside a reasonable range.
Impact of Outliers:
Influence on regression models (dominating fitted lines, biasing inferences).
Distorting relationships between variables.
Leading to biased and unreliable predictions.
Missing Data
Refers to absent values occurring at various time points or spatial locations.
Impact compared to other issues:
Missing data is often more noticeable and manageable, prompting analysts to develop strategies for handling it.
Data Noise
Noisy data can mislead analysis and is often harder to detect.
Denoising methods are used to correct and improve data quality:
Any signal processing method that reconstructs a signal from a noisy one.
Detection and Treatment of Outliers
Common Detection Methods:
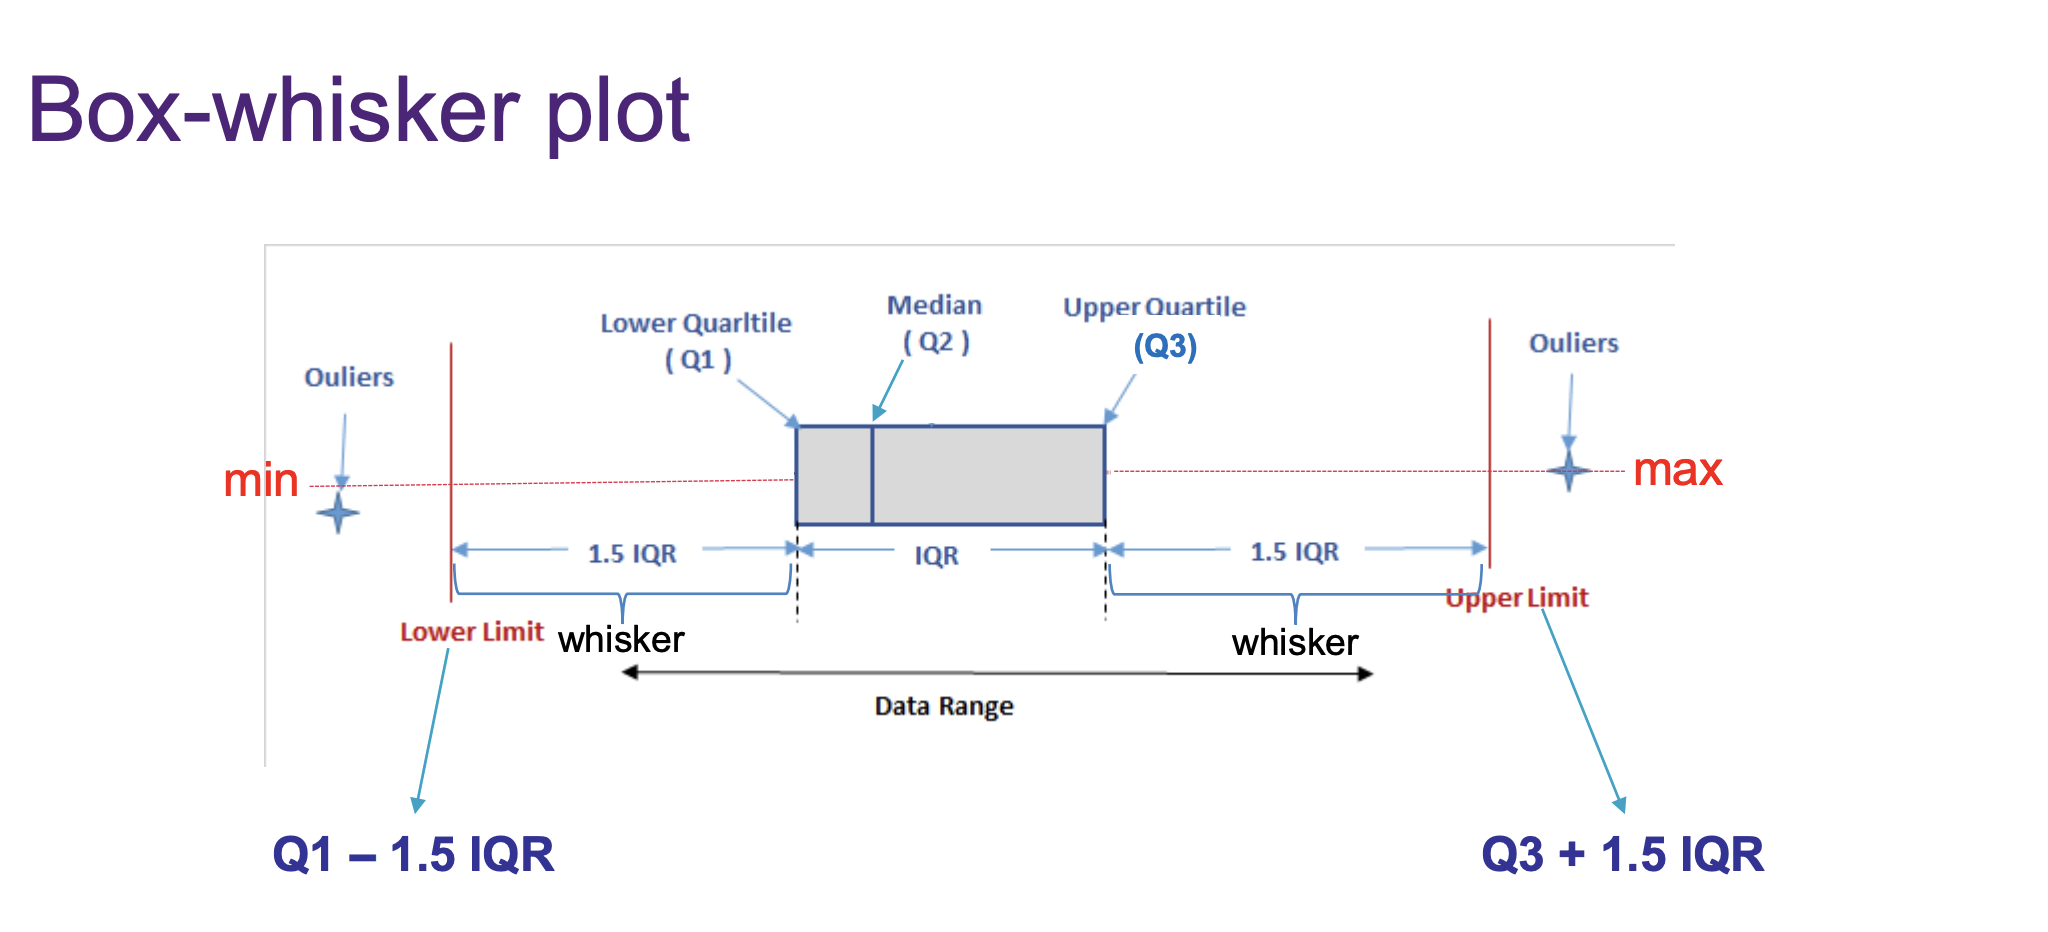
Visualization through box plots is a powerful method.
Box Plot Characteristics:
Broken into four quartiles to display the distribution.
Identifies where the middle and extreme values lie.
Steps to Plot Box-Whisker:
Order the data.
Find medians (quartiles).
Identify extreme values.
Create a number line and draw the box and whiskers.
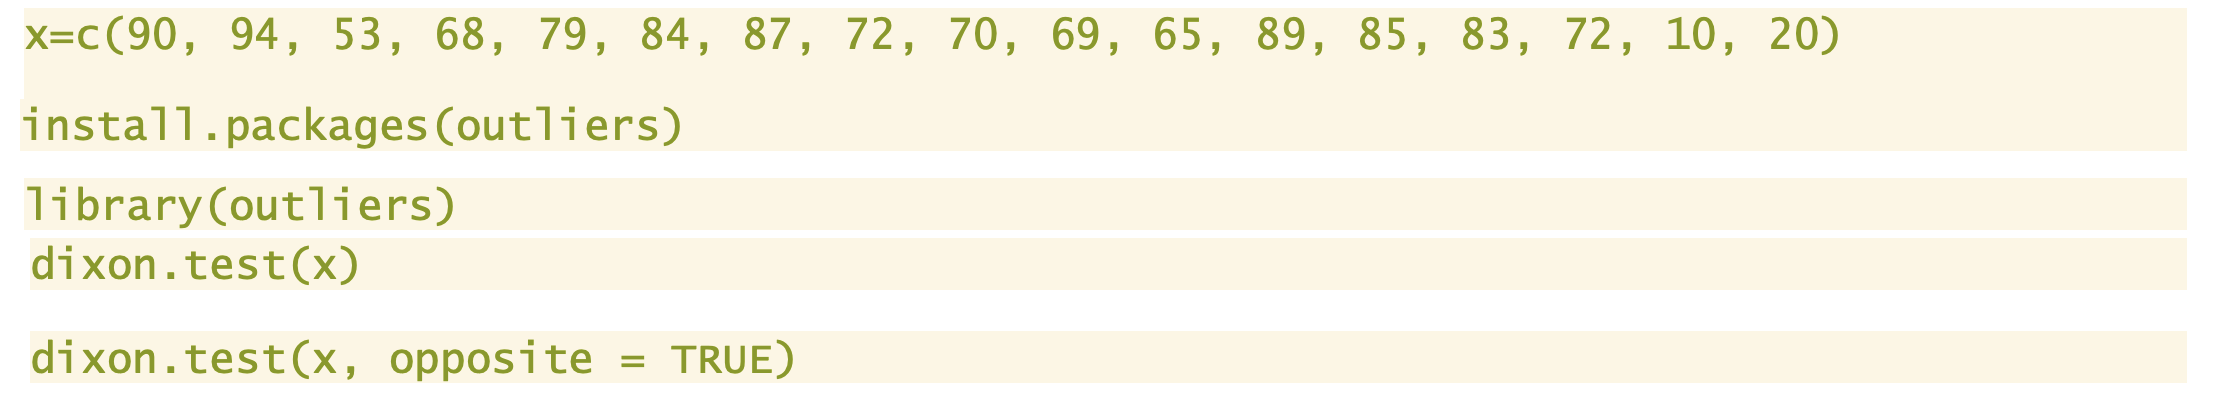
Statistical Tests for Outliers
Dixon’s Q Test
Suitable for small datasets (n=3 to 30).
Null hypothesis: no outliers present.
Grubb's Test
Suitable for larger datasets (>6).

Limitations of Tests
Dixon’s and Grubb’s tests may struggle with multiple outliers (masking and swamping issues).
Rosner’s Test
Generalized approach for multiple outliers, requiring a specified upper limit for detection.

Treating Outliers
Removal of Outliers
Removal may enhance model fit but requires justification to avoid manipulating data.
Replacement of Outliers
Outliers can be replaced with missing values and subsequently predicted.
Importance of Documentation
Justifying decisions on outlier treatment is critical.
Avoid subjective removal practices to maintain credibility in analysis.
Understanding Missingness
Types of Missingness
Missing Completely at Random (MCAR):
No systematic differences in missing data.
Missing at Random (MAR):
Missingness relates to observed data but not to missing values.
Missing Not at Random (MNAR):
Missingness relates to the missing values themselves, introducing potential bias.
Imputation Strategies
Listwise Deletion: Removes incomplete observations but can compromise results.
Pairwise Deletion: Analyzes cases based on complete pairs of data but still problematic with underlying bias.
Mean Imputation: Replaces missing values with the mean of observed data; effective only under MCAR.
Advanced Data Cleaning Techniques
Other methods include regression imputation and multiple imputation, not covered in detail in this course.
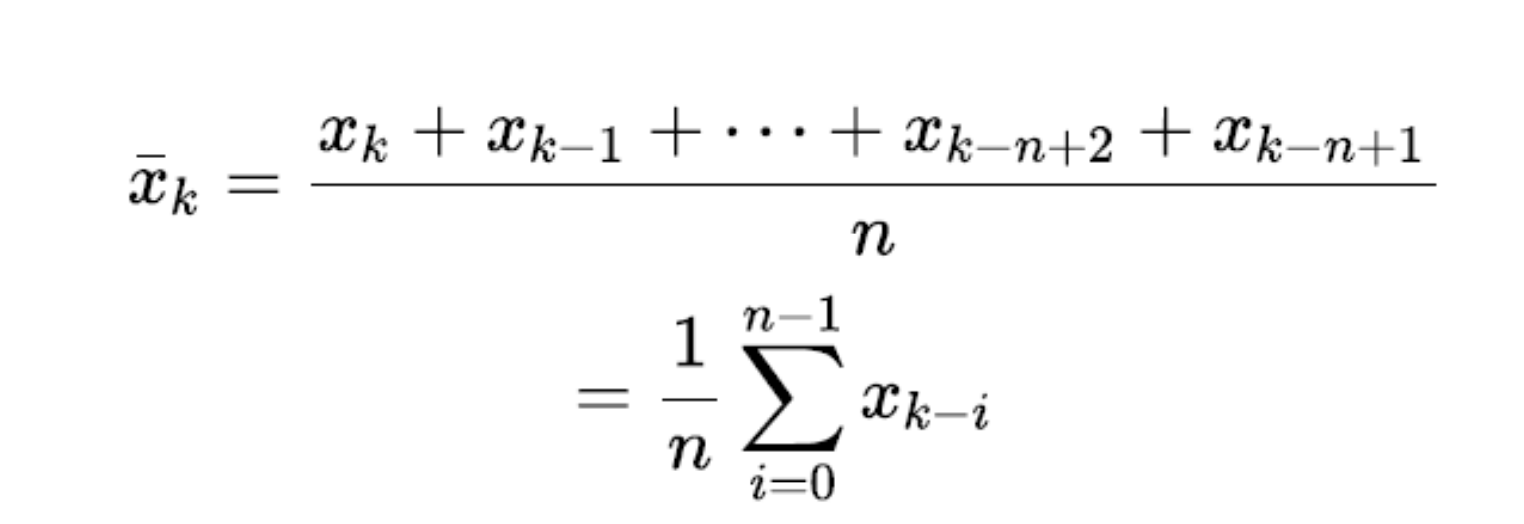
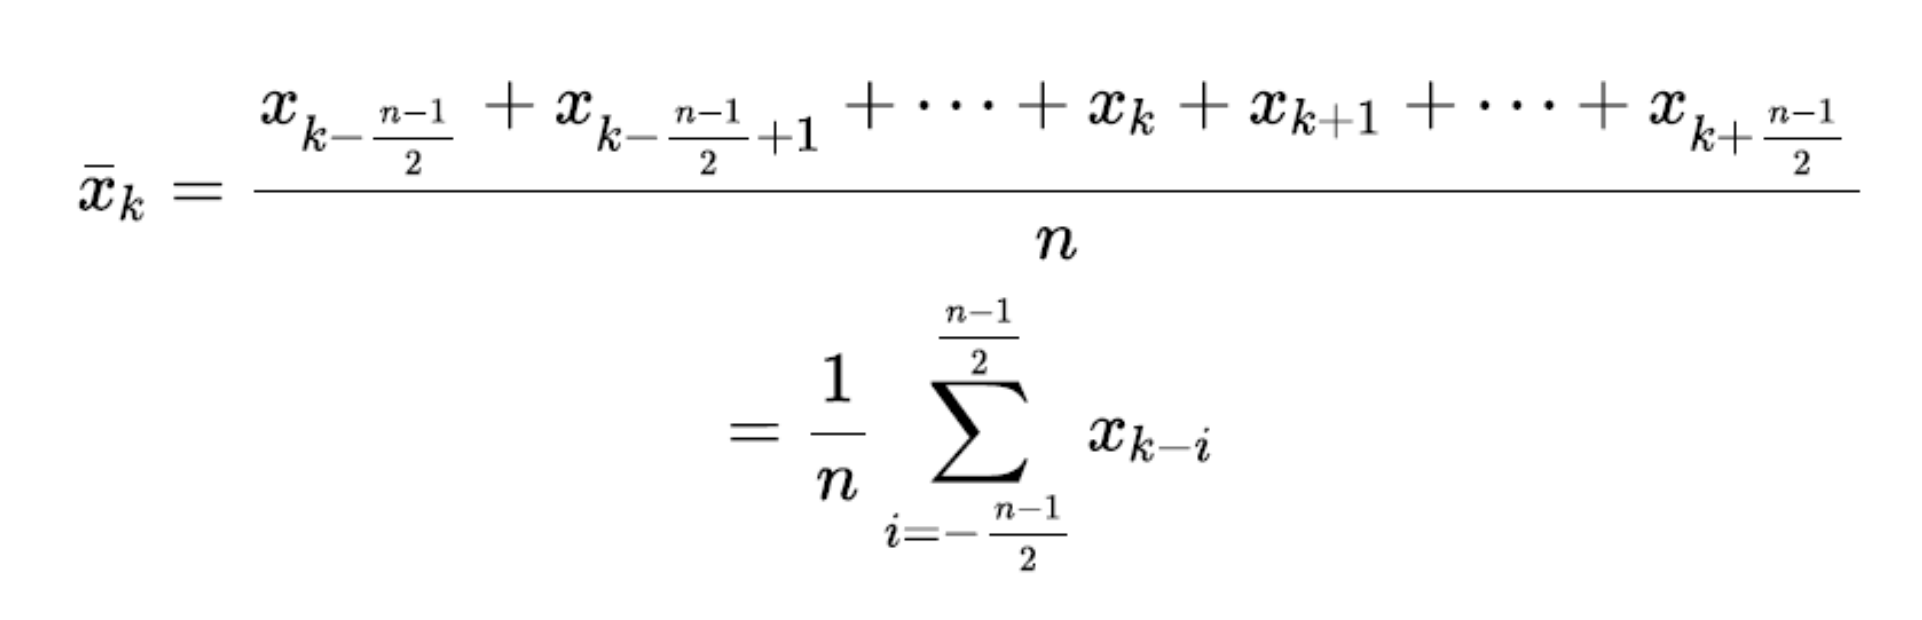
Moving Average as a Denoising Technique
Commonly employed technique:
Types: Simple, Weighted, and Exponentially Weighted Moving Averages.
Utilizes a fixed-size window to process time-series data.
Summary of Moving Average
Window Size: Affects resolution; should align with data patterns and noise.
Practical Implementation in R
Utilize packages such as TTR, zoo, and others for calculating moving averages.
In-Class Quiz Review
Identify which types of missingness fit as MAR in specific survey cases.
Conclusion
Importance of data quality and the impact of errors on analytical outcomes.
Encouragement to engage with cleaning processes meticulously.