CH 4 Arterial Blood Gas Sampling, Analysis, interpretation
Page 1: Arterial Blood Gas Sampling, Analysis, and Interpretation
Introduction
The primary measurements of ABG provide important information about:
Oxygenation
Ventilation
Acid-base balance
Key measurements include:
PO2 (Partial Pressure of Oxygen)
PCO2 (Partial Pressure of Carbon Dioxide)
pH (acidic or alkaline blood)
HCO3- (Bicarbonate)
ABGs guide interventions in respiratory and metabolic management.
Page 2: Blood Gas Analyzers
Blood gas analyzers employ electrodes to measure:
Partial pressure of oxygen
Partial pressure of carbon dioxide
Acidity (pH) of blood
They also calculate:
Oxygen Saturation (SaO2)
Bicarbonate (HCO3-)
Oximetry for SaO2 measurement
Samples can be analyzed from:
Arterial, Venous, Capillary
Require 2.7 to 3.0mL of blood
Page 3: Types of Blood Gas Analyzers
Different models of blood gas analyzers:
STAT, PSTATI, Seneca Scientific LLC, SCAN-STAT
GEM Premier 3000, VISIE, RADIOMETER ABL90 FLEX PLUS
Page 4: Why Use Blood Gas Analyzers?
Evaluate lung efficiency in delivering oxygen and eliminating carbon dioxide.
Assess cooperation between lungs and kidneys to maintain normal blood pH.
Important in managing patients on oxygen therapy, anesthesia, and mechanical ventilation.
Page 5: Blood Gas Analyzers: pH Electrode
The modern pH electrode known as the “Sanz electrode”:
Measures voltage differences across a glass membrane of different pH solutions.
Can analyze small sample volumes (as little as 25 μL).
Page 6: Figure 4-1: Modern pH Electrode
Two chemical half-cells:
Separated by a pH-sensitive glass membrane.
Features a reference electrode and a measuring electrode.
Page 7: Blood Gas Analyzers: PCO2 Electrode
Commonly referred to as the “Severinghaus electrode”:
Measures PCO2 by detecting changes in pH across a semipermeable membrane in proportion to PCO2 diffusion..
Page 8: Figure 4-2: Modern PCO2 Electrode
CO2 diffuses across membrane and reaction occurs:
CO2 + H2O ↔ H2CO3 ↔ H⁺ + HCO3-
The electrode measures the amount of H+ (acid) generated, indicating PCO2 levels.
Page 9: Blood Gas Analyzers: PO2 Electrode
Employs principles of polarography:
Polarography involves electrolysis with a special electrode.
Current plotted against voltage reveals concentration details of chemical species.
Page 10: Figure 4-3: The PO2 Electrode
The “Clark electrode” relies on both a negative (platinum wire) and positive (silver anode) electrode:
polarography is utilized to measure (PO2) in blood samples
sample is subjected to electrolysis using a special electrode and a range of applied voltages
O2 molecules are reduced at the cathode to form hydroxide anions:
O2 + 2 H2O + 4 electrons → 4 OH-
Changes in current (electrons) b/w anode and cathode determine PO2 levels.
Page 11: Oximetry and Co-Oximeters
Oximetry: Measures light absorption at specific wavelengths to determine oxyhemoglobin saturation.
Co-Oximeters: Differentiate among hemoglobin species:
Oxyhemoglobin (O2Hb)
Deoxyhemoglobin (HHb)
Carboxyhemoglobin (COHb)
Methemoglobin (MetHb)
Page 12: Analytical Methods for Measuring Oxygen Saturation
Various devices provide measurements of PO2 and oxygen saturation (O2sat):
Reported data varies in accuracy and method and disadvantages include potential inaccuracies:
ABG Analyzer- invasive, measures arterial blood gas levels: PO2 and O2sat, pH, and PCO2. May be inaccurate in hosp patient / if dysHb present
Pulse Oximeter- non-invasive, uses 2 wavelengths, continuous bedside monitoring of O2 sat and pulse rate. May be affected by poor circulation, skin pigmentation, dyes, MetHb presence.
Co-oximeter- invasive, uses multiple wavelengths, measures concentration of Hb. May be limited in reporting SHb, bilirubin levels
Page 13: Point-Of-Care-Arterial Systems (POCT)
Portable analyzers for bedside testing:
Can also measure electrolytes, glucose, and hematocrit.
advantage: require minimal blood volume (0.5 mL) and fast results
Critical for neonates, minimizing blood volume loss.
Page 14: Blood Gas Analysis and Hemoximetry: Indications
Indications for ABG testing include:
Assessing ventilatory status, oxygenation, and oxygen-carriage capacity.
Evaluating patient response to therapies and monitoring disease progression.
Central venous oxygen saturation (ScvO2) in conditions like sepsis or following major surgery.
Page 15: Blood Gas Analysis and Hemoximetry: Hazards and Complications
Hazards include:
Infection from bloodborne pathogens (HIV, Hep C).
Inaccurate patient management based on faulty analysis/reports.
Risk of cross-contamination from contaminated samples.
Issues from improperly identified patients.
Page 16: Blood Gas Sampling: Sites of Arterial Puncture
Ideal sites for arterial sampling are those that:
Are easily accessible.
Have collateral blood flow.
Have minimal pain sensitivity, with the radial artery being preferred.
Brachial artery is secondarily considered.
Femoral is last resort
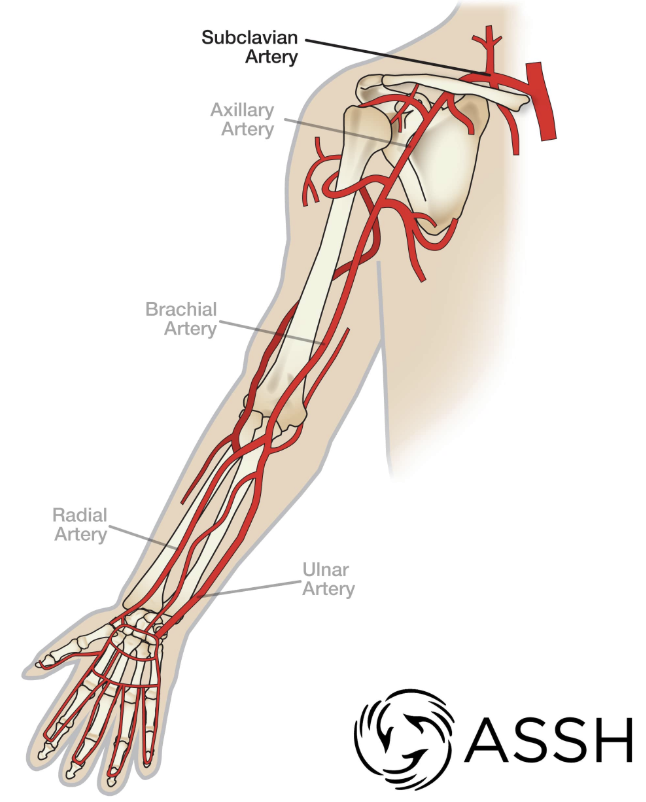
Page 18: Arteries of the Upper Limb
Key arteries include:
Right and Left Subclavian Arteries
Axillary Artery
Brachial Artery
Ulnar Artery
Radial Artery
Page 19: Sites of Arterial Puncture: Femoral Artery
Use femoral artery only if necessary due to:
Depth under the skin and risk of post-puncture bleeding.
Limited collateral supply increases ischemia risks.
Higher infection risk due to proximity to the perineum.
Page 20: Arteries of the Lower Limbs: Femoral
Important landmarks for femoral artery assessment include:
Superior iliac spine
Inguinal ligament
Orientation of surrounding structures (femoral artery, vein, and nerves).
Page 21: Blood Gas Sampling: Complications
Potential complications of arterial puncture:
Hematoma: a localized collection of blood outside of blood vessels, occurs if there is damage to the arterial wall during the puncture.
Arteriospasm: A temporary constriction of the artery that can occur during or after the puncture, potentially leading to compromised blood flow.
Thrombosis: the formation of a blood clot within the artery, which can obstruct blood flow and may cause ischemia in the affected area.
Page 22: The Importance of Coagulation
Coagulation is the mechanism for forming clots to prevent bleeding:
Damage to internal vascular walls activates platelets.
Excessive bleeding results from:
Thrombocytopenia: low platelets
Thromboasthenia: abnormal platelet function
Important to monitor both the quantity and functionality of platelets:
Measured using Prothrombin time (PT), Partial thromboplastin time (PTT), and INR.
Page 23: Coagulation Studies and Increased Risk for Bleeding
Prothrombin time/protime (PT): time required by plasma to form fibrin clot
Normal range is 10-14 seconds; critical level >30 seconds.
Partial thromboplastin time (PTT): evaluates abnormalties in clotting, monitors effect of anticoag therapy
Normal range is 32-45 seconds; critical level >50 seconds.
International normalized ratio (INR): expresses PT relative to established value: a calculation based on results of a PT test used to monitor individuals treated with the anticoagulation medication.
Normal range 0.8-1.2; critical level >5.
Page 24: Causes of Poor Coagulation
Causes of increased PT and PTT include:
Vitamin K deficiencies
Anticoagulant therapies (e.g., warfarin, heparin)
Disseminated intravascular coagulation (DIC)
End-stage liver disease
Page 25: Disseminated Intravascular Coagulation (DIC)
proteins that control blood clotting are overactive, leading to the formation of small blood clots throughout the body's blood vessels,
result in organ damage and a depletion of platelets.
High risk of serious bleeding, even without injury.
Page 26: Allen Test
The modified “Allen test” checks ulnar artery perfusion:
Developed as a noninvasive method in 1929 to assess arterial supply in individuals with thromboangitis obliterans.
Confirms collateral circulation before arterial cannulation.
Page 27: How to Perform an Allen Test
Steps involve:
Have the patient make a tight fist.
Apply pressure to the ulnar and radial arteries.
Have the patient open their hand several times and relax it.
Remove the obstructing pressure from the “ulnar artery” while maintaining pressure on the “radial artery.”
If the ulnar artery is patent, the hand should become flushed within 10 seconds, which is a normal/positive Allen test.
Abnormal ulnar perfusion indicates a negative Allen test, and another site should be evaluated.
Page 29: Radial Artery Puncture Procedure: Steps 1-6
Steps for puncturing the radial artery:
After collateral circulation has been assessed, prepare the patient for puncture of the radial artery.
Locate radial artery for maximal arterial pulsation.
Place a rolled towel under the wrist, with the hand hyper extended to bring the radial artery closer to the skin surface.
Clean the puncture site with alcohol.
Prepare blood gas syringe.
With non-dominant hand locating the maximal arterial pulsation and the dominant hand holding the syringe needle bevel up at a 45-degree angle, puncture the skin and advance the needle.
A flash of bright red blood should be seen in the hub of the needle when the artery is punctured, and the syringe should fill quickly due to blood pressure
Collect approximately 2-3 mL of arterial blood.
Withdraw the needle and apply the needle protective guard and hold pressure on the puncture site for at least 5 minutes, or until it stops bleeding with gauze, then apply an elastic bandage with moderate pressure.
Remove excess air in the syringe by holding it upright and gently tapping the top of the syringe allowing any air bubbles to reach the top of the syringe, where they can then be expelled.
Cap the syringe, label it for analysis, and dispose of used needle in the sharps container.
Page 33: Radial Artery Puncture Procedure Considerations
Important considerations during the procedure:
Needle should be positioned against blood flow for safety.
Avoid directing towards the radial nerve.
Sample transportation to the laboratory should occur within 15 minutes of collection.
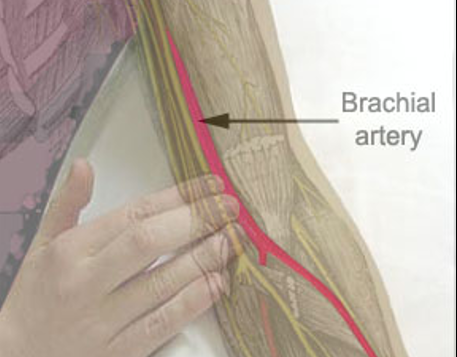
Page 36: Brachial Artery Puncture
Considerations for brachial artery puncture:
Arm should be hyperextended with the hand pronated.
Locate the artery medial side of biceps tendon, distal 1-2cm to antecubital fossa.
do not direct puncture medially - this is location of median nerve.
Page 37: Femoral Artery Puncture
For femoral artery puncture:
Use a perpendicular technique with the patient supine.
Locate the artery just below the inguinal crease.
Identify surrounding structures (femoral nerve, vein in medial).
Page 38: Radial Artery Cannulation: Arterial Line
Indications for arterial cannulation include:
Continuous monitoring of arterial blood pressure and frequent ABGs.
Radial artery is usually the first choice; femoral may also be used.
Local anesthetic is applied for comfort prior to insertion.
after insertion, catheter connected to stopcock for sampling, transducer for bp monitoring and flush solution to prevent clotting
Page 39: Figure 4-8 A: Arterial Line Insertion (Steps 1-4)
Steps in arterial line insertion:
Sterile technique followed during catheter insertion.
Hyperflexed wrist for better visibility of artery.
Pulsating vessel palpation prior to puncture.
Puncture at a 20-40 degree angle once blood flash is seen.
needle immobilized with free hand and guidewire advanced
needle removed to leave only guide wire
guidewire removed and tubing connected to catheter
Page 42: Types of Arterial Lines
Various systems include:
OR standard, Safe Set, Vamp System for arterial monitoring.
Page 43: Venous Blood Gases
Venous blood samples provide valuable insights:
Reflect conditions of tissues from which venous blood originates.
Important for checking diabetic ketoacidosis
Assessing acid-base balance in hemodynamically stable patients.
For sepsis patients, central & mixed venous PO2 reflect tissue PO2; low/mixed venous PO2 indicates tissue hypoxia
Capillary Blood Gases
Capillary samples serve as alternative analyses:
Usually employed in infants or adults w/ difficult access points.
Handling like arterial samples, ensuring no contamination.
Common Arterial Blood Gas Preanalytic Errors
Common errors include:
Room air contamination, heparin dilution, blood clots, hyperventilation during sample collection, and lengthy delays before analysis, excessive sample metabolism, inadequate wait time b/w change in inspired O2 or ventilation changes.
Pre-Analytic Errors
Room air: contains negligible CO2/PO2 150mmHg; bubbles can artificially elevate PO2 and lower PCO2 values:
Immediate capping of samples prevents this error.
Heparin dilution: Sodium heparin can affect pH; excessive heparin leads to inaccuracies:
Absence of heparin may clot samples, clogging analyzers.
Long delay in collection to analysis: Diffusion rates affected by temperature and syringe material:
Glass syringes preferred for delay; keep on ice to minimize white blood cell O2 consumption.
0.1 mL of O2 from 100 mL blood in 10 minutes at body temperature
Plastic syringes used for delay to analysis lead to gas diffusion altering results:
solubility of O2 and CO2 in the sample increases when plastic syringe is cooled, reduces partial pressure and O2 and CO2 diffuse across plastic
heating of sample cause gases to escape and leads to higher PCO2 and PO2
Samples must be well mixed before analysis:
Thrororough mixing ensures even heparin distribution to prevent clotting.
Quality Control and Proficiency Testing
Calibration of analyzers is mandatory:
Modern devices perform automatic calibrations every 3 minutes to reference standards.
National Institute of Standards and Technology(NIST) provides the necessary reference materials and guidelines to ensure accuracy in measurements.
Quality is crucial; regulated under Clincal Laboratory Improvement Amendment (CLIA):
Programs must meet at least two levels of control for pH, PCO2, and PO2.
Internal and external QC with results using Levy-Jennings charts
Analyzer temperature: Results are reported at normal body temp (37°C):
No current recommendations to adjust for actual patient temperature corrections.
Arterial Blood Gas Sampling, Analysis, and Interpretation Part 2
Physiology of Acid-Base Balance
Normal physiology generates acids from metabolism:
Volatile acid: carbonic acid (H2CO3) eliminated as CO2 by lungs.
carbonic is volatile b/c it can dissociate into gas to be exhaled
Non-volatile acids: like phosphates and sulfates are eliminated by kidneys.
Acid-base balance entails mechanisms that regulate hydrogen ion concentration [H+].
Page 56: The Concept of pH
Developed by Sorenson in 1909;
pH is a measure of hydrogen ion concentration
pH represents the acidity/alkalinity of a solution (7.0 is neutral);
Defined as the negative logarithm of [H+]:
pH = -log [H+]
logarithm is power to which a # is raised to get another #
100 = base of10 is raised by 2 (10^2=100).
The pH Scale
Ranges from 0-14 (negative logarithm of H+):
Decreasing pH denotes increasing [H+];
increasing pH indicates decreasing [H+].
Water has little dissociation and equilibrates w/ equal parts acid and base at 25°C:
Dissociation equation: H2O ↔ H+ + OH-
pH of H2O contains 10-7 mol/L of H+ and 10-7 mol/L of OH-
Equilibrium in pure water yields a pH of 7.0.
pH = -log (10-7) = - (-7) = 7.0 or neutral pH
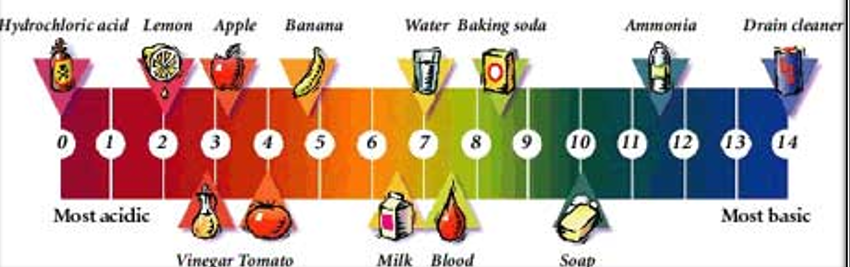
Acidic solution: pH <7.0; Alkaline solution: pH >7.0.
Acids donate protons; bases accept protons.
pH of Arterial Blood
Normal arterial blood pH is between 7.35–7.45:
6.0-6.9: Death
7.0-7.34: Acidosis
7.35-7.45: Normal
7.46-7.79: Alkalosis
7.8-9.0: Death
Buffer Solutions
Weak Acids and Bases
Buffers are combinations of weak acid and their conjugate bases or weak base and conjugate acid (e.g., carbonic acid and it’s base bicarbonate).
Buffer resists a big change in H+, and pH, when acid or base is added.
Dissociation of carbonic acid shows how buffers minimize changes in pH
Strong Acids
Strong acids like HCl are neutralized by buffers:
HCl reacts with bicarbonate to stabilize drops in pH.
Strong Bases
Reaction of strong bases with buffers to form weaker bases and water:
NaOH interacts with H2CO3, managing excess base and pH stability.
Buffer Systems
Body employs numerous buffer systems:
Primary is bicarbonate: plasma, interstitial and intracellular H2O and carbonate in bone
others: hemoglobin (intracellular protein), plasma proteins, and phosphate buffers.
Importance of Bicarbonate (HCO3-)
Bicarbonate allows for conversion and elimination of CO2 through lungs:
Essential in acid-base neutrality due to its volatile acid reactants.
reaction is facilitated by carbonic anhydrase
Buffer Systems in Different Body Compartments
List of buffer systems across compartments:
Intersitial Fluid: Bicarbonate, phosphates, proteins
Blood: Bicarbonate, Hb, plasma proteins, phosphates
Intracellular fluid: proteins, phosphates, bicarb
Bone: calcium carbonate
The Henderson-Hasselbalch Equation
Describes equilibrium relationships among pH, PCO2, and HCO3-:
useful to check for inaccuracies due to blood gas analyzer problems, transcription mistakes, or other errors; also to anticipate effect of change in one value.
[H+]=24 x PCO2/([HCO3-])
7.35 - 7.45pH = 45 - 35 H+ mmol/L
Base Excess
Base excess indicates amount of strong acid required to normalize pH while maintaining the partial pressure of CO2 at 40mmHg:
If blood has a pH of 7.40 and a PCO2 of 40 mm Hg, the base excess will be 0 mmol/L.
Normal value is ± 2 mmol/L; calculates during ABG analysis.
Despite its deficiencies, base excess is used in some clinical settings because of its simplicity.
The usefulness of the standard base excess method in acid–base evaluation is improved when it is combined with the anion gap
Assessment of Unmeasured Anions
Unmeasured anions impact interpretation of acid-base balance:
Methods to evaluate include anion gap and strong ion difference.
Many conditions can result in increase in unmeasured anions affecting pH
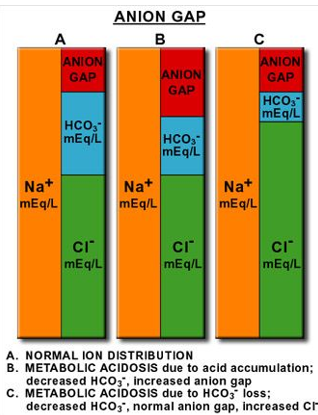
Anion Gap
Formula for assessing concentration of unmeasured anions:
[Na+] - [CL-] + [HCO3-]
Normal range for anion gap is 8 to 16 mEq.
caused by negatively charged plasma proteins, sulfate, phosphate, increased levels indicating metabolic acidosis
unmeasured endogenous: lactacte, keytones
unmeasured exogenous: salicylate (salt of salicylic acid)
Anion gap signaling metabolic acidosis helps differentiate causes, and assessing treatment effectiveness (like DKA)
Clinical implications include understanding lactic acidosis and the role of albumin in measurements.
lactate level of 5 to 10 mmol/L can be associated with sepsis even w/ AG in reference range (~50% of cases)
albumin, may be low in patients with septic shock/lactic acidosis, reducing anion gap
plasma lactate may move intracellularly in exchange for chloride, decreasing anion gap
large amounts of IV saline can increase chloride levels, decreases anion gap
Causes of Anion Gap Acidosis
High anion gap acidosis (>16 mEq) can stem from diverse sources:
Ketoacidosis (diabetes 1, starvation, ETOH)
lactic acidosis, renal failure, toxins
Normal anion gap acidosis (8-16 mEq)
diarrhea; pancreatic or small bowl fistula; admin of saline of HCl
Decreased anion gap (<8 mEq)
Hypoalbuminemia
Note: high anion gap lactic acidosis may appear as normal anion gap acidosis in a patient with hypoalbuminemia.
The Strong Ion Difference or Strong Ion Gap
another approach to determine unmeasured anions and is considered more refined than the anion gap.
Strong ion gap provides clarification for various acid-base disturbances noted in critical care settings.
meta alka associated w/ decreased albumin
mechanism of hyperchloremic acidosis
role of ammonia in ph balance (buffer)
The Stewart model suggests that three independent variables control pH: strong ion difference (SID), the total weak acid concentration, and PCO2.
Albumin-Corrected Anion Gap
Traditional anion gap measurements overlook albumin variations in critically ill patients:
For every gram decrease in albumin the anion gap will decrease by 2.5 to 3 mol/l
Adjustments necessary due to the significance of albumin on results.
Anion gap + 2.5(4.2 - albumin)
Erythrocytes and Acid-Base Control
Erythrocytes buffer quick shifts in ion concentrations assisting pH balance:
Hemoglobin is 6x important due to its 2x larger presence and 3x more histidine buffers compared to plasma proteins.
Histidine is an amino acid that buffers at a pH range of 6.0 -7.4.
A pH change 7.5 to 6.5 = Hb buffer 27.5 mmol/L of H+; plasma buffers only account for 4.2 mmol/L of H+
Page 80: The Lungs and Acid-Base Control
Lungs regulate acid-base through CO2 elimination influencing the carbonic acid concentration.
~13,000 to 20,000 mmol/day
lungs can produce rapid changes in pH
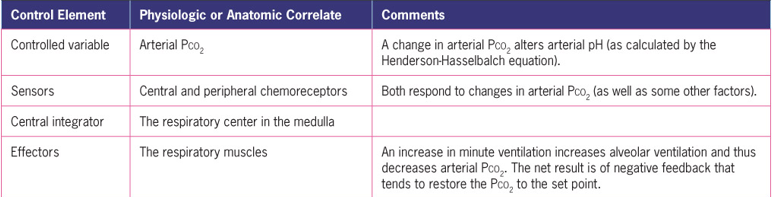
Physiology of Acid-Base Balance
In physiologic fluids, the main strong ions are Na+, K+, and Cl–.
[SID] = [Na+] + [K+] – [Cl–]
The components of this model are a control variable that is monitored by a sensor, a central integrator that interprets the information from the sensor, and an effector mechanism that can alter the controlled variable.
Kidneys and Acid-Base Control
Kidneys are vital for excreting non-volatile acids and reabsorbing bicarbonate to regulate blood pH.
~70 to 100 mmol/day
Daily filtered bicarbonate equals the product of the glomerular filtration rate (180 L/day).
85% to 90% of the filtered bicarbonate is reabsorbed in the proximal tubules
Common Causes of Respiratory Acidosis
Low pH and elevated PaCO2 (hypercapnia)
Associated w/ alveolar hypoventilation: drugs, neuromuscular diseases, morbid obesity, severe kyphoscoliosis, idiopathic (primary alveloar hypovent. syndrome)
Associated w/ severe V/Q mismatch: COPD, advanced diffuse lung parenchymal disease (pumonary fibrosis)
Common Causes of Respiratory Alkalosis
High pH with decreased PaCO2 from hyperventilatio (hypocapnia).
Two compensatory responses: retention of Cl- via decrease in renal secretion and small accumulation of lactate due to liver stimulation of glycolysis in erythrocytes
Associated w/ normal lungs: anxiety, fever, drug OD, pregnancy, sepsis, liver cirrhosis, high altitudes
Assocated w/ V/Q mismatch: acute bronchial asthma, pneumonia, pulmonary vascular diseases/embolism, pulmonary edema, and pulmonary fibrosis.
Can be due to overagressive mechanical ventilation
Common Causes of Metabolic Acidosis
pH decreased with decreased HCO3-; increase the production of nonvolatile acids or lead to excessive loss of bases; both increase H+ and decrease pH
Acidosis instigates ventilation changes with processes reducing bicarbonate or augmenting acid production.
associated with Kussmaul respirations, it’s a potent stimuluse to increase ventilation
Increased unmeasured ions: ketoacidosis, lactic acidosis (hypoxia, drugs, enzyme defect), poison, renal failure
Normal unmeasured ions: renal tubular acidosis, potassium-sparing diuretics, diarrhea, pancreatic fistula, excessive intake of ammonium chloride/carbonic amino acids
Common Causes of Metabolic Alkalosis
High pH with increase HCO3-; usually occurs when loss of fixed acids or gain in blood buffer base
Fixed acid loss from GI or rengal route
serum Cl- usually decreased and MA can be corrected by IV of saline
Associate w/ Chloride depletion: vomiting, gastric drainage, diuretics, posthypercapnic alkalosis
Associated w/ hyperadrenocorticism: Cushings, primary aldosteronism, Bartter syndrome, Licorice ingestion
Execessive Alkali intake: milk-alkali syndrome, ingesting sodium bicarbonate
Severe potassium depletion
Page 87: Table 4-9: Normal Arterial Blood Gas Values
Reference ranges for ABG analysis:
pH: 7.35–7.45
PaCO2: 35–45 mm Hg
HCO3-: 22–26 mEq/L
PaO2: 80–100 mm Hg
SaO2: 95%–98%
Page 88: Seven Step Approach to ABG Interpretation
Step 1: Conduct a physical assessment
Step 2: Examine arterial pH.
Step 3: Assess the PaCO2.
Step 4: Assess the HCO3-
Step 5: Determine the acid–base disorder
Step 6: Determine if the PaCO2 and HCO3- are moving in the same or opposite direction
Step 7: Look at the PaO2 and SaO2 to determine adequacy of oxygenation