GEOL 108, Crises of a Planet (Midterm)
Geology 108 Notes
1/15
What is a natural disaster?
Natural cause with negative impact
Sudden change
Or not
High Death rate
Extensive Damage
To structures
Infrastructure
Minor events but occurring often
Emergency Manager Perspective
Expressed as a formula
R= H*E*V, Risk, Hazard, Exposure, Vulnerability
Sometimes a cascade
Many things relate to many others
Harder to study
Hard to evaluate
Need to consider odds of several things happening
Easy to stir up irrational fears
FEMA Terminology
Four classes
Emergency declaration (<$5M)
An unexpected event which places life and/or property in danger and required an immediate
Major Disaster declaration (unlimited aid)
Catastrophe (not official)
Extinction level event (not official)
Four classes
Emergency declaration ( < $5M)
An unexpected event which places life and/or property in danger and requires an immediate response using routine community resources and procedures.
Major Disaster declaration (unlimited aid)
A disaster is an emergency considered severe enough by local government to warrant the response and dedication of resources beyond the normal scope of a single jurisdiction or branch of local government.
Often declared, come with resources, there were 47 in 2022, 70 in 2023.
Catastrophe (not official)
An event in which a society incurs, or is threatened to incur, such losses to persons and/or property that the entire society is affected, and extraordinary resources and skills are required, some of which must come from other nations.
Extinction level event (not official)
Geological evidence shows that they have happened on many occasions since multicellular life became abundant on the planet almost a billion years ago.
Potential to cause catastrophe
Natural hazards vary greatly in their potential to cause a catastrophe.
Floods, hurricanes, earthquakes, volcanic eruptions, large wildfires, and heat waves are the hazards most likely to have a high potential to create catastrophes.
Landslides and tornadoes, because they generally affect a smaller area, have only a moderate potential to produce a catastrophe.
Drought also has a moderate potential to produce a catastrophe because, although drought may cover a wide area, there is usually plenty of warning time before its worst effects are felt.
Hazards with a low potential to produce a catastrophe include coastal erosion, frost, lightning, and expansive soils.
Toll of natural disasters
Half of the total disasters (44 percent) occurred in Asia
where about two-thirds of the people (4.44 billion) on Earth live.
Countries with medium-to-low income
suffered most from floods and storms.
High-income countries
suffered greatest economic losses but lowest number of deaths.
The United States, 0.34 billion people (4%),
experienced about 6% of the disasters.
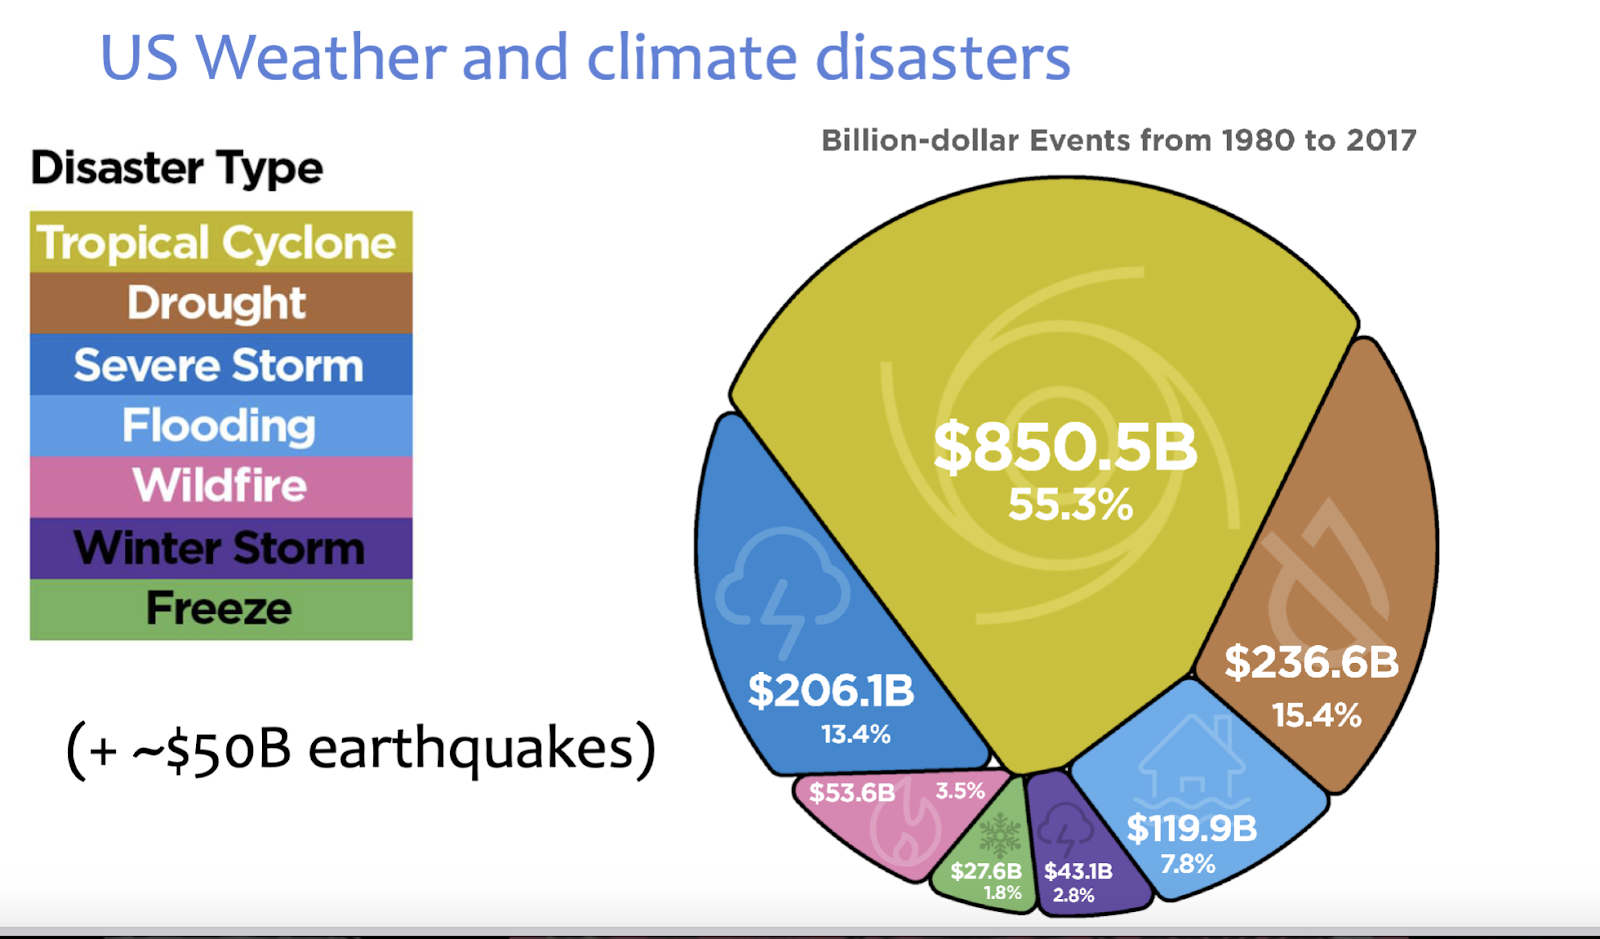
Natural Disaster Cost
The average annual cost of natural hazards has increased dramatically over the last several decades
This is due to in part increase in world population
It is also a function of the increased value of properties at risk and to human spread to more hazardous areas
Toll of Natural Disasters in Perspective
World GNP is ~100 trillion dollars / year ($1014 dollars)
US and Europe are each about $20T
World population is ~10 billion people (1010)
US just 350 million
Natural disasters cost ~$100 billion / year ($1011)
Locally traumatic
Temporarily traumatic
Small chance of much bigger ones
Much of this cost is avoidable, the topic of this course.
Climate change could dwarf these numbers
COVID probably cost tens of trillions of dollars
1/17
Factor in fire?
Hydroclimate whiplash, an abrupt switch between very west and very dry conditions that is likely to occur more frequently as earth warms.
The LA area received abnormally large amounts of rain in 2023 and early 2024, promoting plant growth.
But less than 1 mm has fallen since 1 July, and brush and grass dried into tinder.
Real effect in study (for Asia), but projects only 3X effect by 2100
Not yet a dramatic change
More people near wildland
A factor that drove the intensity of the LA wildfires is the density of homes in steep terrain.
Around the world, more people are moving into the wildland urban interface, where cities meet natural landscapes
Fires that ignite at the interfaces can spread into purely urban areas with devastating results
As population in the boundary zones grows, fires that start there are more likely to migrate into areas that are unequivocally urban, researchers say.
Academics in action
Earth sciences research
How did smoke move through the basin
Effect of burnt run-off into the ocean
Landslides on the burnt surfaces
Samping pink fire retardants for metal pollution
Caltech/JPL discussion
Can seismograms/satellites monitor fires in real time?
Already watching for landslides and lahars
80 person zoom in Viterbi
Engineering businesses to launch?
Disaster Agencies
Federal Emergency Management Agency (FEMA)
The Federal agency that coordinates the response of Federal agencies to disasters and the communication of information about disasters between Federal agencies and the public, particularly within the first 48 hours following the event.
JFO, Joint Field Office
RSF, Recovery support functions
Communication Concepts and Systems
Several systems are in place for communicating during disasters or alerting the general public to an imminent disaster:
Emergency Alert System
National Wireless Priority System
NOAA Weather Radio
National Terrorism Advisory System
Wireless Emergency Alerts
Radio (short-wave) Amateur Civil Emergency System (RACES)
Social media can be an effective tool for communicating information to the general public and for situational awareness gathering.
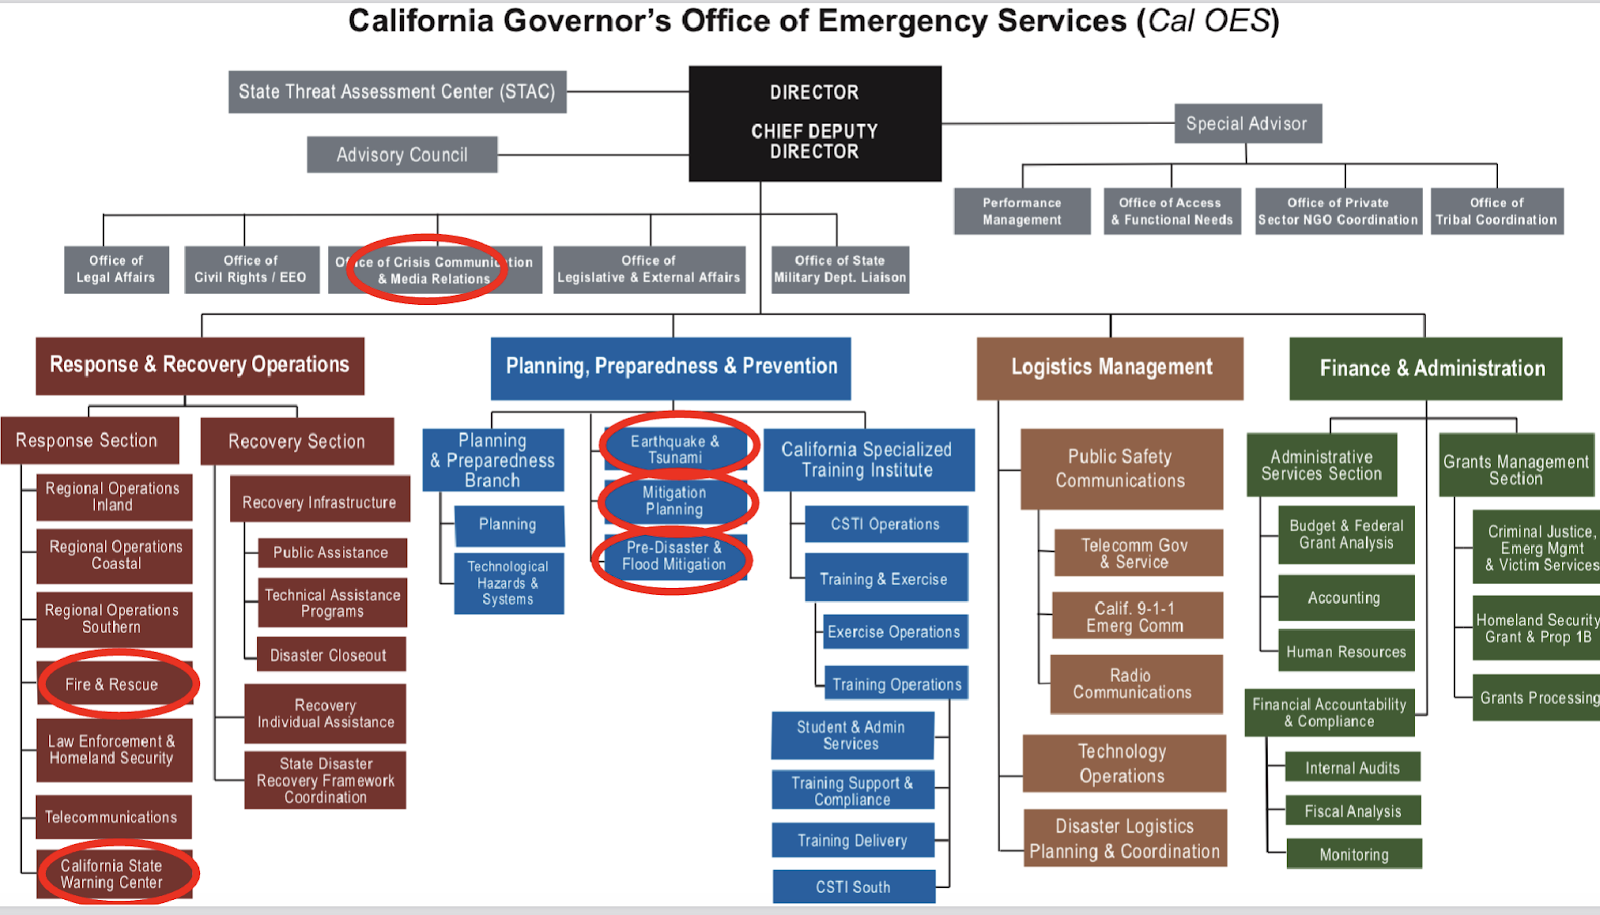
Cal OES (California Office of Emergency Services)
The California Governor’s Office of Emergency Services (Cal OES) began as the State War Council in 1943.
With an increasing emphasis on emergency management, it officially became OES in 1970.
In 2003, with the State increasing its focus on terrorism prevention after the attacks of 9/11, the Governor’s Office of Homeland Security (OHS) was established through an Executive Order by Governor Gray Davis.
In 2004, the California Legislature merged OES and the Governor’s Office of Criminal Justice Planning, which was responsible for providing state and federal grant funds to local communities to prevent crime and help crime victims
In 2009, the California Legislature merged the powers, purposes, and responsibilities of the former OES with those of OHS into the newly- created California Emergency Management Agency (Cal EMA).
On July 1, 2013, Governor Edmund G. Brown Jr.’s Reorganization Plan #2 eliminated Cal EMA and restored it to the Governor’s Office, renaming it the California Governor’s Office of Emergency Services (Cal OES), and merging it with the Office of Public Safety Communications.
Los Angeles Emergency Management Department
Big cities have this scale operation
Seattle, Portland, Los Angeles
Assigned chairs, lots of communications pre-configured
Ways to help
Land use planning
Restricting where and what people can build
Almost any attempt to regulate land use in the public interest is likely to ignite political and legal opposition
Some are most concerned with economics, others with safety, others with the environment
Insurance
Insurance for some natural hazards is simply not available. Landslides, most mudflows, and ground settling or swelling are too risky for companies, and each potential hazard area would have to be individually studied by a scientist or engineer who specialized in such a hazard
Big government
Disaster assistance is often provided without a large cost-sharing component from states and local organizations. Thus, local governments continue to lobby Congress for funds to pay for losses but lack incentive to do much about the causes
Public education
The best window for effective hazard reduction is immediately following a disaster of the same type
Studies show that this opportunity is short—generally, not more than two or three months
Role of Insurance
Insurance brings significant benefits by
Promoting financial stability,
Helping relieve the burden on governments for providing protection of citizens via social security, encouraging loss mitigation, and
Generally making people more aware of the reality of risks and their consequences through information and pricing signals.
The most significant contribution of insurance is the provision of risk sharing, risk transfer abilities and loss prevention measures.
The security of insurance encourages high-value investments such as purchasing a house or spending money on infrastructure.
The affordability of insurance is an important social issue.
US Disaster relief less when news is distracted
A study of the influence of mass media on U. S. government response to 5,000 natural disasters occurring between 1968 and 2002.
These disasters took nearly 63,000 lives and affected 125 million people per year.
U. S. relief depends on whether the disaster occurs at the same time as other newsworthy events, such as the Olympic Games, which are obviously unrelated to need.
To have the same chance of receiving relief, the disaster occurring during the highest news pressure must have six times as many casualties as the disaster occurring when news pressure is at its lowest, all else equal.
Relief decisions are driven by news coverage of disasters and that the other newsworthy material crowds out this news coverage
Heat Waves
Depends on country/state/location/organization
Typically form near high air pressure system
Example of how scientists choose a field
Geochemistry, atmospheric science, oceanography, stellar astrophysics.
The 2003 Europe Heat Wave
The 2010 Russia Heat Wave and Wildfires
Four biggest disasters
WWII
1918 Spanish flu
Great Chinese famine
COVID
Population
USA- 340,000,000
World- 8,000,000,000
Fatalities so far
USA- 800,000
World- 7,000,000
Politicization of issues
Important Terms and Concepts
R=H*E*V
Some disasters are cascades
Dollar cost of natural disasters
Cycle of mitigation implementation
What is FEMA
Roster of chores in disaster response
Disparities of news coverage
Impact of the worst disasters in the century
Issues in the response to COVID
1/22
Plate Tectonics Notes:
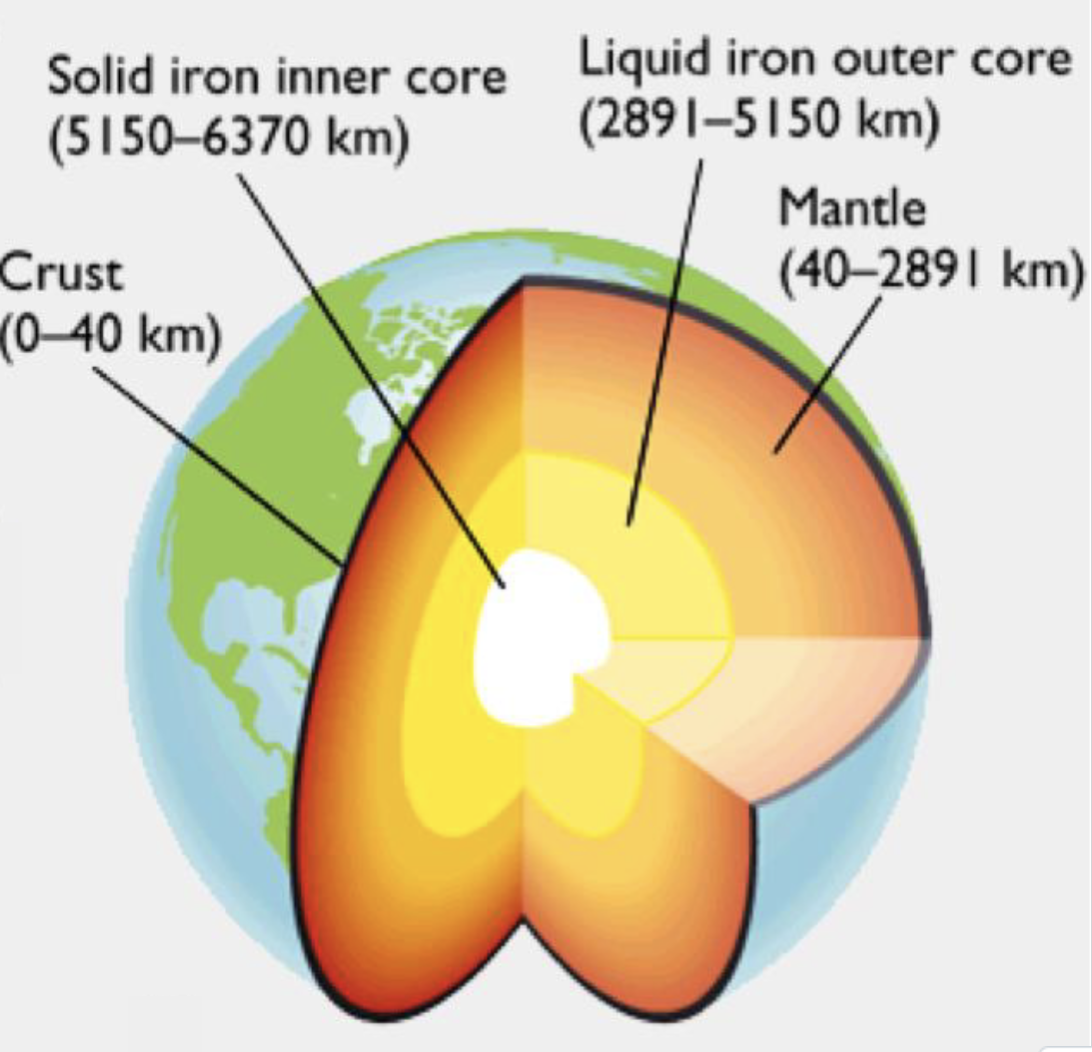
Core, mantle, crust
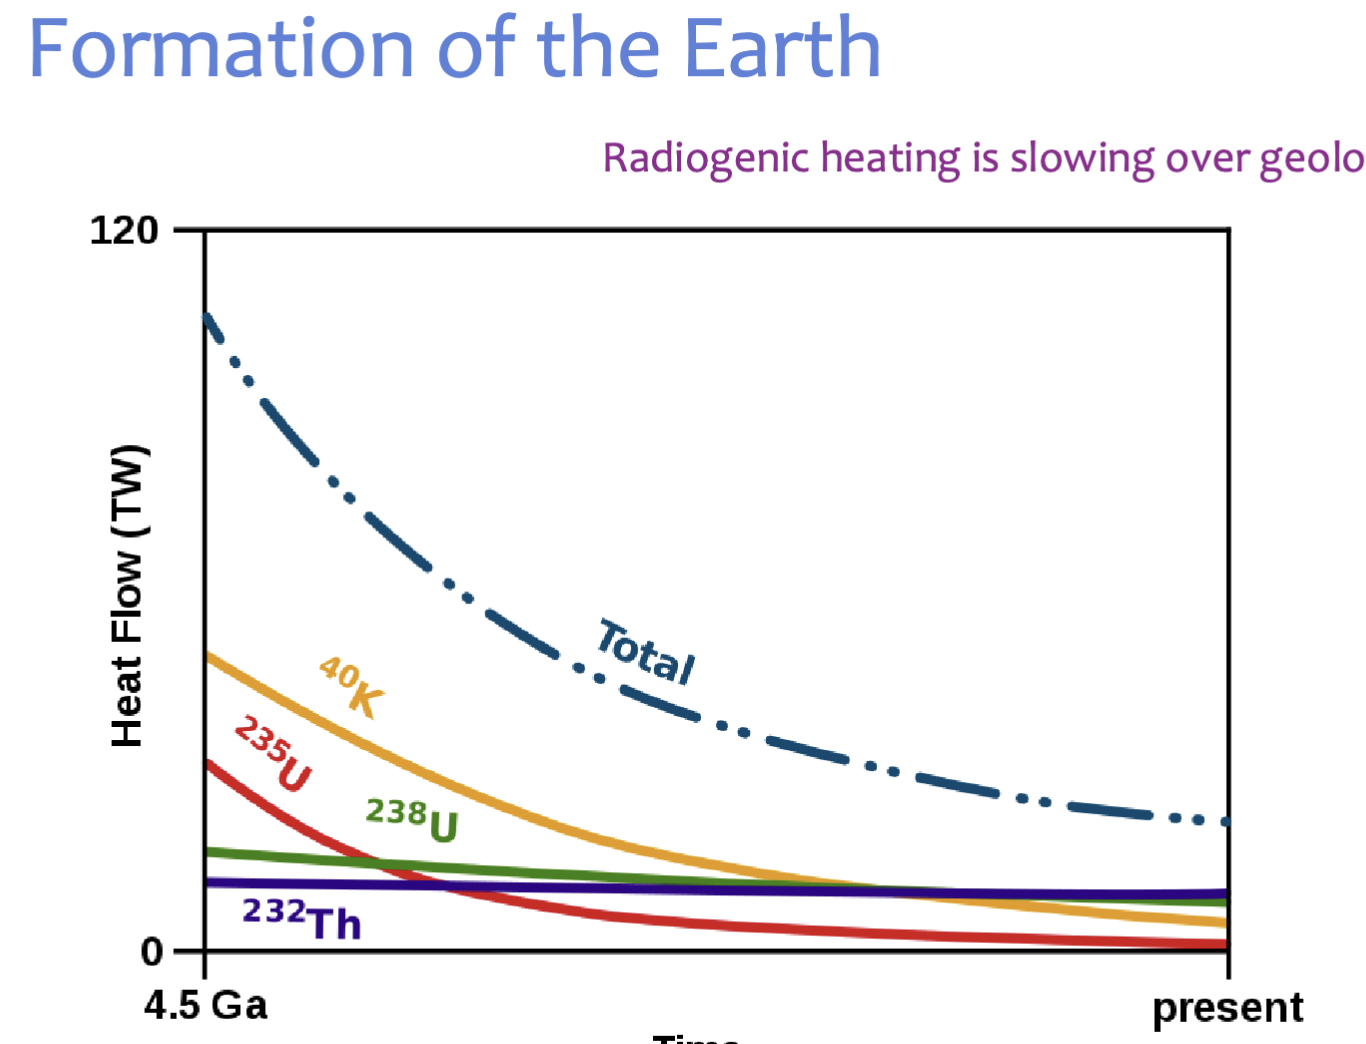
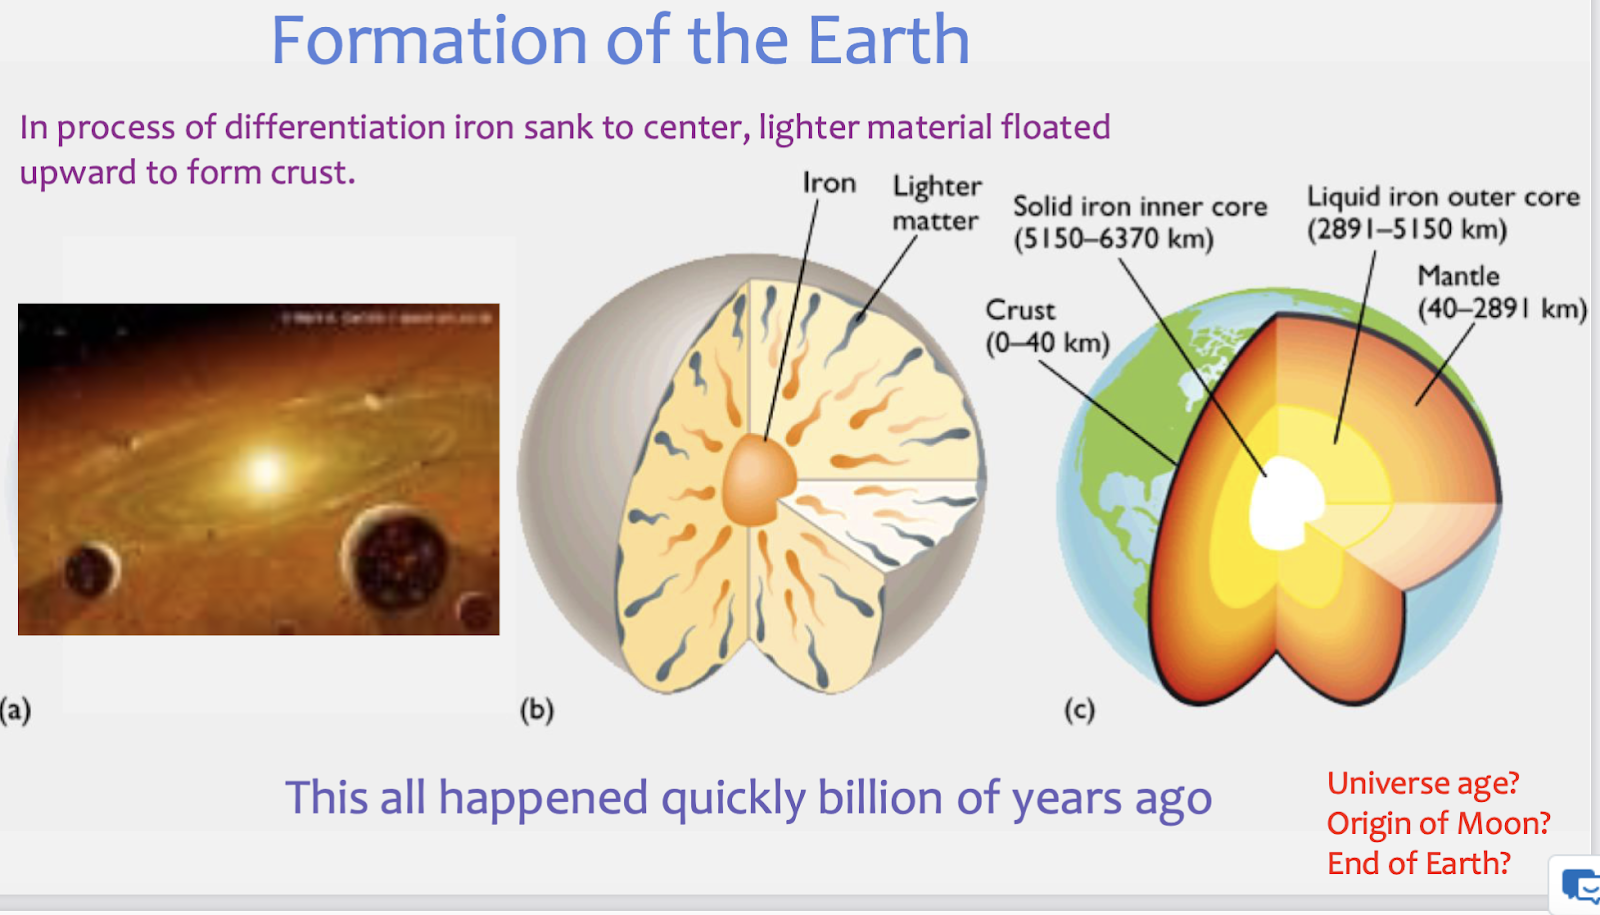
Formation of the Earth
In process of differentiation iron sank to center, lighter material floated upward to form crust
Earth’s history
15 Billion years (Ga), age of universe
4.5 Ga, age of solar system/earth
4.0 Ga, Mars size impactor→ Moon
3.9 Ga, small continents, Co2 atmosphere
2.5 Ga, large continents
Formation of the Moon
Giant impact
Formed spray, which gradually coalesced
Capture theory
Multiple impacts
Co-formation theory
Theories so far have fundamental problems
All happened about 4.5 billion years ago

What’s Interesting about the Earth?
Quantities we want to know
Motions, forces, stresses, viscosity, temperature, composition, history of planet, life
Quantities we can measure
P & S wave velocities (seismology), density (seismology and gravity), surface rock, geochemistry, plate motions (geodesy), magnetic field and its history
1/24
LA Fire cost
$250-275B
Previous record $200B hurricane Katrina in 2005
Worse than entire 2020 fire season
Might still go up
$35-45B of it is insured
Low fraction slows recovery
Federal aid depends on Trump (and Congress)
Liquids versus solids
Liquids flow: viscosity h resists
Solids deform: rigidity G resists
Maxwell characteristic time t=h/G
h is viscosity and G is elastic springiness
t = 10^-12 seconds for water
t = 10^6 years for Earth's crust
Time scale of deformation < t: solid
Time scale of deformation > t: liquid
Examples silly putty, salt-water taffy, glacier ice, tar
Isostasy: crust is less dense than mantle, like wood floating on water
Crust is thicker where land is and thinner where oceans are
That determines where our oceans are
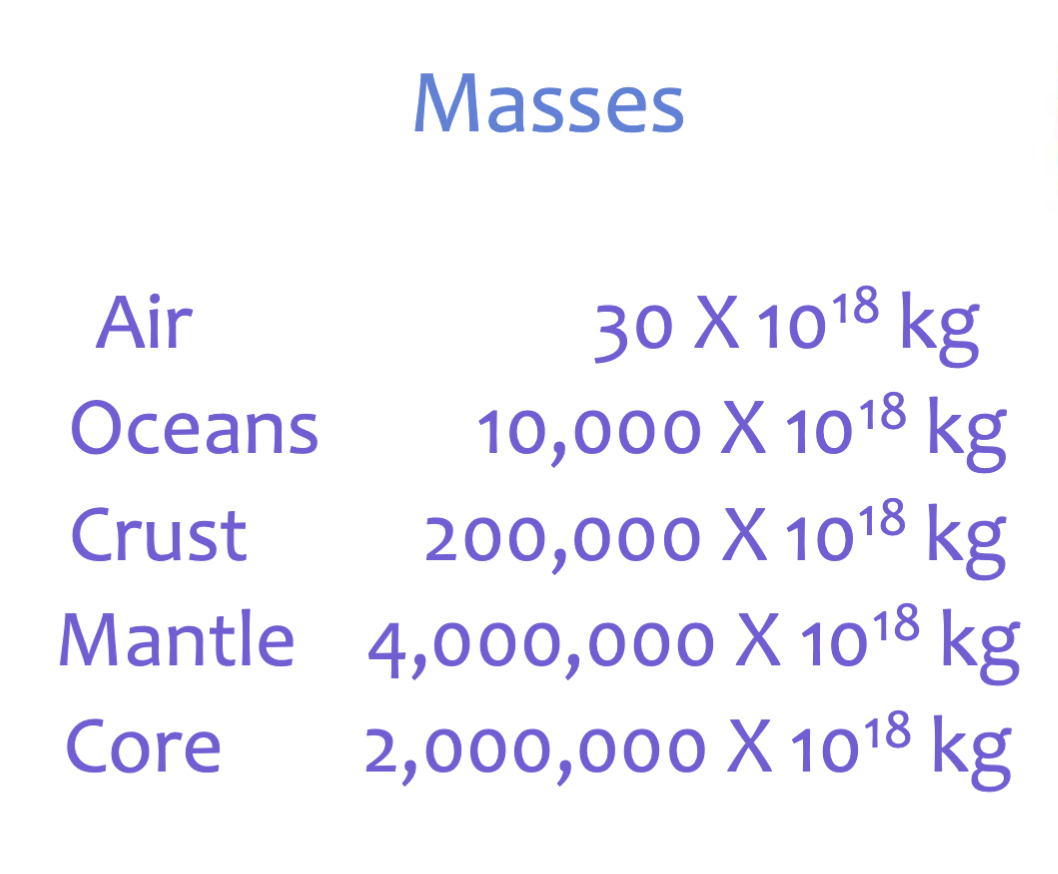
Composition
Crust
Oceanic
Continental
Mantle
Core
Fluid outer core
Solid inner core
Strength
Lithosphere
outermost rigid layer
Asthenosphere
weak layer below
Lithosphere
Mesosphere
lower strong layer
More central points
There are about 10-15 big plates
The boundaries between plates are faults
Earthquakes are essentially the plates moving past each other jerkily.
Three geometries where plates meet
Convergence
Divergence
Sideways (transform) motion
More points
Earthquakes on boundaries
Mostly shallower than 50 km depth
Deepest earthquakes ~700 km depth
Moves cm/yr, mantle 3000 km deep
Circuit takes ~ 1B years
π x 3x 10³ (km r) x 102 (cm/m) x 103 (m/km)
Pangea ~200 M years ago
Rhodinia ~ 1B years ago
More details in pre-lab reading
Lab exercise on magnetic stripes
“Solid” Earth system
Evolution of plate tectonics
Atmosphere and oceans
Rise of oxygen
Rise of life
Punctuated with big impacts
1/27
New study of heat deaths
Now, cold deaths > 10 X heat deaths
From now to 2100
Cold-related deaths are projected to fall
While those caused by extreme heat rise
2.3M extra deaths
Heat total will be 50% more than cold total
Affects elderly the most
Amplified by heat islands in cities
Mitigation actions are available
An Earth Timeline
Hadean
4.6 to 4 (Ga) Bya
Archean
4 to 2.5 Bya
Proterozoic
2.5 to 0.5 Bya
Paleozoic
500 to 250 Mya
Mesozoic
250 to 65 Mya
Cenozoic
Since 65 Mya
Elastic Rebound
A fault remains locked (by friction) while
Stress slowly accumulates
Gradually twisting the rock
Takes decades to centuries
Then it suddenly slips in an earthquake,
Releasing the stored-up stress,
Takes seconds to minutes
Energy is released
Surface that moved heats up
Vibration coming off produces sounds
Cracking of the rock, break the bonds
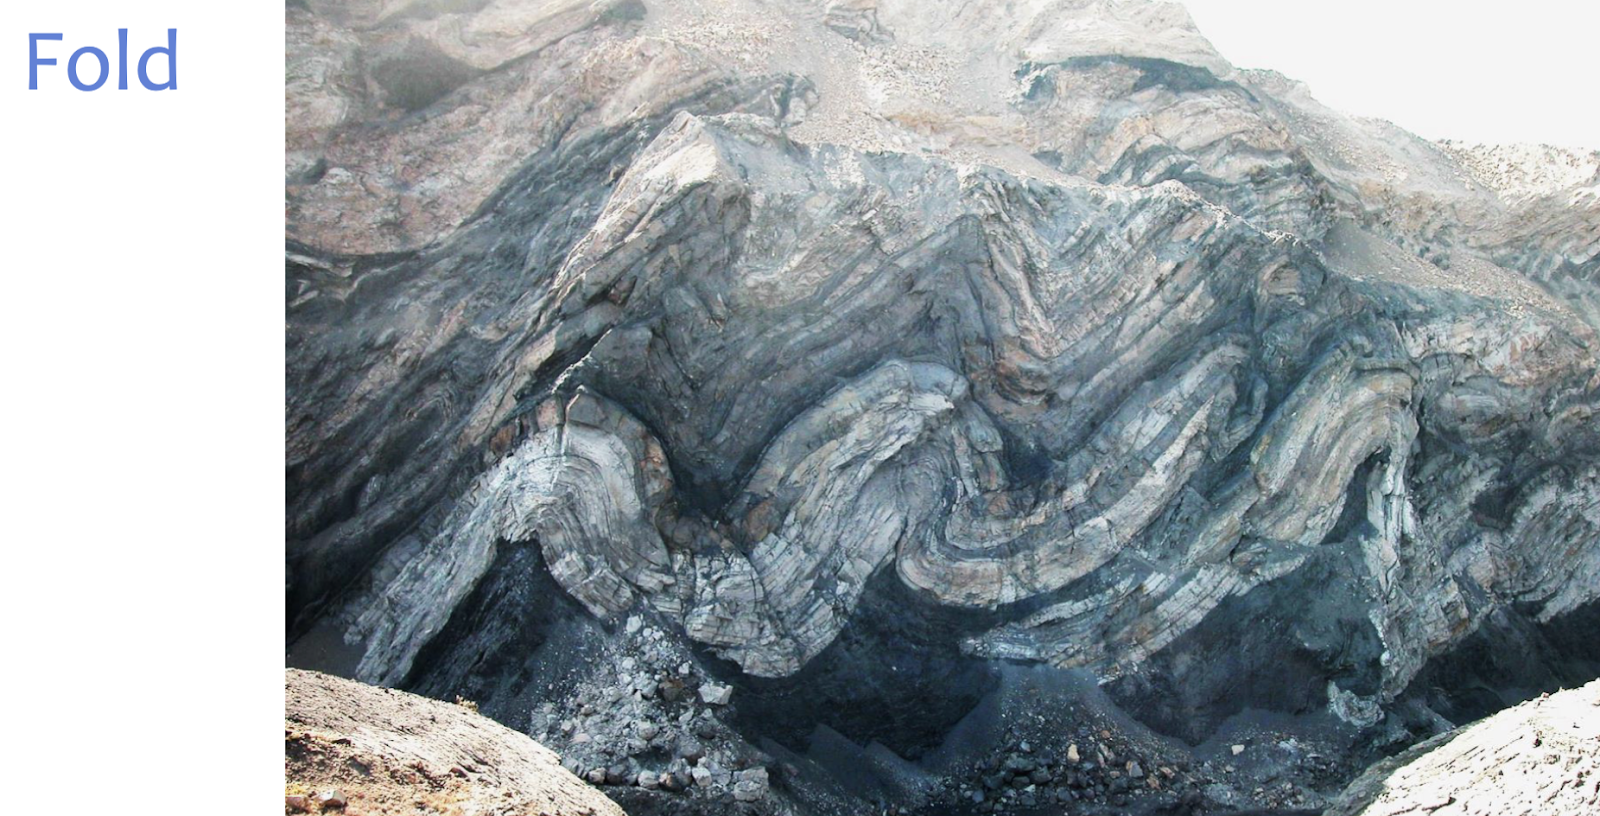
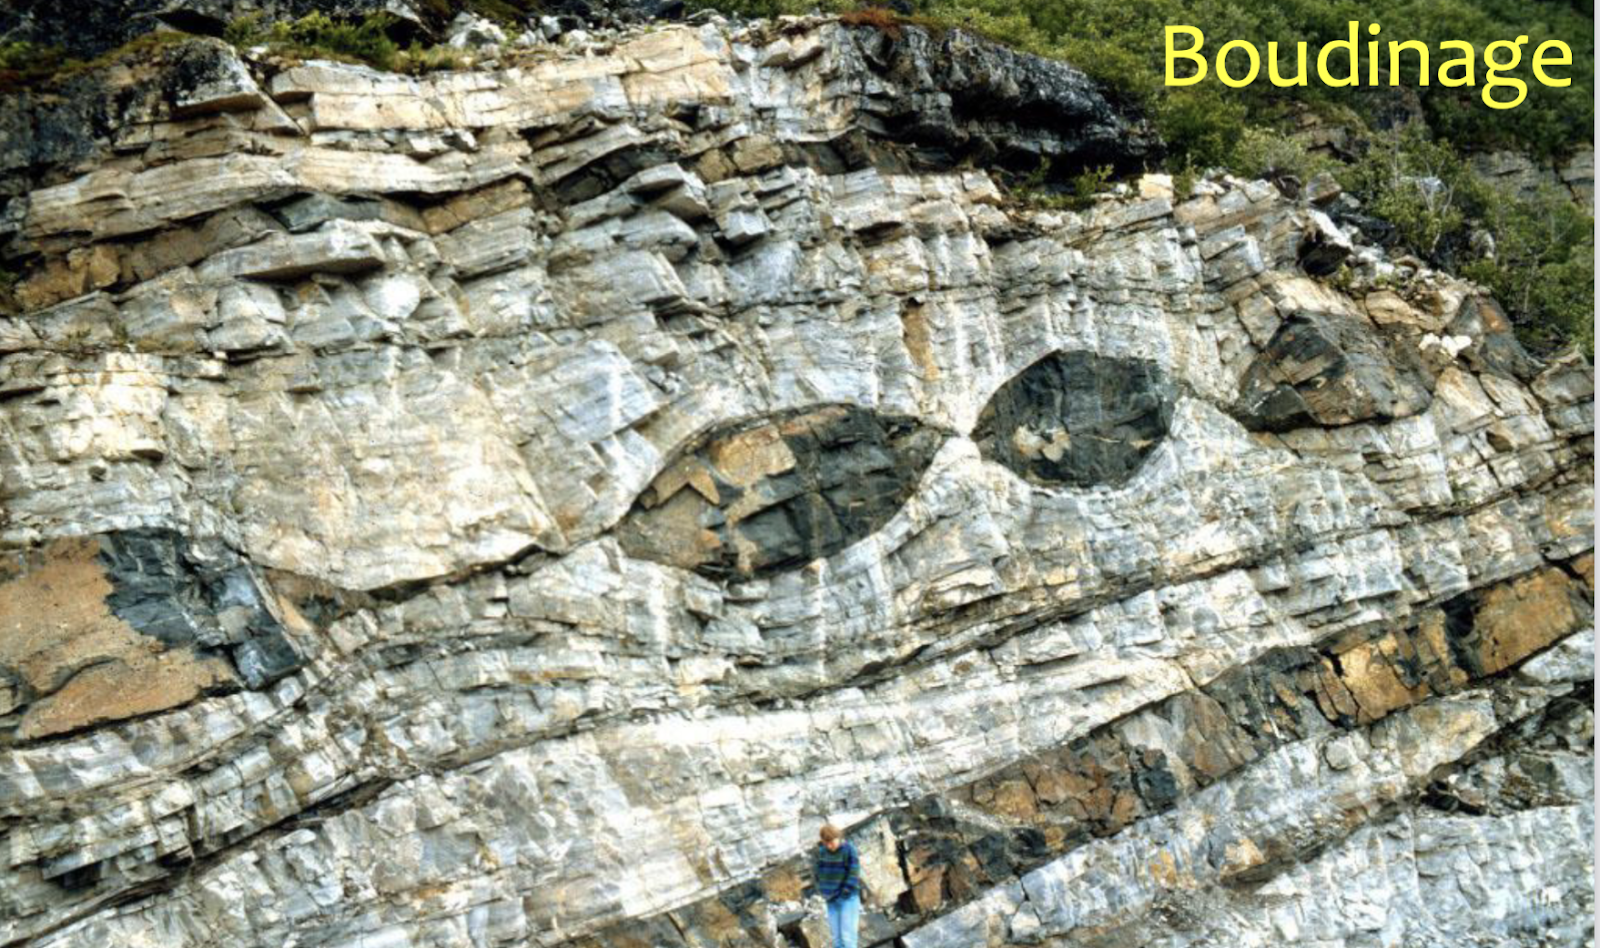
Ways to deform Rock
Ductile: folding, stretching and thinning
Brittle: faulting, often seismic
Types of Stress: Compressive features, tensional Features
Convergent Boundaries
Subduction zones- common, long lived
Continental or oceanic plate over oceanic plate
Explosive volcanism
Collision zones - shorter-lived (10 My)
Continental crust hits continental crust, leads to mountain building
Both sides are too buoyant to sink
Continental plate over Oceanic Plate
Plate boundary: site of largest earthquakes
Eg: Peru Chile Trench
Subduction
Elastic Rebound in a subduction zone
Asthenosphere: a semi-solid layer of Earth's upper mantle that's located below the lithosphere
Thrust Fault- convergence
Normal fault-divergence
Divergent Boundaries
Most frequently: mid-ocean ridges
Examples: mid-Atlantic ridge, many ridges under Pacific and Indian oceans
Less frequently: rift valleys on land
Will turn into mid-ocean ridges once old land has spread far enough apart
Mid-Ocean Ridge Spreading Centers
Plates move apart, new plate created
Normal faulting
Fewer and smaller earthquakes
Brittle only at shallow depths (0-5 km)
Far from civilization, little damage
Except in Iceland
Transform boundaries
One plate slides sideways past another plate
Mostly ocean-ocean contacts
Some continent-continent contacts (like San Andreas fault)
Least common boundary, usually vertical
Transform fault-contact between two plates that slide horizontally past one another, commonly connecting two mid-ocean ridges
1/29
San Andreas accumulation
Wee see strain accumulate with GPS
Global Positioning System
Steady strain rate over several centuries
Distributed across zone about 100 km wide
Only top 20 km of fault are brittle and locked
Deeper rocks flow due to higher temp
Earthquake prediction
If build up of strain is steady and featureless, there may be no clues of coming quakes
Terms and Concepts
Formation of Earth
Earth layering
Convective motor of plate tectonics
Cause of topography
Three types of boundaries
Geodesy vs Seismology
Somewhat separate issues
Geodesists study slow motions
Seismologists study fast motions
Geodesy (GPS, LIDAR, InSAR)
Geodesy is better for longer periods, permanent.
Position to 1cm, maybe 1mm
Seismology (seismometers)
Acceleration down to ground noise
Seismometers better for vibrations
100(1000)-s period and faster
GPS Constellation
31 satellites
20,000 km up,
12 hours orbits,
Broadcast a signal back to Earth,
Takes at least 4 to determine location,
Usually 6 or more
Accurate to about 1mm, 2mm vertically
Selective availability:
Intentional errors,
10m horizontally,
30m vertical,
For navigation:
Turned off in 2000
GPS (Global Positioning Satellite)
Now “GNSS”
Global Navigation Satellite System
We can watch the plates move
Guides cars, watches, kids’ phones
Originally guided (and still guides) cruise missiles
InSAR
Interferometric synthetic aperture radar
Dedicated satellite
Sends out millions of signals
Then listens for each echo
Scans the ground with 100m square pixels
1/31
Geodesy shows grounds movement
We can see how ground shifted in earthquakes (Pishan, China, 2015)
How faults break
Rupture begins, at a place on fault where stress has exceeded strength
Crack spreads outward over planar fault surface from focus
2-3 km/sec (near shear-wave velocity)
Rupture means sliding, releasing tectonic motion
Larger area implies larger magnitude and longer duration of rupture
Energy released from cracking and sliding travels outward
These vibrations are felt and cause damage
Only a small amount of damage is caused by offset of the fault
Vocabulary
Focus - point where the rupture started (3 numbers)
Hypocenter - location (same as focus) plus the time of quake beginning (4 number)
Epicenter - surface projection of hypocenter (2 numbers)
Rupture - sliding of one side of the fault against the other
Trace - surface line of fault
Scarp - slope at the trace of thrust or normal fault
Vocabulary
No dominant pattern as to where hypocenter is on the fault plane
Generally, only part of a fault ruptures in each quake
Usually, big faults have been recognized beforehand
Many earthquakes do not break up to the surface
Sometimes several cracks with different orientations break at once in a single earthquake
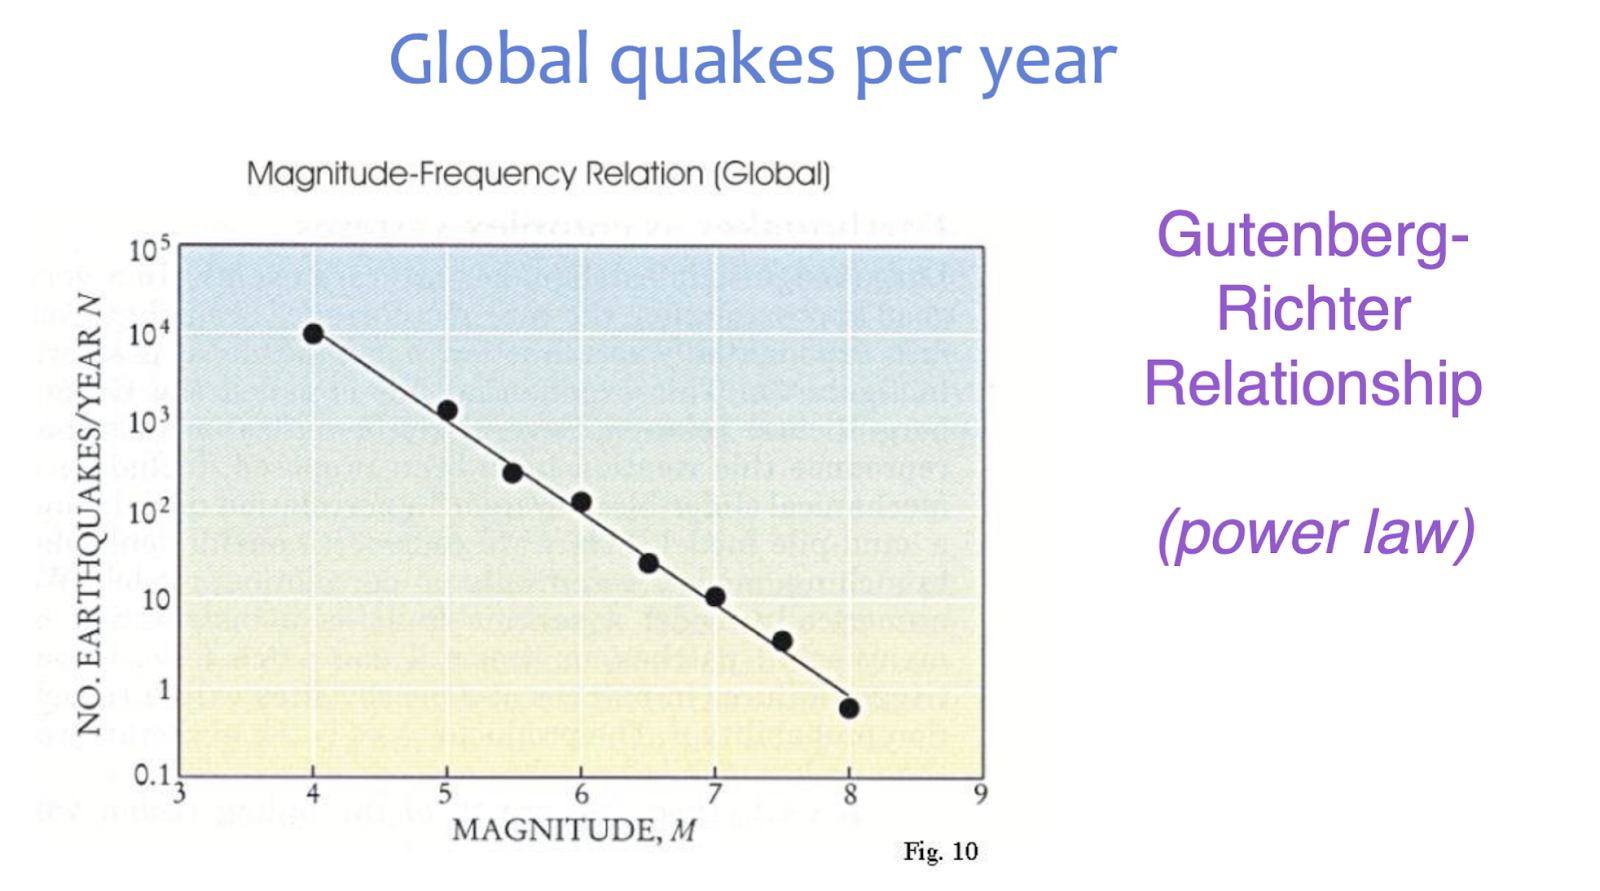
Magnitude scales
Richter magnitude scale
Logarithmic scale based on the maximum amplitude of ground motion, recorded on a standard seismograph, correcting for the distance to the source
ML = log10 (amplitude of seismograph) + distance correction
Mercalli intensity scale
Rates quakes by how it feels
Seismic moment magnitude scale
Depends on the rupture area. Provides better estimate of earthquake size for big earthquakes than the amplitudes recorded on a seismograph
Definition of Seismic Moment
M0 = μ D S where
μ is the rigidity of the rock
D is the amount of slip (offset,
dislocation) between the two sides of the fault
S is the surface area that ruptured
Units are force times length
Newton-meters, dyne-cm
Varies over many orders of magnitude
(Moment Magnitude)
MW = 2/3(log M0) - 6.0
where M0 is seismic moment in Newton-meters
Is now replacing other magnitude scales, such as
Richter magnitude or surface wave magnitude.
Provides a consistent measure of size of earthquakes from the smallest microearthquakes to the greatest earthquakes ever recorded
Magnitude vs fault rupture sizes
Magnitude 8 = 500 km
Magnitude 7 = 70 km
Magnitude 6 = 10 km
Magnitude 5 = 1.5 km
Magnitude 4 = 300 m
Magnitude 3 = 100 m
Magnitude 2 = 20 m
More factoids
Largest amount of slip is generally near the middle of the fault rupture plane
Near the edges, there is less slip
Slip is generally in the same direction across the entire fault rupture plane
(Not always.)
Fault planes do not open or close much,
the two sides just slip sideways.
A point on the fault plane slips at a fairly constant rate
around ~1 meter per second
What is a wave?
A wave is a disturbance that travels far through a medium while particles of the medium move only a small distance back and forth, and do not experience much net translation
Science vs popular usage
Eg: ripples on a pond, the wave at sports events
Seismic wave radiation
Radiation- waves that travel carry energy outward
Eg
Light energy from space heater
Water waves from a splash, few m/sec
Sound waves from a speaker, 300 m/sec
Seismic waves (motions) are just vibrations of the ground, as sound waves are vibrations of the air
Generation of seismic waves
P waves
Longitudinal, material moves back and forth (vibrates) in same direction that wave travels
Produces compression/dilation cycle
Fastest type of wave, so arrives first
Termed Primary or P wave
Typical velocities in crust: 5-7 km/sec
Travels through solids, fluids, or gas
Not vacuum, nothing to vibrate
S waves
Shearing, material moves back and forth perpendicular to the direction
The wave travels in a twisting motion
Slower than P wave, arrives second
Termed secondary wave
Typical velocities in crust: 3-5 km/sec
P waves travel 5-7 km/s
Travels through solids, but not fluids
Because there is no restoring force for the perpendicular motions
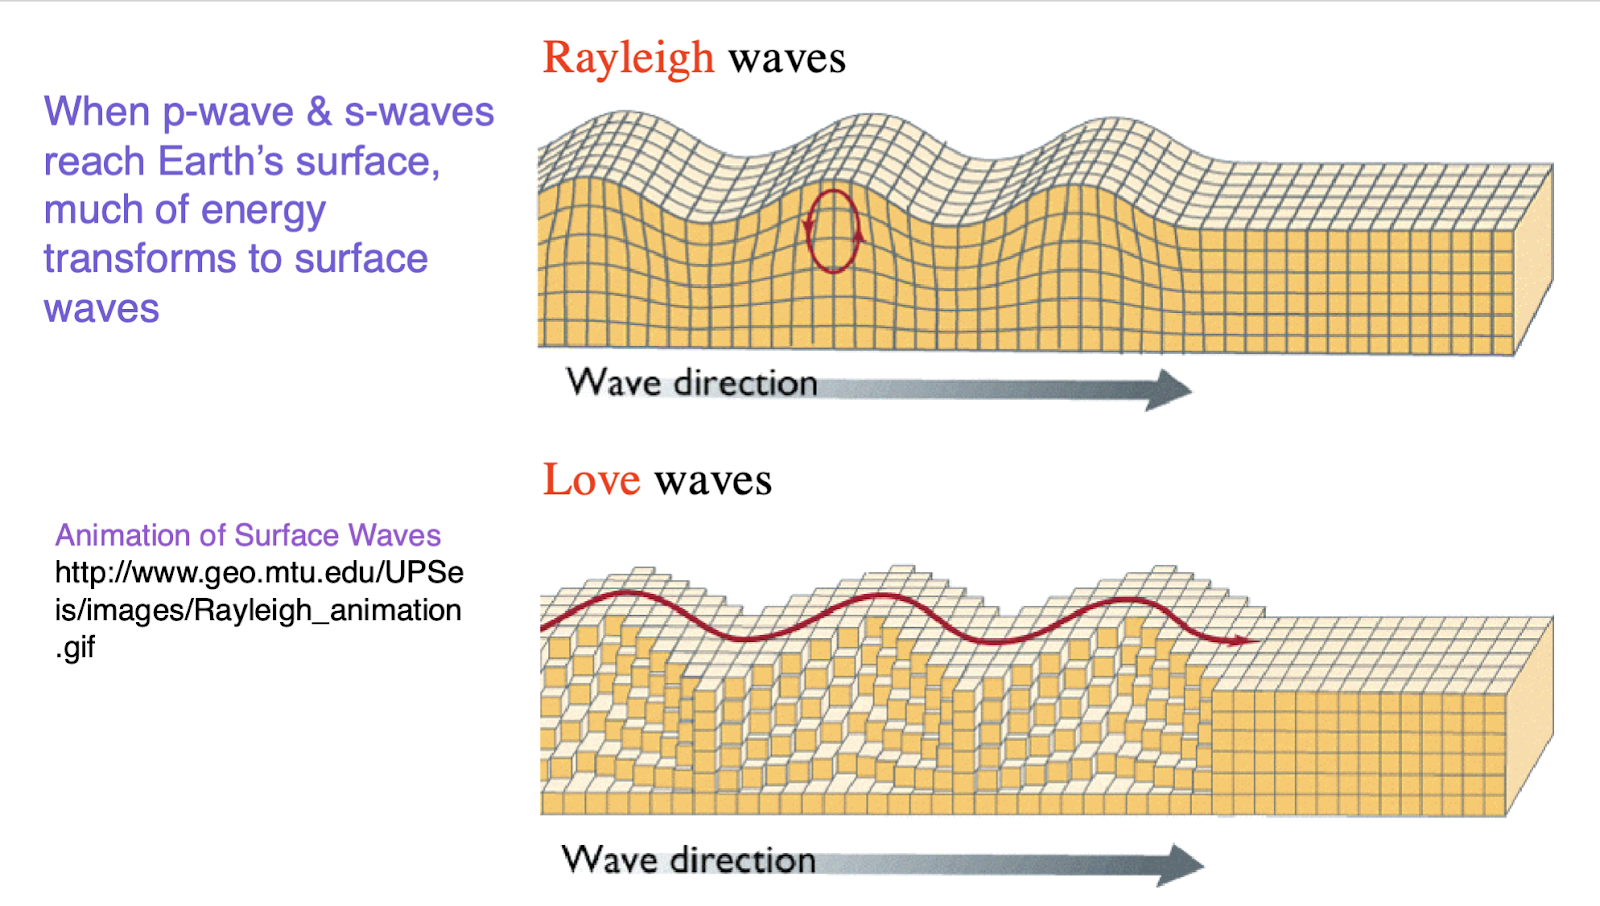
Surface waves, these do the most damage
Raleigh waves
Love waves
Ruptures are moving sources
Cracks spread along fault at 2-3 km/s
Remember that “particle motion” is just ~1 m/sec, factor of 103 slower
Vibrations travel through rock at slightly faster speeds
Speed depends on wave type
Some directions from earthquake receive more energetic shaking than other directions
Different “radiation” patterns for P waves, S waves, Love waves, and Rayleigh waves
Where is energy?
In waves, energy has two forms
Strain or deformation - like the energy stored by deforming a spring - 1/2 kx2
Motion or vibration - kinetic energy in physics - 1/2 mv2
Vibration is the most damaging, but either kind of energy can cause damage
Amplitude of seismic waves
Amplitude is strength of shaking
Depends on magnitude
Determines amount of damage, w/ duration
Amplitude decreases with distance from the earthquake
energy spreading out over larger area
P wave smallest
3-6 km/s
S waves larger
1-4 km/s
Surface waves largest
0.5 – 2 km/s
2/3
Seismometer design
Essentials
A heavy weight
A way to record the motion of the weight
A spring to keep the weight away from the sides
A pivot so weight only moves in one direction
Luxuries
Electronics to extend frequency response
Far from sources of noise
An airtight box
A firm anchor for the seismometer
Burial for quiet surroundings, far from ocean and wind
Milne-Shaw seismometer
One of first seismometers, globally distributed in 1890s
Data recovery
Driving to recording site
Still often used
Telephone lines
Bad during large quakes
Microwave transmission
Satellite phone
Internet
Cell modern
Modern portable seismic motion
Buried seismometer with a wire to a computer with a big hard drive, plus batteries and a big solar panel
OBS, Ocean Bottom Seismometers
Better coverage of Earth’s surface
Very expensive
Hard to emplace
Can’t transit signals back
Science targets
Oceanic volcanoes
Hot spots
Subduction zones
Detection of nuclear explosions
Refraction- object in water, rays kink
Because the waves travel at different velocities
As waves radiate outward from the earthquake, through the Earth, they separate into a predictable pattern with
P waves arriving first, then S waves, then surface waves
P wave serves as a warning to take cover or shut down critical facilities
Warning ranges from a few to 100 seconds
Get 1-3 s of warning for each 10 km in distance
Epic SCEC simulations
Nearly worst case for Los Angeles
Run on large supercomputer
4x real time
Basis for Shakeout, statewide exercise for preparedness
Important Terms and Concepts
How GPS, InSAR, and LIDAR work
Use for plate tectonics, earthquakes, & volcanoes
Seismic wave speed vs earthquake rupture velocity
Concept of a wave
Meaning of moment and magnitude
Seismometer principles
P, S, and surface wave properties
Wave reflection and refraction
2/5
Santorini alarm
Accelerating swarm of earthquakes
Mainly in last week
Up to M5s
Near famous supervolcano
Not that dangerous
Moving away from volcano
1/20 chance of a bigger quake after every earthquake
For a swarm, just sum over all quakes
Change of an M7 not so large, wouldn’t be that damaging
Probably either
Magma moving underground
Or water percolating underground
“Slow slip” progressing along fault
3 levels of predictability
Time Independent Hazard
Earthquakes are a random process in time
The recent past doesn’t matter
Except to set long-term earthquake rates
Such calculations can be used in
Building design and and planning of land use
For the estimation of earthquake insurance
Time Dependent Hazard
Include a degree of predictability in the process
The seismic hazard varies with time
Perhaps the hazard increases with passing time after the last event
characteristic
Or seismic hazard instead decreases with time
Due to the tendency of earthquakes to cluster in space and time
Aka Earthquake forecasting
We predict risk of an impending earthquakes on a time scale of minutes to years
The forecast is probabilistic
Relevant authorities might prepare for an impending event weeks to months ahead of time
Practical roadblocks include
Identifying reliable precursors
The likelihood of missed events or false alarms, involving changes in behavior for up to several months, resulting in a loss of public confidence
Deterministic prediction
Earthquakes are inherently predictable
We reliably know in advance
Their location (latitude, longitude and depth),
Magnitude, and
Time of occurrence
Benefits
Planned evacuations,
Machines in safe positions, and
Prepped for recovery
Probability
How often you expect something to happen
Example - flipping a coin lands on heads 50% of the time
Reported as percent (50%), decimal (0.5) or fraction (1/2)
Must be between 0% and 100%
We may say for an M>7 in the next 30 years
80% probability
4 out of 5 chance
0.8, and it matters which
And we can’t repeat the game
Or even easily check how well it’s working.
Hazard and Risk
Hazard – probability that an area will be shaken
Risk – Probability of a loss
Hazard is what seismologists predict
Includes earthquake probability
Risk is what insurance companies, the government, etc. need to know.
Risk = hazard vulnerability value
Seismic Hazard
I - Estimate future long-term seismicity rate from
Use past locations of felt earthquakes,
Fault locations and geological recurrence times
And deformation rates
II - Calculate ground-shaking probability
From source-magnitude probability and
Path and site effects
Such calculations can be used in
Building design and planning of land use
For the estimation of earthquake insurance.
Remember uncertainty!
Probability of damage
Find the faults
Find faults' segmentation
Find segment properties
Magnitude
Recurrence interval
Sum up motions from all segments of all faults
Hazard
Then figure out expected
Damage
Risk
Fault Zone Segmentation
Characteristic quake model
Only one segment breaks at a time
Segments defined by
Ends of fault traces
Fault intersections?
Changes in rock type along fault?
Best guesses - segment defined from prior quakes.
Not clear whether the concept of fault segmentation is accurate or useful.
History of Wasatch Fault Segments
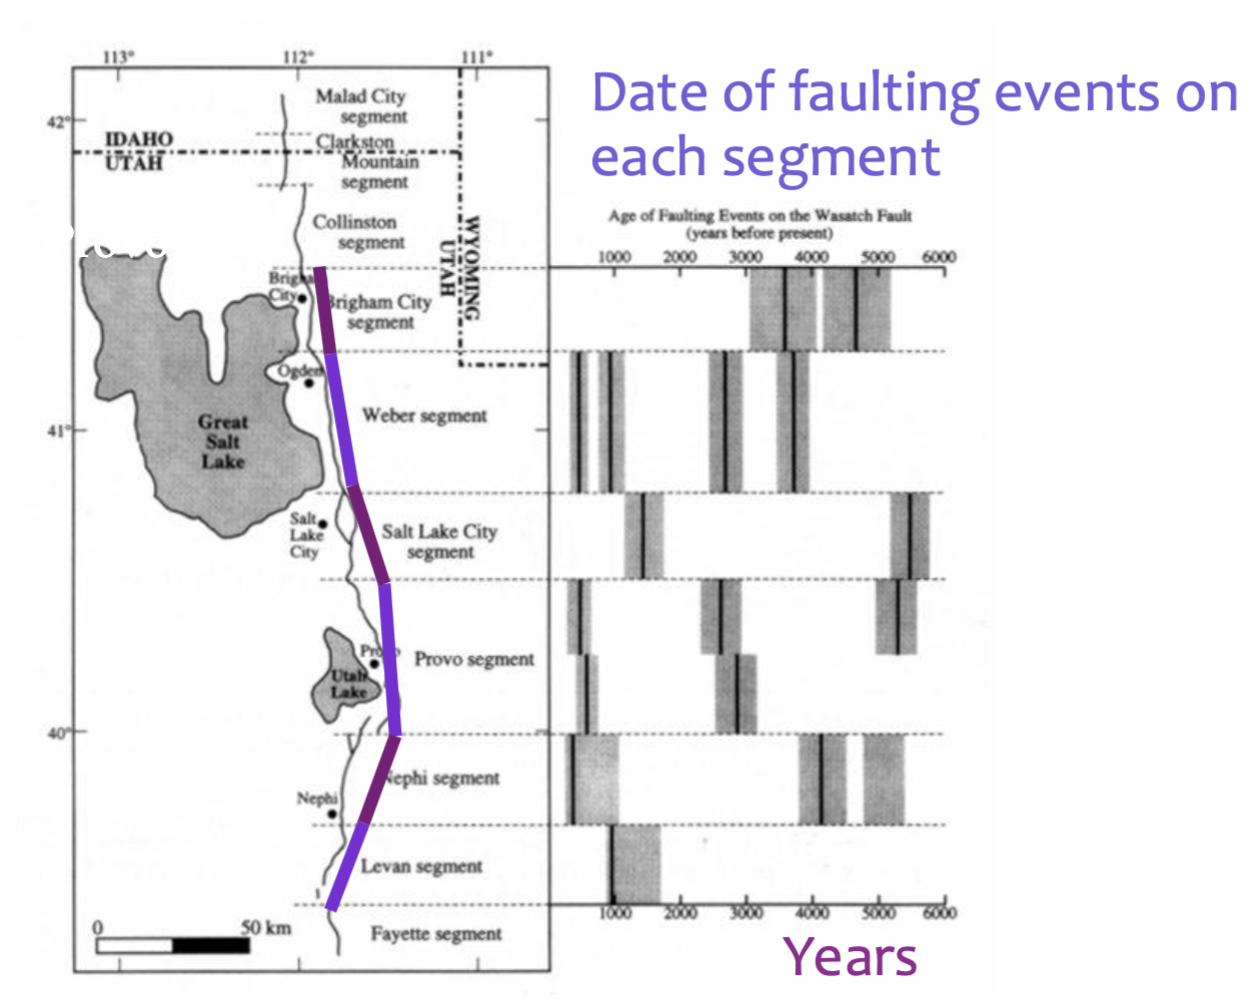
From this history
10 events in 1300 years
An event every 130 years, on average
About 25% chance in next 30 years
(that’s 30 years / 130 year repeat time)
But we know the history
So another guess would be
Last event 167 years ago
They’re overdue!
But events are not regularly timed
Clustering model?
Consensus of experts
New Zealand example, the “Cooke method”
2017, NZ government gave us a test
Weighted our forecasts by how high we scored
Gave us the NZ facts to assess
Then announced earthquake danger as estimated by experts
Cost Benefit Analysis
Benefit-cost ratio:
Calculate annual benefits
Multiply by lifetime
Calculate projected cost of special earthquake construction
Take ratio to get benefit/cost ratio
Would it be better to spend money on new schools, hospitals, etc.
Or not spend it at all
(i.e., cheapskates WA & OR)
Definitions
Sequence: Set of quakes that are related
Foreshock: Quake followed by a bigger quake in same sequence
Mainshock: Biggest quake in a sequence
Aftershock: Quake after the biggest quake in a sequence
Corollaries: One never knows that an event is a foreshock until the
mainshock comes along
Aftershocks can turn into foreshocks
Difference between mainshocks, foreshocks, and aftershocks
Little to None
Mainshocks
Largest magnitude earthquake in a sequence
Larger mainshocks
Longer fault
Longer duration of rupture
Bigger peak slip
Bigger strain larger volume of rock
Have more aftershocks
2/7
Forecasting and Prediction
Prediction framework
Earthquake statistics
The right way to forecast
And arguing with Russians
And others
NSF Cuts?
Foreshocks
Smaller earthquakes that precede the mainshock
Often by just hours
Few in number
Only half of mainshocks have even one foreshock
Near mainshock hypocenter
Part of the nucleation process
Equal chance of M1, 2,3…
Aftershocks
Smaller earthquakes soon following the largest earthquake of a sequence (the mainshock) near mainshock rupture zone
Follow almost all shallow earthquakes
Cover ruptured area
Can number in thousands
Can last for years or decades
The most predictable (and well-studied) earthquakes
Cause of aftershocks?
Every time there is an earthquake,the volume of rock around the rupture is strained, that is, twisted or squeezed
Sometimes, the strained rock breaks
Often, it takes a while for it to break, so the aftershocks may appear seconds to years after causative quake
But we don’t know for sure why there is a delay
Cracks growing
Viscous rocks slowly flowing
Fluids percolating
1989 M6.9 Loma Prieta example
40-50 km long thrust rupture
On San Andreas?
Extends to 12 km depth
Slightly dipping to southwest
Focus near middle of bottom of rupture
Two M 5 foreshocks 6 months earlier
Very near focus, “prediction”
Aftershocks
Fill rupture zone
Distribution of sizes
Like for mainshocks, there are many more small aftershocks in a sequence than big aftershocks
If mainshock has M 6
1 or 2 aftershocks with M 5 to 6
10’s of M 4 to 5
If mainshock has M 8, an M 7 aftershock is likely
Omori’s Earthquake
The decay of aftershock activity following the 1891 Nobi, Japan, earthquake... for over 100 years!
To make an earthquake prediction need to state:
Time interval in which quake will occur
Region in which quake will occur
Magnitude range of predicted quake
Small quakes occur more commonly
Easy to predict there will be magnitude 3 somewhere in SoCal next month, but not useful
Possible precursors
Change (increase or decrease) in number of earthquakes
For example, foreshocks
Difficult to distinguish such changes from random variations
Ground uplift or tilt
Radon emission
Electrical resistivity
Seismic wave velocity
Clustering of seismicity
Whenever there’s a quake, it becomes more likely that more quakes will come soon
5% chance that any quake will be followed by a bigger quake in a week
With passing time (and no quake) , odds return to normal
1997 - Quake panel admits prediction is difficult
The leaders of the program have always maintained that prediction of the Tokai earthquake is possible
The M8 Tonankai earthquake that occurred in the same region in 1944 showed “clear precursors” that could have acted as a warning.
The Japanese government has approved a report by seismologists that clearly admits for the first time that earthquake prediction is difficult
China discouraging predictions
Unofficial earthquake warnings
30 in the last 3 years
Brought factories and business to a halt
None has been accurate
New law
Requires high standard of scientific reasoning
Or else predictors will be penalized
Being enforced with latest earthquake
9/29/16 L.A. Earthquake Advisory
USGS monitors seismicity
USGS issues warnings
No other entity!
Many wacky predictions
1/12/99: “The world has been void of M6 quakes for too long. Expect an M6 or larger in China or New Zealand.”
•1/27/99: “Well, the M6 hit in Columbia, not in China, and unfortunately in a populated area.
Damage is severe.”
Douglas Ian McKenzie
Physics degree at Sonoma State University, mechanical engineer
Complained to my Chair about class web page on prediction
Real Predictions
Parkfield seemed to repeat every 22 years
Was supposed to happen in 1989 or so
Lots of equipment put out in 1980s
Broke in 1857, 1881, 1901, 1922, 1934, 1966?
We finally got the quake Sept 2004
Last week someone mentioned it’s due again.
Or were those really similar events?
(Easy to misinterpret spurious patterns)
Still today
Friedmann Freud at “NASA”
Tricked Nature in 2014 news article
Rocks spark and heat and charge before quakes!
Only he knows “physics”
Earthquake lights
Warm ground
Animal anomalies
Good scientist in his field
GEOCOSMO REAL EARLY WARNING SYSTEM
Provides 2 to 3 days lead time before any major earthquake
Satellites on geostationary and low-Earth orbits
Regional ground station networks and other ground assets
Monitors the range of signals that the Earth produces when stresses build up deep below to dangerously high levels, heralding an increased probability of a major seismic event
Never again a major earthquake will strike “out of the blue”
Occasional false positives have to be accepted
Disappeared in 2023!
Vladimir Keilis-Borok
Invented complicated but sensible method
Claimed it was 5-10 times more powerful that it really was
Kept changing parameters so it retroactively worked better
Very distinguished scientist
Member of 7 National Academies
Came with references from a Nobel Prize winner
Played major role in nuclear weapons treaty negotiations
I suggested he put out a press release documenting his results
It mentioned an ongoing prediction for LA
50% chance of M > 6.4 in 9 months
Really more like 5%, included desert to the east
The press ran with it
Luckily, it didn’t happen
After prediction failed
KB claimed forecast had only a claimed chance of 50%
Subsequent predictions pushed successes down to a random rate for the next 18 forecasts, with zero successes
Seemed completely useless
Further analysis suggests a success rate 2-4 times random guesses
More powerful than guesses, but much less than 50% success.
KB passed away in 2013
His collaborators continued and attacked others’ forecasts.
Some important terms and concepts
Three levels of forecasting and predictability
Hazard vs risk
Process for estimating seismic hazard
Expert consensus
Foreshock, mainshock, aftershock
Three prediction requirements
Only precursor so far – seismicity clustering
Past and current skepticism of prediction among experts
2/10
California Earthquake Awareness
Historical Earthquakes and Seismology
Moderate earthquakes have occurred in Massachusetts, impacting brick chimneys and stone walls without causing recorded deaths.
Early earthquake investigations led to the establishment of geological surveys and societies, and the introduction of geology courses in colleges.
Robert Mallet, an Irish engineer in the 1850s, was a key figure in early seismological research. He is considered the "father of seismology". Mallet compiled historical earthquake catalogues and created maps showing areas disturbed by earthquakes.
John Trask compiled annual earthquake lists published in the proceedings of the new California Academy of Sciences from 1856 to 1865.
John Branner implemented a corps of observers who noted the time and intensity of earthquake shocks, sending these notes to the compiler with minimal delay. Branner started a "felt" catalog in 1916.
The 1906 San Francisco earthquake led to advancements in science but also a cover-up of the danger.
General Overview
The presentation covers earthquake science and policy.
It includes an introduction to natural hazards and how earthquakes work.
It aims to increase California earthquake awareness and discuss earthquake early warning systems.
Historical Earthquakes and Seismology
Moderate earthquakes have occurred in Massachusetts, impacting brick chimneys and stone walls without causing recorded deaths.
Early earthquake investigations led to the establishment of geological surveys and societies, and the introduction of geology courses in colleges.
Robert Mallet, an Irish engineer in the 1850s, was a key figure in early seismological research. He is considered the "father of seismology". Mallet compiled historical earthquake catalogues and created maps showing areas disturbed by earthquakes.
John Trask compiled annual earthquake lists published in the proceedings of the new California Academy of Sciences from 1856 to 1865.
John Branner implemented a corps of observers who noted the time and intensity of earthquake shocks, sending these notes to the compiler with minimal delay. Branner started a "felt" catalog in 1916.
The 1906 San Francisco earthquake** led to advancements in science but also a cover-up of the danger.
Mitigation and Preparedness
Progressivism- among scientists and engineers in California's history has influenced approaches to hazard mitigation.
People prepare for future earthquakes by constructing sound buildings and developing contingency plans.
Following the 1906 San Francisco earthquake, efforts were devoted to mapping the state’s earthquake risks and urging improved construction methods.
A committee recommended a network of seismometers reporting to a central bureau to improve seismographs and a group of cooperating observers to report quake information to create a catalogue of earthquakes on the Pacific Coast.
After the San Fernando earthquake, engineers strengthened building codes without extensive lobbying.
The Politics of Hazard Mitigation
Some Californians viewed destruction by earthquakes as inevitable and unalterable, favoring "dogged persistence and denial" as a response.
Following the 1906 earthquake, Mayor Eugene Schmitz and others downplayed the disaster to avoid scaring off financing for rebuilding the city.
In the mid-1920s, Bailey Willis gave speeches, newspaper interviews, and cultivated allies to convince engineers, architects, businessmen, and the general public of the need for a concerted public relations campaign.
After the 1925 Santa Barbara earthquake, the Chamber of Commerce sent pictures showing minimal damage, and a group of bankers telegraphed eastern cities emphasizing that reconstruction did not require assistance from non-Californians.
Robert T. Hill was offered money to write a formal brief to counteract Willis’s prediction.
A major Caltech donor threatened to cut off funding for earthquake research, leading to a reluctance to publicize warnings.
Earthquake Prediction Efforts
In 1905, Akitsune Imamura predicted Tokyo would suffer a great earthquake, but Omori denounced this prediction.
The Ad Hoc Panel on Earthquake Prediction reported to the President’s Science Advisory Committee in 1965.
By 1970, most agreed that the sections of the San Andreas Fault that had ruptured in 1857 and in 1906 posed the greatest hazard for the future.
Louis Pakiser of the U.S. Geological Survey asserted that experts would be able to predict earthquakes within five years if research funds were forthcoming.
In January 1974, Jim Whitcomb (Caltech) predicted that a magnitude 5.5 earthquake would strike near Riverside in early 1974. There was indeed a strike-slip earthquake just east of Riverside on January 30, albeit only of magnitude 4.1.
In 1975, the Chinese successfully predicted the Haicheng earthquake.
In April 1977, Caltech’s Whitcomb predicted an earthquake of magnitude 5.5 to 6.5 in the Los Angeles basin within the next twelve months.
The Palmdale Bulge, an uplift along a segment of the San Andreas Fault, raised concerns and led to increased calls for prediction research funding.
On July 28, 1976, a magnitude 7.6 earthquake hit the Chinese city of Tangshan without any effective warning.
By 1979, most of the Palmdale bulge had deflated without a great earthquake.
The 1979 magnitude 5.7 Coyote Lake earthquake struck within the most heavily instrumented portion of the San Andreas fault zone, but no anomalies were found in the data recorded before the earthquake.
Building Codes and Safety Measures
The 1933 Long Beach earthquake led to the Field Act and local building codes with earthquake provisions, increasing the earthquake resistance of California’s building stock, especially schools.
The state geologist delineates a zone centered on active faults to limit building. Any fault showing movement within the past 11,000 years is deemed active, with construction restrictions within 50 feet.
Funding and Research
Earthquake engineering and seismology came to depend on funding from military agencies and the National Science Foundation.
From 1958 to 1961, federal support for seismology jumped sixtyfold, from $500,000 to $30,000,000.
In the mid-1970s, budget cuts targeted earthquake research.
More Recent Events
More recent events in 1971, 1989, 1994, and 2014 near California cities have fine-tuned problems and fixes.
The 1994 Northridge earthquake (MW = 6.7) caused $40-50 billion in damage and occurred on a previously unknown fault.
The 2014 South Napa quake (M = 6.0) caused many injuries, no deaths, and an estimated $300M in damage.
Important Terms and Concepts
Cause of earthquakes unknown until ~1900
Initial efforts constructed catalogs with observers
1906 San Francisco event- science advanced, cover-up of danger
1923 Tokyo earthquake- great disaster
Bailey Willis and 1933 Long Beach- teaching danger to Californians
Nuclear weapons and power plants– new uses for seismology
1970s efforts at prediction- spawned research but few predictions
More recent events in 1971, 1989, 1994, 2014 near California cities fine-tuned problems and fixes
2/12
3 M3.5 Quakes on the San Andreas
21 concentrated events total
5-8 km depth, probably more compact
0.5 km spread in map view
2 of M3s on 10th, 1 on 11th
Scares people
But 5% chance rules says
Tiny chance of danger > M5
If GPS moves, then worry

Likely damage pattern
Fire was the biggest problem
Water mains broken
Burned for 3 days
Stopped by dynamited fire breaks
Caused some new building codes
Seismological Society of America
Distrusted seismometers for locating faults
John Branner implemented a corps of observers
Branner started “felt” catalog in 1916
Harry O. Wood built seismometers
Bailey Willis worked with Wood to map the faults of CA issued in 1923
Robert T Hill was best known for work on geology and petroleum resources in Texas
Tokyo 1923
M7.9
Great Kanto earthquake
World’s 3rd largest city
143,000 killed
600,000 houses destroyed
1925 Santa Barbara Earthquake
On June 29, 1925, an M6.8 earthquake
Numerous brick and reinforced concrete structures in the central business district were destroyed
12 people killed and scores more injured
Crumbling buildings
Santa Barbara quake response
Chamber of Commerce sent more than a thousand pictures via air mail to newspapers nationwide ostensibly showing that damage had been minimal.
The president of a group of bankers also sent telegrams to about 20 eastern cities emphasizing that reconstruction did not require assistance from non-Californians.
The San Francisco Chronicle stated that Maine and New York were as much subject to earthquakes as California and that no place could claim to be safe from natural calamities.
1927 Lompoc earthquake
Nov 4, M7 earthquake
Landslides, railroad disruption
2m tsunami
Killed or stunned many fish
Not far from current Diablo Canyon nuclear power plant
Insurance companies awaken
The cost of earthquake insurance increased 5-10 fold after the Santa Barbara earthquake
A survey showed that most buildings in CA were not earthquake resistant
Progress in early 1930s
Rugged instruments capable of recording even the strongest motions were developed
45 strong motion seismographs installed across the state
Several earthquake recorded in these years showed spikes of motion in which accelerations exceeded 0.10g
Initiation of work on the Uniform Building Code for CA
1933 Long Beach Quake
M6.4 on Charles Richter’s new earthquake scale struck near Long Beach
120 deaths
At least $40 million in property damage
Improvements post-1933
The Field Act and the numerous local building codes that now included earthquake provisions increased the earthquake resistance of much of California’s building stock, especially its schools
90% of city schools were strengthened
Reconstruction project cost more than $30 million
After WWII
Not much damage, not much progress
Seismologists turned to the new civil defense orgs
Federal support for seismology research increased a hundredfold
Seismologists and engineers rejected tactics employed by grassroots activists
Change of focus
Charles Richter on seismology
As the 1950s passed without any military attack on the continental United States, civil defense groups expanded their activities to include natural hazards as well as military threats
Scientists integrated with agencies
When experts decided to push more vigorously for expanded seismic safety measures in late 1960s and 70s
2/14
California mitigation
1964 Good Friday earthquake- Plate tectonics
1960 M9.5 earthquake in Chile
Instruments improved
On Good Friday, March 27, 1964, M9.2 (9.4?) earthquake struck Alaska
Prediction Program
Seized the opportunity to lobby for a comprehensive national research program
Frank Press was leading seismologist
Earthquake prediction research program focus
Study fault zones in Ca, Nevada, and Alaska
Seismographs, strainmeters, magnetic, and gravity devices on fault zones
$137 million over several years
Hard to Sell
Only about 10 US deaths per year
Leaked panel’s deliberations to the news media
Newspapers responded enthusiastically to earthquake prediction
In the late summer of 1965, the proposal was released even w/o gov endorsement
Earthquake prediction only a heightened risk over several weeks or more
Real estate values, public morale, suffer greatly
UCSB social critic Garret Hardin
Charles Richter
Press panel saw engineering as less impt than earthquake prediction or other geological research
Increased funding proposed for earthquake engineering
Report was not publicly released until after presidential election
Incremental progress, new report
By 1970, most agreed with Clarence Allen that the sections of the San Andreas Fault ruptured in 1857 and 1906 posed hazard for future
San Andreas Fault became densely instrumented
1971 San Fernando earthquake
M7.1
6 am on Feb 9, 1971
65 deaths
$500M in losses
30,000 buildings had been damaged
Iconic San Fernando Mall damage
Very similar to 1994 Northridge
Freeways vulnerability exposed, unexpected damage to some buildings, nearly breached a big dam
Progress After Quake
Engineers strengthened building codes without having to lobby legislators or general public
Seismic design provisions needed strengthening
Codes were changed to address problems
1972 Alquist Priolo Law
Limits building on a one-quarter-mile-wide zone centered on sufficiently well-defined and active faults
Dilatancy-diffusion theory
Rock dilate as they near failure, as numerous tiny cracks form and open up (when stress builds up near an earthquake fault)
Vp, Vs change, ground swells and tilts, radon comes out, etc
Complex pattern over time
Complex Theory
Normal way to do science
Everyone takes a guess
Useful result integrate and generalize
Haicheng 1975
Lots of foreshocks, which is not usually the case, 100,000s of lives saved
1975 Palmdale Bulge
From leveling surveys along 5 routes across southern San Andreas Fault
Along all 5 routes, surface bulged up by 6-10 in
Greatest amount of uplift occurred near town of Palmdale in northern LA county
Demise of Dilatancy-diffusion
On July 28, 1976, a magnitude 7.6 earthquake hit the Chinese city of Tangshan, about 100 miles east of Beijing, without any effective warning, killing perhaps 1,000,000 people
In 1976, Whitcomb quietly withdrew his prediction
By 1979 most of Palmdale bulge had deflated w/o earthquake
National Earthquake Hazard Reduction Program
NEHRP- a legacy of the optimism over earthquake prediction of mid-1970s
And concern over seismic disaster foretold by Palmdale Bulge and Whitcomb prediction
1994 Northridge Earthquake
Jan 1994
Mw = 6.7, 20 by 20 km, 1-2m slip
Buried fault (blind thrust fault)
Focus at deepest part of fault (18 km)
Rupture did not reach surface
On previously known fault
Still few aftershocks
$40-50 billion damage
2014 South Napa Quake
M = 6.0
Many injuries, no deaths
Damage estimated at $300M
Long term impact $1B
Many wineries reported losses
Not on a main fault
Complicated surface rupture
Lots of afterslip
Impt Terms and Concepts
Cause of earthquakes unknown until 1900
Initial efforts constructed catalogs with observers
1906 SF event science advanced, cover-up of danger
1923 Tokyo earthquake great disaster
Bailey Willis and 1933 Long Beach teaching danger to Californians
Nuclear weapons and power plants- new uses for seismology
1970s efforts at prediction-spawned research but few predictions
More recent events in 1971, 1989, 2014 near Ca cities fine-tuned problems and fixes
2/19
Earthquake Hazards
Bay Area Soil conditions
Correlates with damage pattern
Strongest damage on water-deposited sediments
Soft ground areas
Mexico City badly damaged in 1985
M8.0 quake 400 km away
Extremely soft soil
10K deaths
Soft site common: LA, Bay Area, Tokyo, Salt Lake City, Anchorage, Boston, Istanbul
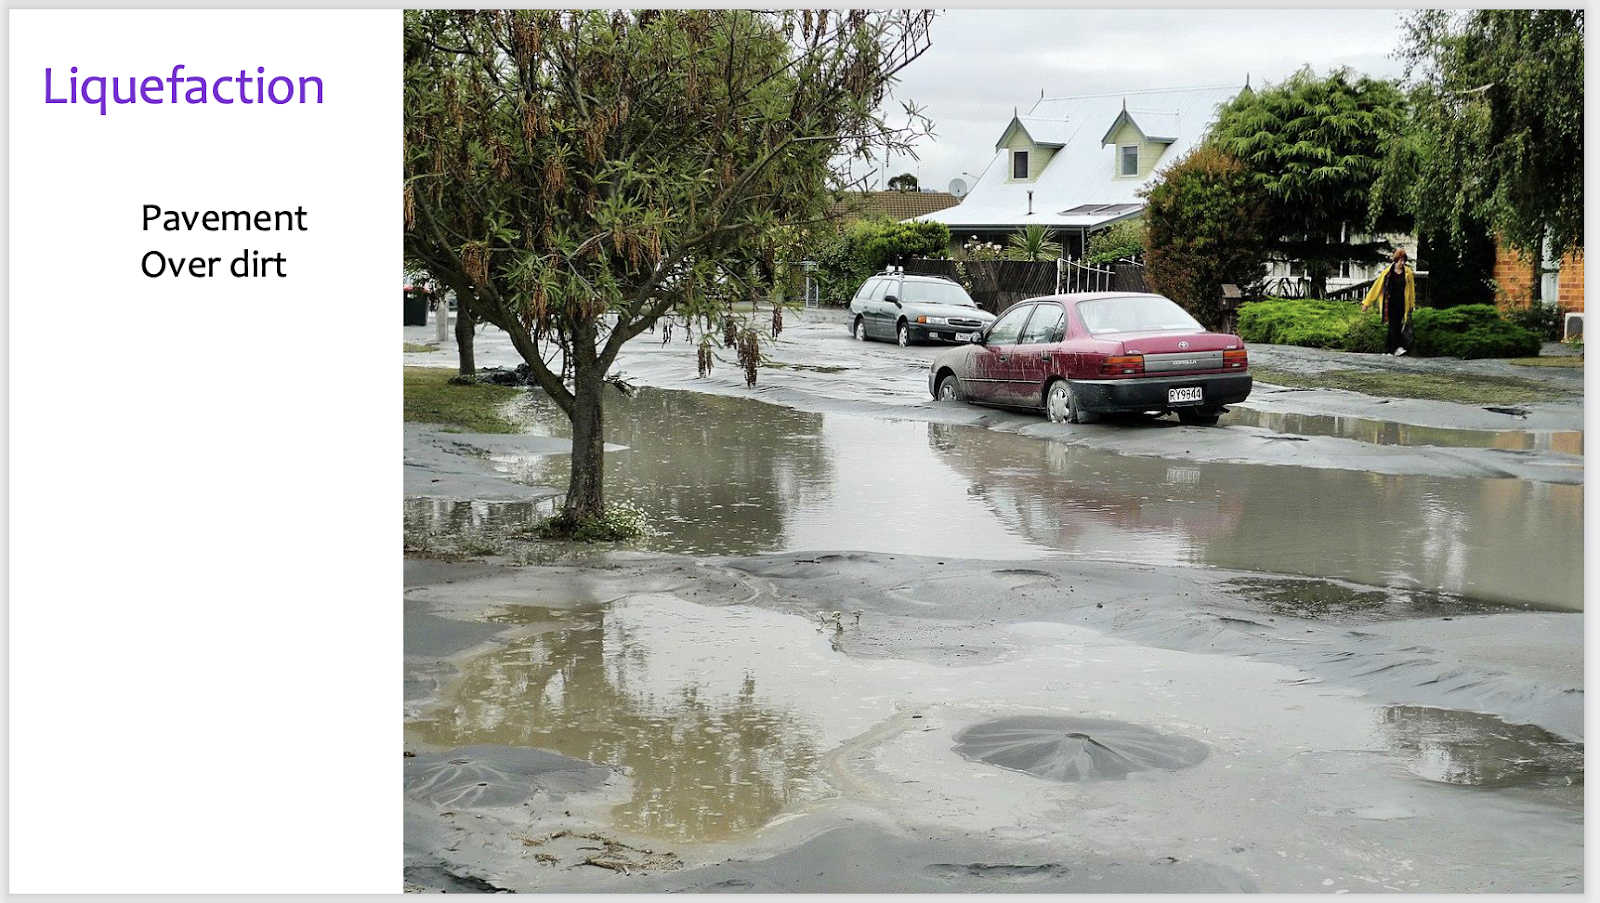
Extreme case: Soil Liquefaction
Santorini
Generally, quake hazard is from ground shaking
But fault trace ground shift can be devastating right on fault trace
Both greater ground shift and ground shaking in fault zone
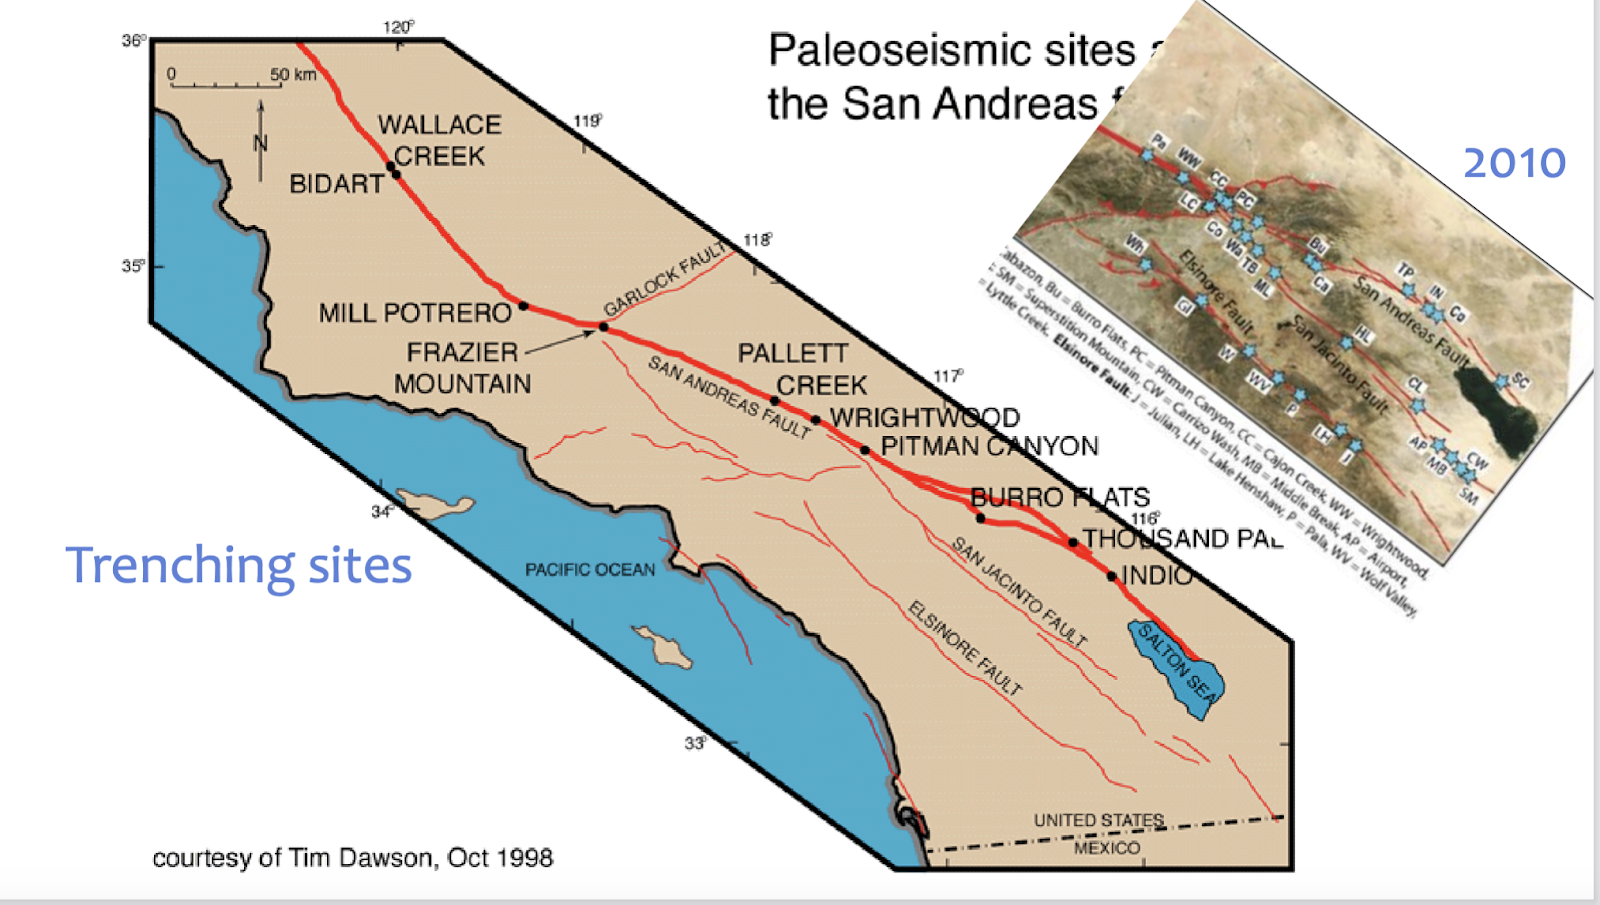
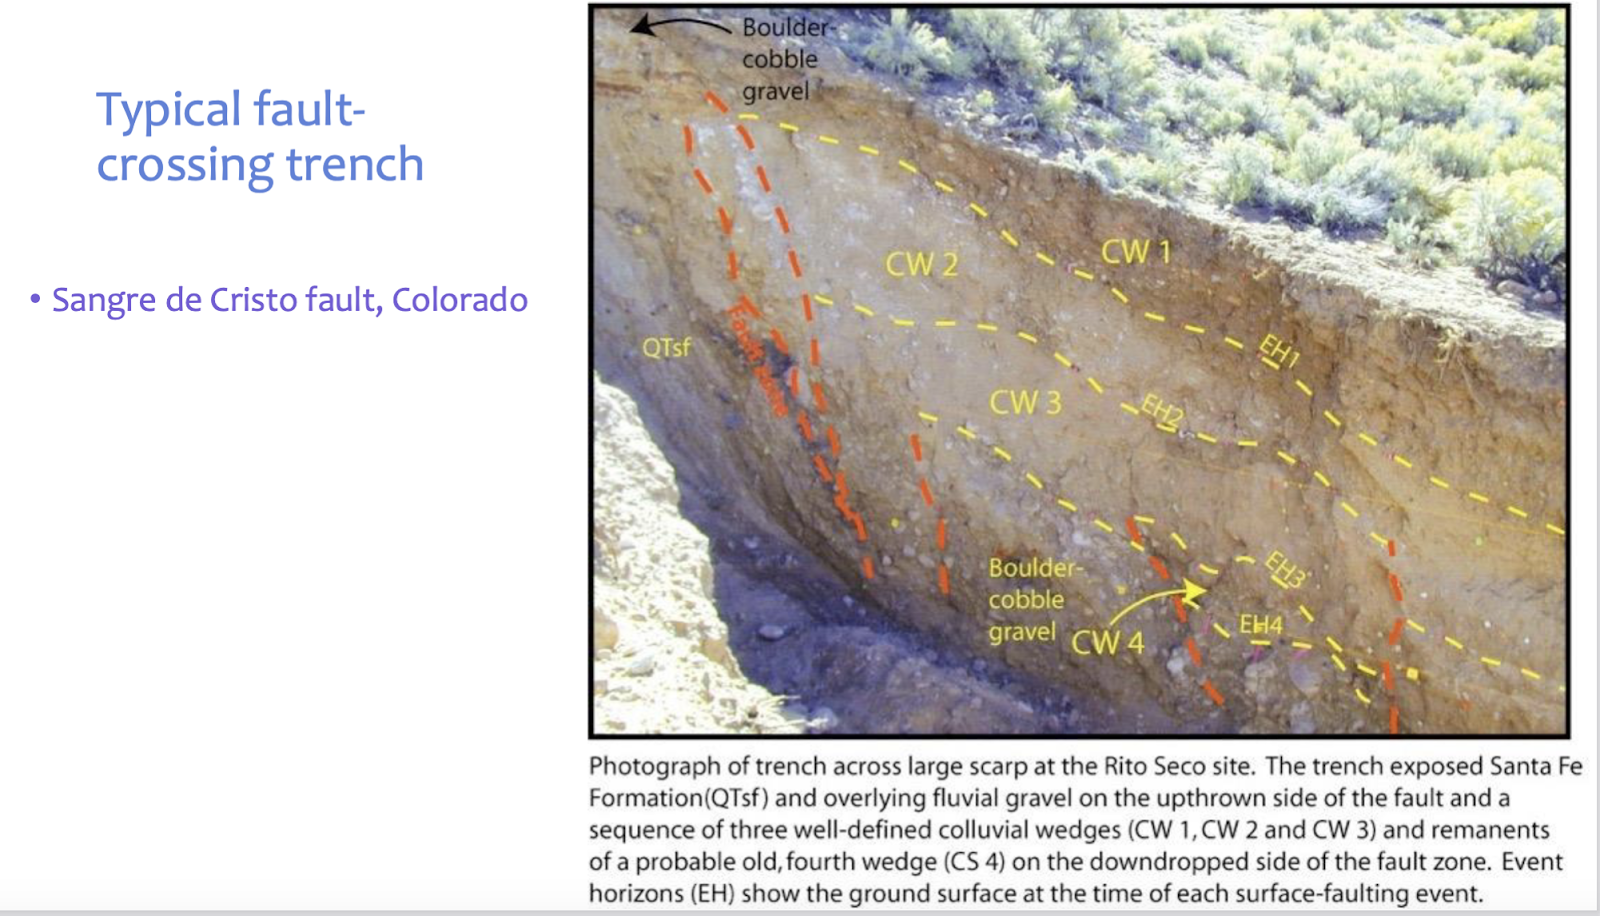
Hazards of Faulting
San Andreas Fault zone in the Carrizo Plains
Imagine tearing on fault trace
And soft ground near fault
How close is dangerous?
Generally, quake hazard is from ground shaking
But fault trace ground shift can be devastating right on fault trace
Both greater ground shift and ground shaking in fault zone
Few structures can withstand ground rupture
1972 Alquist-Priolo Law- fault zone danger
Fault scarp in Nevada, 1954
Building straddling fault in Nicaragua, 1972 earthquake
1971 San Fernando quake
Hayward fault and stadium
UC Berkeley campus
SF water supply 1906
LA and aqueducts
Three major aqueducts feed 88% of LA’s water
An earthquake on the San Andreas could destroy key sections of the aqueducts, cutting off the water supply for more than 22 million people in SoCal
Los Angeles lags the San Francisco in this effort
Denali Fault rupture
Engineers estimated that the pipeline could be subjected to a magnitude 8.0 earthquake in which the ground might slip 20 feet horizontally and 5 feet vertically
The rupture crosses the pipeline within the 1,900 foot corridor
Daly City
San Andreas fault runs through it
Zoning ignore the fault
Relation of danger to faults in big quakes
Worst danger near faults
Most damage within 50 km
Occasional pockets of damage out to 100-200 km from rupture
Strongly depends on one’s building and setting
Soft sites: Soil Effects
Strength of shaking depends
On earthquake size
On distance to earthquake
On “site effect”
Dangerous geology
Softness can vary on a fine scale
1906, for example, near-surface geology matters
Bad soil conditions
Correlates with damage pattern
Strongest damage on water-deposited sediments
LA, Seattle, Bay Area
More on soft ground
Mexico City badly damaged in 1985
M8.0 quake 400km away
Extremely soft soil downtown
10K deaths
Soil Liquefaction
Definition: compaction of water-saturated soil during intense shaking allows water to flow upward
The soil loses its shear strength and flows
Becoming liquefied into a kind of quicksand
General liquefaction criteria
Historical criteria
Which place liquified last time?
Geological criteria
Similarity to other soils that liquify
Compositional and state criteria
Material, relative density, pre-stress
Liquefaction strikes soft, sandy water-saturated soils
Usually low-lying and flat
Often near rivers or bodies of water
Examples of Liquefaction:
Sinking of quick sand in Niigata 1964
Rising sewage tank in Niigata 1964
Liquefaction and poorly connected bridges
Buildings tilted in liquefied sand due to 1964 Niigata, Japan quake
Landfill
Often poorly compacted material
Organic material decays
Producing voids and weak spots that can settle
Therefore, in strong shaking in earthquake
Ground can settle substantially
Often impossible to detect
Pre-WWII methods often leave voids
Newer landfill better compacted, may still have problems in large quake
Locations of landfills are often “forgotten”
Clues
Sidewalk cracks, misalignment of adjacent buildings, doors, or windows, tilting buildings
Landfill settlement- results in the lowering of the ground or surface of a landfill over time
Riverbanks, lakesides
Often thick layers of soft, wet, silty clay
Same problems for edges of bays and soil under leaves
Many downtowns are on riverbanks
Riverbank town often have old buildings
Many roadways, railways, pipelines among the water
Liquefaction damage at Hyogo Port, Kobe, Japan
Avoiding liquefaction
Don't build on bad soil
Build liquefaction- resistant structures
Improve the soil
Dynamic compaction
Stone columns
Compaction piles
Compaction grouting
Improve drainage
Cliffs and Ridges
Sometimes experience greater shaking because unsupported by ground and rock on one or both sides
Example: Glenridge, Bel Air in LA
More often, less shaking
Harder rock
Landslide and rockfall potential
Structural hazards
Dams and reservoirs are hazardous to populated areas
Heavily populated urban areas such as LA, SF, Seattle contain many small reservoirs within city limits
Dikes and levees
Addressed in flooding section
Neighboring buildings
Building construction styles
2/24
Cripple walls
Walls of crawl space
Short wood walls used to elevate house above ground
Access to substructure and utility lines
Often a weak zone in older house
Because a crawl space has only peripheral walls but no interior walls to absorb the force of shaking
Badly braced cripple walls 2nd most common weakness of older houses
Parapets
Masonry parapets often first components to fail in quake
May need to be shortened, anchored, and capped with reinforced concrete
3 Fold Way of EEW
P wave arrives faster than strong shaking
Stations are closer to rupture start than people and property to be warned
Progression of earthquake can be guessed from start
Once quake stops, walk slowly outdoors
Stay in open areas
Only re-enter safe buildings
If in a car
Stop in an open area
Stay in car for a while
Gas Line shut off