7.2 Applications of the Normal Distribution
Learning Objectives
1. Find and interpret the area under a normal curve
2. Find the value of a normal random variable
Standardizing a Normal Random Variable
Equation:
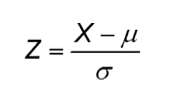
What does this mean?
If a random variable X is normally distributed with a Mean μ and Standard Deviation σ, then the random variable is normally distributed with a Mean (μ) of 0 and a SD (σ) of 1. The random variable Z is said to have the standard normal distribution.
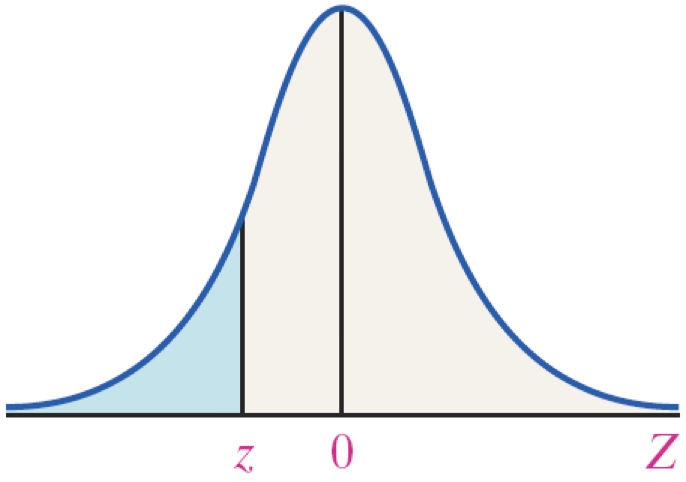
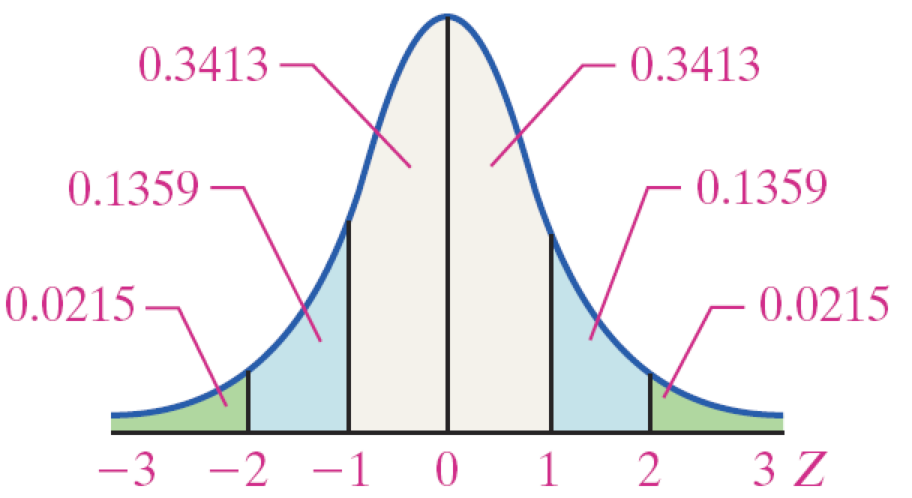
Standard Normal Curve
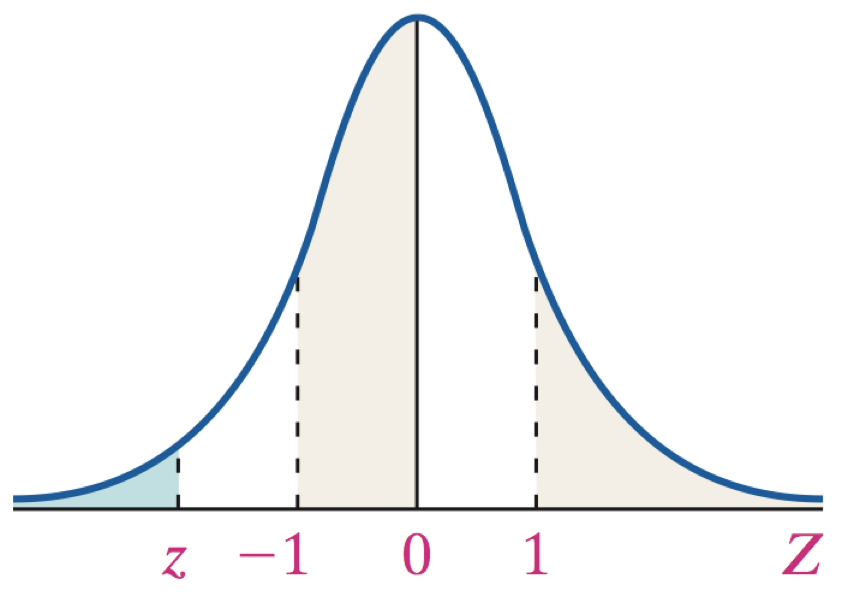
Area under the standard normal curve are values to the left of a specified Z-score, z, as shown in the figure.
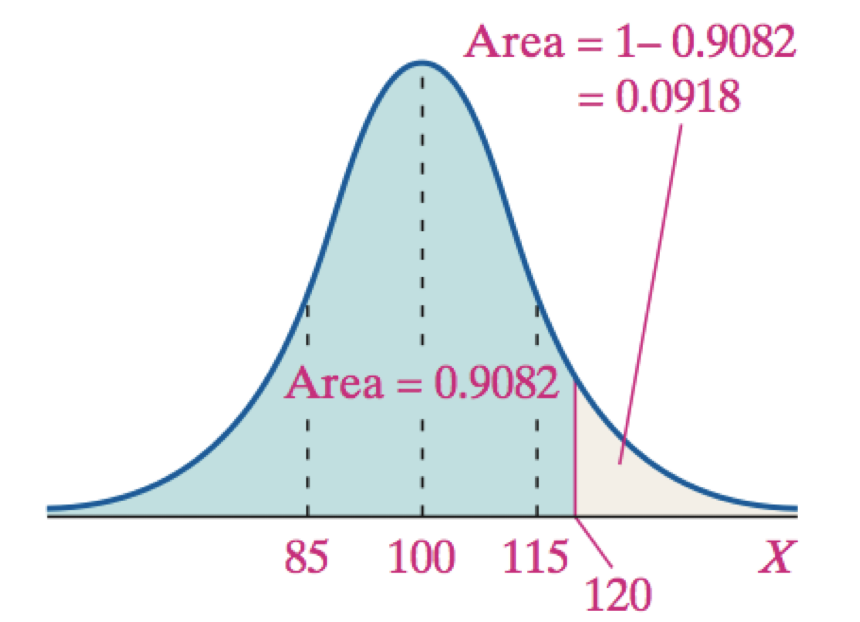
EXAMPLE IQ scores can be modeled by a normal distribution with μ = 100 and σ = 15.
How many standard deviations is an individual with an IQ score of 120 above the mean?
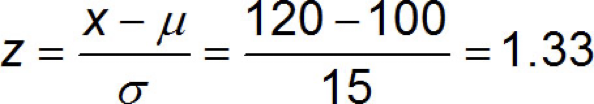
An individual whose IQ score is 120 is 1.33 SDs above the mean.
How do you find area under standard normal curve to the left of a z = 1.33
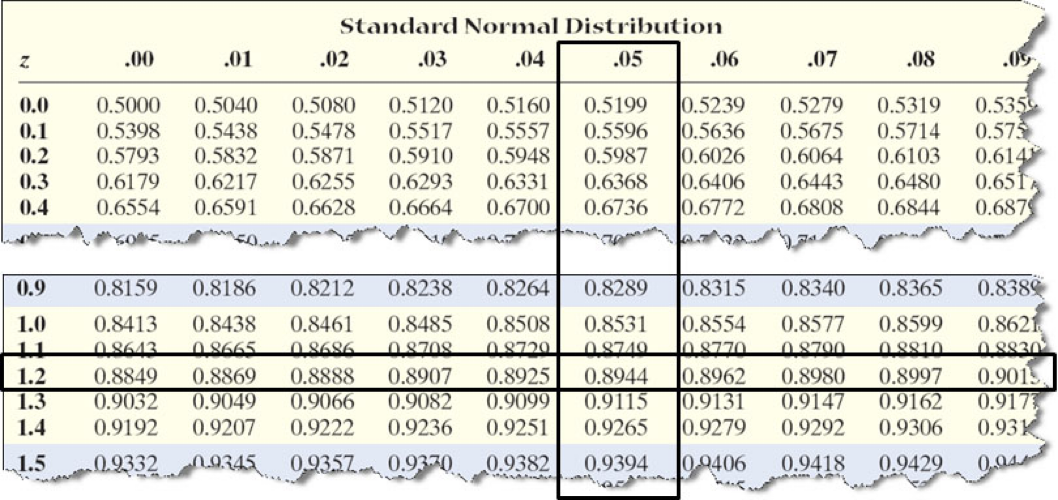
You use this chart:
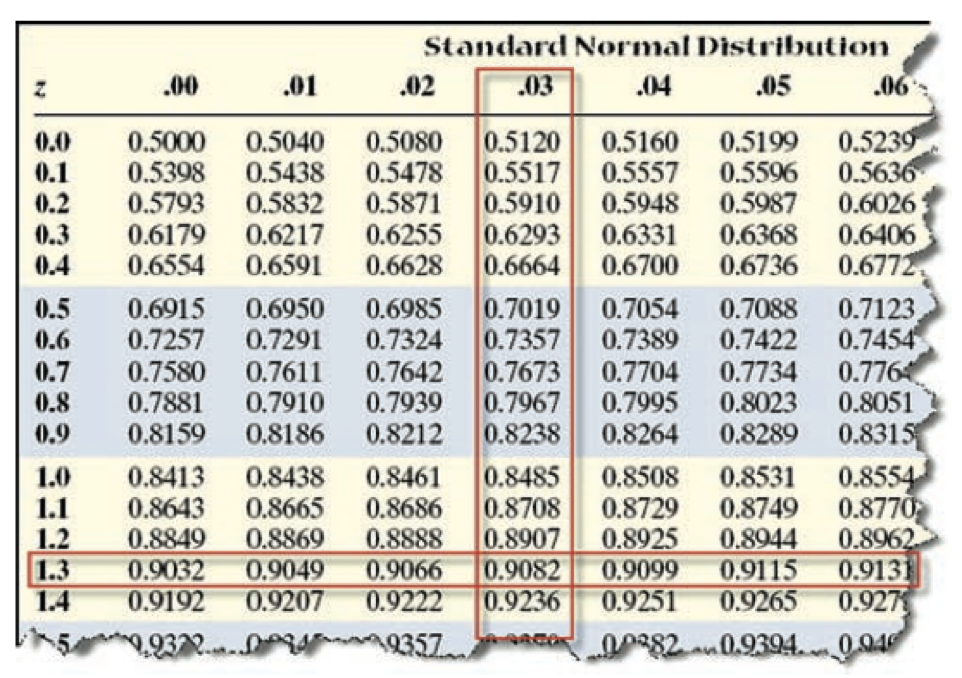
The area under the standard normal curve to the left of z = 1.33 is 0.9082.
“the probability that a person has an IQ less than or equal to 120 is 90.82%”
alternative way to say: “the probability that a person with an IQ of 120 is at about the 91st percentile.”
WARNINGS?? (IN GUIDED NOTES)
Use the Complement Rule to find the area to the right of z = 1.33.
Areas Under the Standard Normal Curve
EXAMPLE Finding the Area Under the Standard Normal Curve to the Left of Z
(a) Find the area under the standard normal curve to the left of z = −0.38.
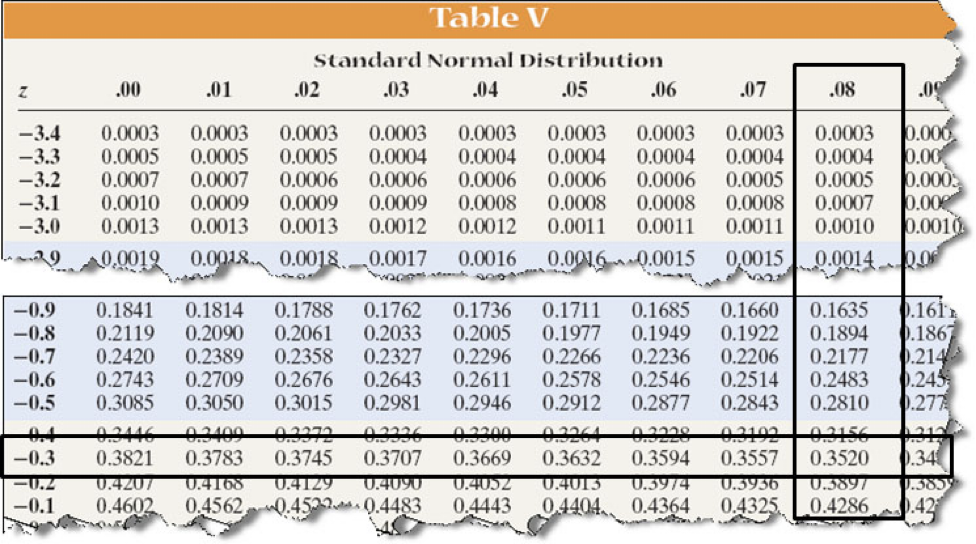
(a) area to left of a z = -0.38 is 0.3520
EXAMPLE Finding the Area Under the Standard Normal Curve to the Right of Z
(a) Find the area under the standard normal curve to the right of z = 1.25.
The area under the normal curve to the right of z is found by 1 − Area to the left of z.
1 - area to left of 1.25
1 - 0.8944 = 0.1056
(a) Area to right of z = 1.25 is 0.1056
EXAMPLE Finding the Area Under the Standard Normal Curve
Find the area under the standard normal curve between z = −1.02 and z = 2.94.
Area between −1.02 and 2.94 is equal to…
(Area left of z = 2.94) − (area left of z = −1.02)
so that is 0.9984 − 0.1539 = 0.8445

Solution:
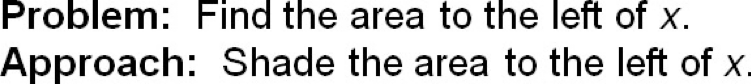
Convert the value of x to a z-score (z= x-Mew/SD). Use Table V to find the row and column that correspond to z. The area to the left of x is the value where the row and column intersect.
Use technology to find the area.
Solution:
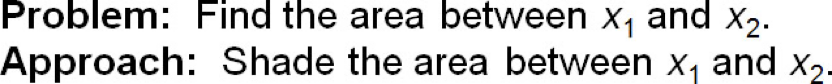
Convert the values of x to a z-scores. Use Table V to find the area to the left of z1 and to the left of z2. The area between z1 and z2 is (area to the left of z2) − (area to the left of z1).
Use technology to find the area.
Using Minitab:
Graph > Probability Distribution Plot > View Probability
Default should be “Normal” Mean: 0.0 Standard Dev: 1.0
Options > a specified x value and select picture
Z-score(s) in X value blank
Click okay until picture comes up
Finding the Value of a Normal Random Variable
Procedure for Finding the Value of a Normal Random Variable
Step 1: Draw a normal curve and shade the area corresponding to the proportion, probability, or percentile.
Step 2: Use Table V to find the z-score that corresponds to the shaded area.
Step 3: Obtain the normal value from the formula x = μ + zσ.
EXAMPLE 1 Finding the Value of a Normal Random Variable
The combined (verbal + quantitative reasoning) score on the GRE is normally distributed with mean 1049 and standard deviation 189.
What is the score of a student whose percentile rank is at the 85th percentile?
The z-score that corresponds to the 85th percentile is the z-score such that the area under the standard normal curve to the left is 0.85. This z-score is 1.04.
x = µ + zσ
x = 1049 + 1.04(189)
x = 1246
Interpretation: A person who scores 1246 on the GRE would rank in the 85th percentile.
EXAMPLE 2 Finding the Value of a Normal Random Variable
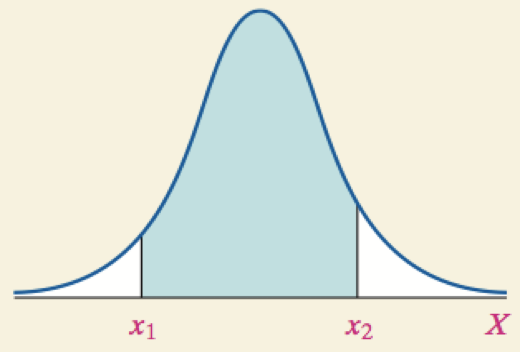
It is known that the length of a certain steel rod is normally distributed with a mean of 100 cm and a standard deviation of 0.45 cm. Suppose the manufacturer wants to accept 90% of all rods manufactured.
Determine the length of rods that make up the middle 90% of all steel rods manufactured.
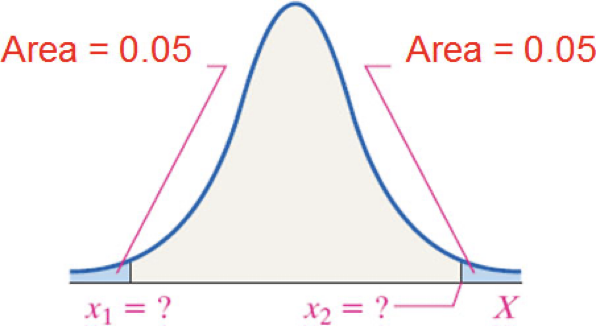
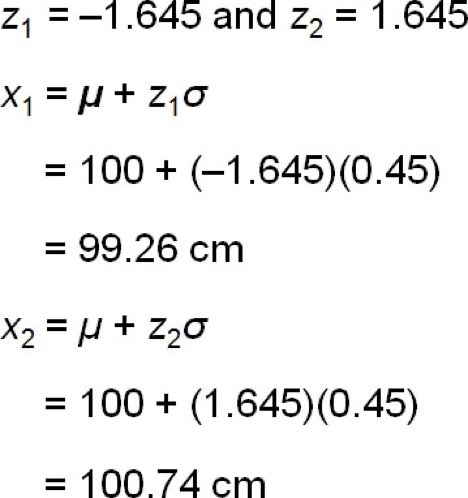
Interpretation: The length of steel rods that make up the middle 90% of all steel rods manufactured would have lengths between 99.26 cm and 100.74 cm.
The notation zα
(pronounced “z sub alpha”)
is the z-score such that the area under the standard normal curve to the right of zα is α.