EXSS3071 Week 1
Slide 1: Welcome to EXSS3071
• Course: Nutrition for Exercise and Health
• University of Sydney
Slide 2: Mental Health Support for Students
• Free and instant access to mental health support.
• Resources for both local and international students.
• International students have 24/7 access to a safety and wellbeing app.
Slide 3: Mental Health Support Services
• List of mental health support services including:
• University of Sydney Counselling and Psychological Services (CAPS).
• Crisis line for after-hours support.
• Butterfly Foundation for eating disorders.
• Headspace for youth mental health.
• Lifeline for crisis support and suicide prevention.
• Beyond Blue for mental health information.
• Batyr for crisis intervention resources.
Slide 4: Academic Integrity
• Importance of academic honesty in all assessments.
• Submitting own work, taking own exams.
• Properly acknowledging sources.
• Restriction on the use of AI tools like ChatGPT unless permitted.
• Academic Honesty Education Module required for new students.
Slide 5: Generative AI Policy
• Explanation of generative AI (e.g., ChatGPT, DALL-E).
• Differentiation between AI for learning and AI for assessment.
• Some assessments may allow AI with strict guidelines.
• More information available on Canvas.
Slide 6: University Support Services
• Educational Integrity Office for reporting misconduct.
• Learning Hub for academic support and skills development.
• Library resources, including referencing support.
• Counselling and Psychological Services for mental health support.
• Special consideration for illness or misadventure.
• Disability support registration.
• Student organizations: SRC (undergraduate), SUPRA (postgraduate).
Slide 7: Digestion & Absorption Lecture
• Presented by Karla Horlyck (APD, AEP).
• Acknowledgement of contributors.
Slide 8: Learning Outcomes – Digestion & Absorption
• Identifying carbohydrate types.
• Explaining carbohydrate digestion, absorption, transport, and storage.
• Understanding blood glucose control (liver, insulin, glucagon).
• Lipid digestion and ATP production from fatty acids.
• Understanding ketone body formation.
• Digestion and absorption of proteins.
• Differentiation between essential and non-essential amino acids.
Slide 9: Lecture Overview
• Breakdown of digestive tract function.
• Digestion & absorption of carbohydrates, fats, and proteins.
Slide 10: Digestive Tract Components
• Mouth & esophagus: Mechanical breakdown, increases surface area.
• Stomach: Temporary storage, mixing.
• Small intestine: Primary site of digestion & absorption.
• Gall bladder, liver, pancreas: Digestive enzyme production.
• Large intestine: Water absorption, waste processing.
• Rectum & anus: Elimination.
Slide 11: Types of Carbohydrates
• Monosaccharides: Glucose (sports drinks), Fructose (fruit, honey), Galactose.
• Disaccharides: Maltose (glucose + glucose), Sucrose (glucose + fructose), Lactose (glucose + galactose).
• Oligosaccharides: Maltodextrin (3-9 sugar units).
• Polysaccharides:
• Glycogen (stored in meats, limited).
• Starch (bread, cereals, starchy vegetables).
• Fibre (indigestible, e.g., cellulose).
Slide 12: Chemical Structure of Carbohydrates
• Diagram of different carbohydrate structures.
• Differentiation between mono-, di-, and polysaccharides.
Slide 13: Digestion of Carbohydrates
• Mouth: Salivary amylase breaks down starch into smaller polysaccharides & maltose.
• Stomach: Acid inactivates amylase, halting carbohydrate digestion.
• Small Intestine: Pancreatic amylase continues digestion, breaking starch into disaccharides.
Slide 14: Enzymatic Breakdown of Carbohydrates
• Disaccharides hydrolyzed into monosaccharides by enzymes:
• Maltase: Maltose → Glucose + Glucose.
• Sucrase: Sucrose → Fructose + Glucose.
• Lactase: Lactose → Galactose + Glucose.
• Digestion is mostly complete 1-4 hours after a meal.
• Fibre remains undigested and undergoes fermentation in the large intestine.
Slide 15: Carbohydrate Absorption
• Monosaccharides (glucose, fructose, galactose) absorbed by active transport into the blood.
• Transported to the liver via the portal vein.
• Liver converts fructose and galactose into glucose.
• Glucose circulates in the blood for energy.
Slide 16: Storage of Glucose as Glycogen
• Liver stores and releases glucose as needed.
• About 1/3 of glycogen is stored in the liver.
• When blood glucose falls, glycogen is broken down into glucose and released into the bloodstream.
Slide 17: Blood Glucose Regulation
• All body cells depend on glucose.
• Brain, retina, nervous tissue can’t store glucose.
• Blood glucose maintained between 4-8 mmol/L.
• Hormones regulating blood glucose:
• Insulin: Moves glucose into cells for storage.
• Glucagon: Releases stored glucose from cells into the blood.
• Gluconeogenesis: When no carbs are available, glucose is made from protein.
Slide 18: Lipid Intake
• Daily intake:
• Triglycerides: 50-100g.
• Cholesterol: 300-450mg.
• Phospholipids: 4-8g.
• Triglycerides must be broken down into smaller molecules for absorption.
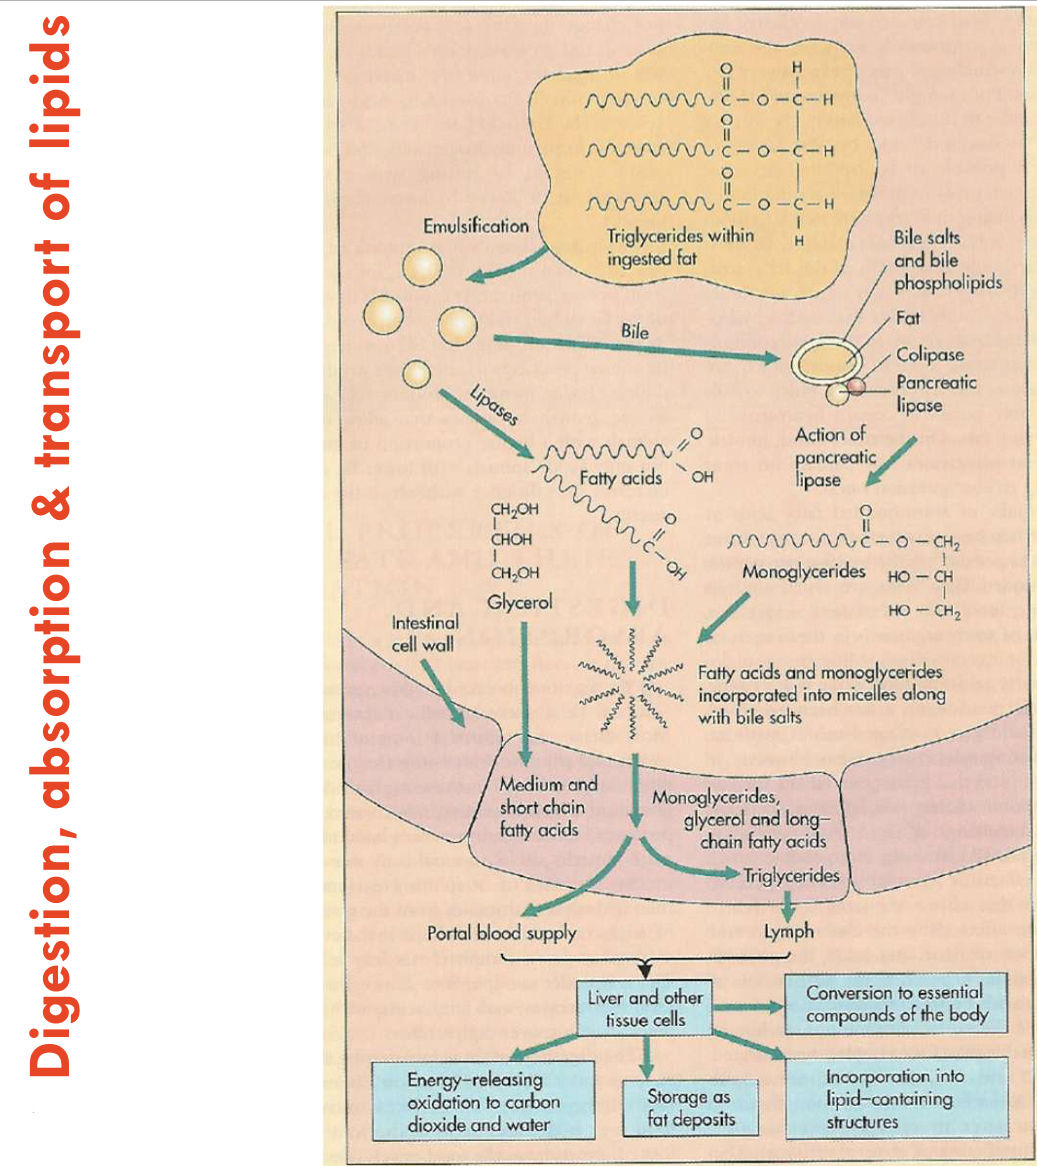
Slide 19: Digestion & Absorption of Lipids
• Mouth: Some fats melt, salivary lipase starts digestion.
• Stomach: Minimal digestion occurs.
• Small Intestine:
• Cholecystokinin (CCK): Stimulates gall bladder to release bile.
• Liver: Produces bile from cholesterol.
• Pancreatic Lipase: Breaks triglycerides into glycerol and free fatty acids.
Slide 20: Lipid Transport & Absorption
• Fats form chylomicrons in intestinal cells.
• Chylomicrons enter the lymphatic system, then the bloodstream.
Slide 21: Lipid Utilization & Storage
• Triglycerides delivered to body cells.
• Most triglycerides stored in adipose tissue.
• Some stored in muscle (intramuscular triglycerides, IMT).
• Lipoprotein lipase (LPL): Breaks triglycerides into fatty acids for absorption.
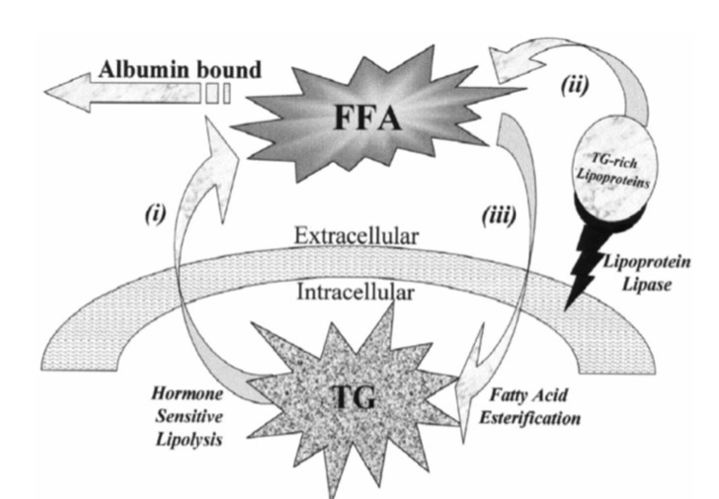
Slide 22: Lipid Breakdown for Energy
• Hormone-Sensitive Lipase (HSL) breaks down triglycerides into glycerol and free fatty acids (FFA).
• FFA attach to albumin for transport in the blood.
• FFAs used for ATP production via β-oxidation.
Slide 23: Releasing Lipids from Cells for Fuel
• Stored triglycerides (TG) in adipose tissue are mobilized when energy is needed.
• Hormone-Sensitive Lipase (HSL) activates and hydrolyzes triglycerides into:
• Glycerol (which can enter glycolysis for energy).
• Free Fatty Acids (FFA) (which travel to tissues for β-oxidation).
• FFAs do not dissolve in blood and must bind to albumin for transport.
• The combination of FFAs + albumin is known as Non-Esterified Fatty Acids (NEFA).
• NEFA are taken up by body cells, where they undergo β-oxidation in the mitochondria to produce ATP.
Slide 24: Making Ketone Bodies
• Ketone bodies are produced when fat is broken down rapidly and carbohydrate intake is low.
• This occurs during:
• Fasting/starvation.
• Uncontrolled diabetes (insulin deficiency).
• Low-carbohydrate diets (e.g., Atkins diet).
• Three types of ketone bodies:
• Acetoacetate (primary ketone body).
• β-hydroxybutyrate (most abundant in blood).
• Acetone (least used, excreted in breath).
• Excessive ketone production leads to ketoacidosis, a dangerous condition in diabetics.
Slide 25: Carbohydrate Requirement to Prevent Ketosis
• 50-100g of carbohydrate per day is needed to prevent excessive ketone formation.
• The average carbohydrate intake for most people is 200-300g per day.
• Ketosis is commonly observed in:
• People with severe starvation or fasting.
• Patients with anorexia nervosa.
• Uncontrolled insulin-dependent diabetics.
• Individuals on extreme low-carb diets.
Slide 26: Which Tissues Use Ketones?
• Most tissues (except the liver) can use ketone bodies for energy.
• The brain usually depends on glucose, but in prolonged fasting, it adapts to use ketones.
• Blood-brain barrier:
• FFAs cannot cross the blood-brain barrier.
• Ketones can cross and are converted back to Acetyl-CoA to fuel the TCA cycle (Krebs cycle).
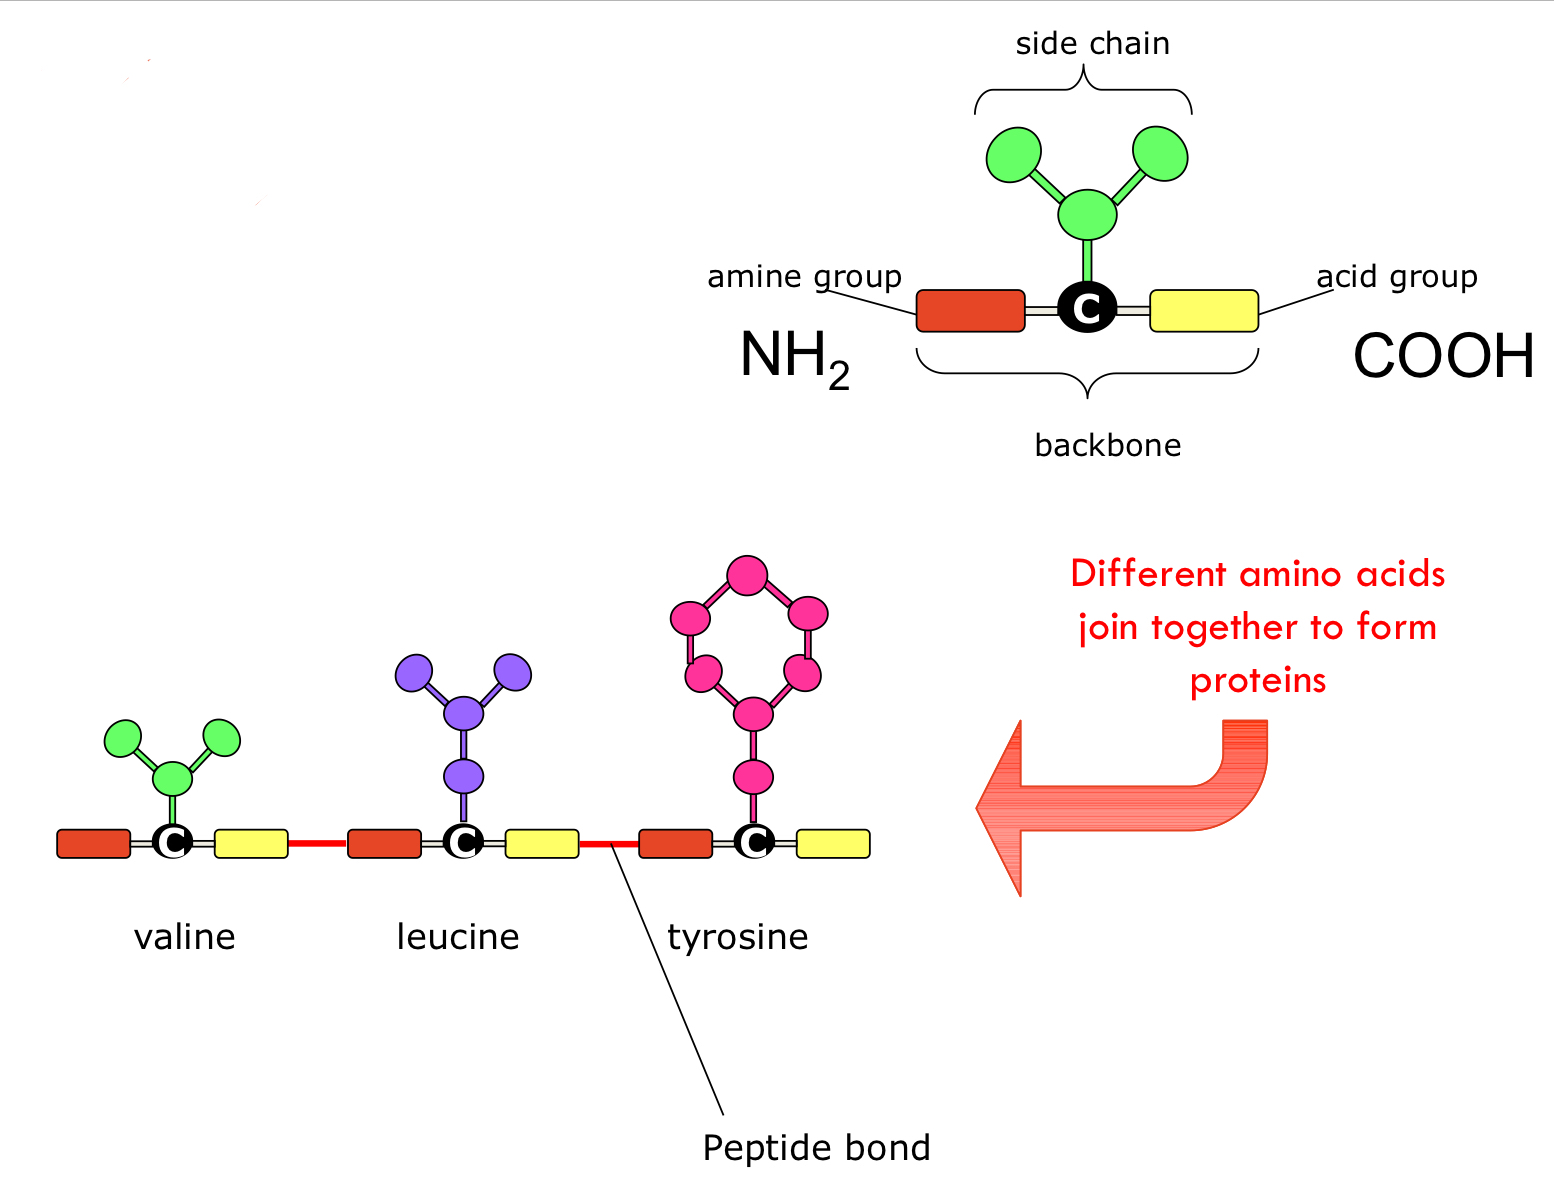
Slide 27: Amino Acids and Protein Structure
• Amino acids are the building blocks of proteins.
• Structure includes:
• A central carbon (C) backbone.
• An amine group (NH2).
• A carboxyl (acid) group (COOH).
• A unique side chain (R group), which determines the amino acid’s properties.
• Peptide bonds link amino acids to form proteins.
Slide 28: Essential vs. Non-Essential Amino Acids
• Essential Amino Acids (must be obtained from diet):
• Histidine, Valine, Leucine, Isoleucine, Lysine, Methionine, Threonine, Phenylalanine, Tryptophan.
• Non-Essential Amino Acids (can be synthesized by the body):
• Glycine, Alanine, Cysteine, Serine, Aspartate, Asparagine, Glutamate, Glutamine, Arginine, Proline.
Slide 29: Protein Digestion & Absorption
• Stomach:
• Pepsinogen (inactive enzyme) is activated by stomach acid (HCl) to form Pepsin.
• Pepsin begins protein breakdown into smaller peptides.
• Small Intestine:
• Pancreatic enzymes (proteases): Trypsin, Chymotrypsin, and Carboxypeptidase break down peptides further.
• Brush border enzymes: Dipeptidase and aminopeptidase complete digestion into individual amino acids.
• Absorption:
• Amino acids are absorbed via active transport into intestinal cells.
• Transported to the liver via the portal vein for metabolism.
Slide 30: End of Part 1
• Transition to the next lecture topic: Introduction to Nutrition.
Slide 31: Introduction to Nutrition
• Presenter: Karla Horlyck (APD, AEP).
• Focus on basic nutrients, dietary guidelines, and energy balance.
Slide 32: Learning Outcomes – Introduction to Nutrition
• Identify macro- and micronutrients.
• Understand Atwater factors (calculation of energy in food).
• Differentiate between nutrient reference values (NRVs).
• Learn about dietary guidelines in Australia and other countries.
Slide 33: Introduction to Nutrition Topics
• Overview of key concepts:
• Nutrients
• Nutrient Reference Values (NRVs)
• Dietary Guidelines
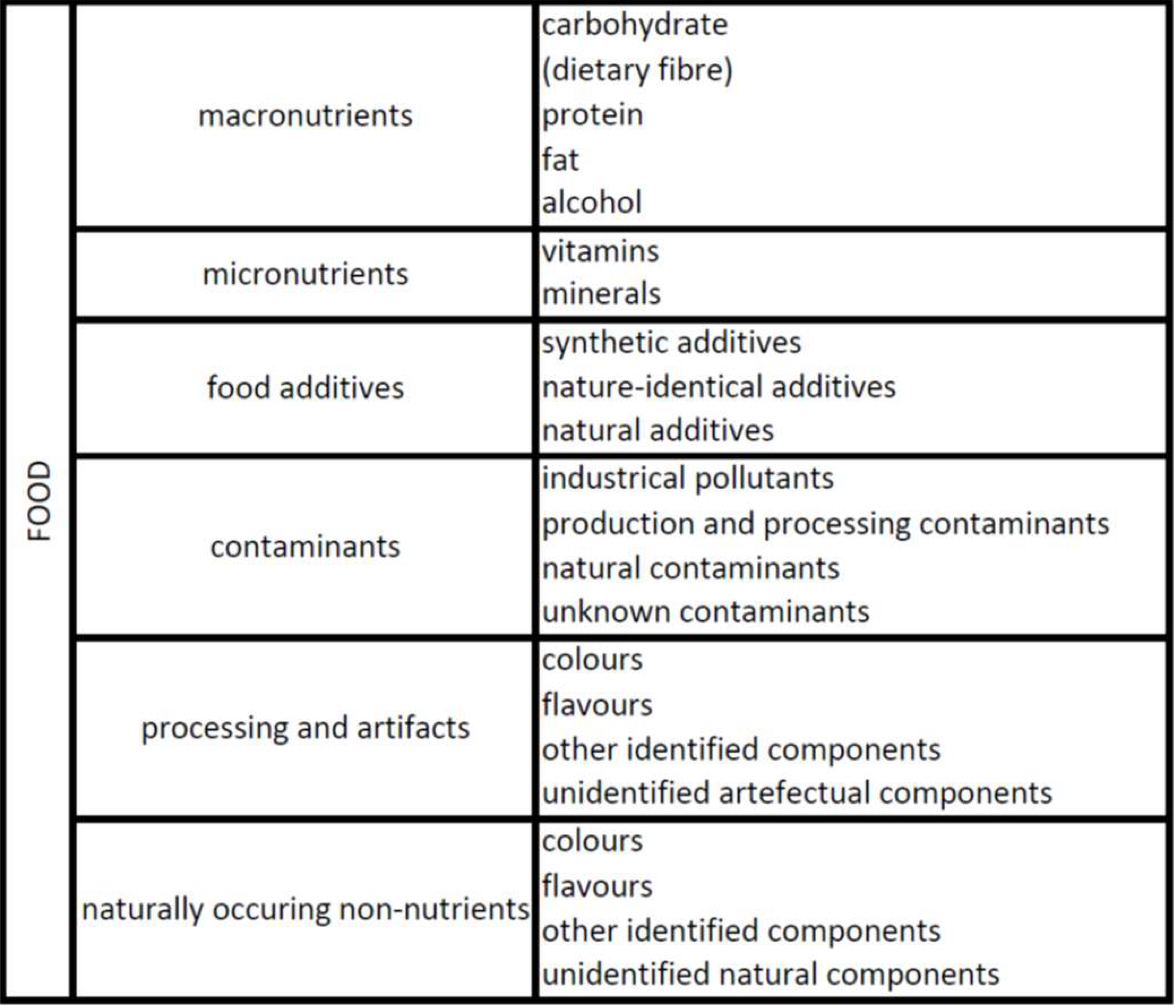
Slide 34: Nutrient Categories
• Macronutrients: Provide energy (Carbohydrates, Fats, Proteins).
• Micronutrients: Required in small amounts, do not provide energy (Vitamins, Minerals).
• Water: Essential for metabolism and homeostasis.
Slide 35: Nutrient Composition of Bread
• Example: 1 slice of multigrain bread contains:
• Carbohydrates: 15.6g
• Fibre: 1.58g
• Protein: 4.36g
• Fat: 0.86g
• Water: 13.54g
Slide 36: Food as a Source of Nutrients
• Foods contain multiple nutrients, not just one.
• Examples:
• Bread is high in carbohydrates, but also contains protein and fibre.
• Milk is a source of calcium, but also has carbs, protein, and fat.
Slide 37: Macronutrients Provide Energy
• Measured in Kilojoules (kJ) or Calories (kcal).
• Macronutrients and their energy values:
• Protein: 17 kJ/g
• Fat: 37 kJ/g
• Carbohydrates: 17 kJ/g
• Alcohol: 29 kJ/g
Slide 38: Dietary Fibre
• Definition: Non-digestible carbohydrates that contribute to gut health.
• Types:
• Soluble Fibre: Lowers cholesterol, stabilizes blood glucose (e.g., oats, legumes).
• Insoluble Fibre: Aids digestion, prevents constipation (e.g., whole grains, vegetables).
• Resistant Starch: Fermented in the large intestine, promotes gut bacteria.
• Health benefits: Improves digestion, reduces heart disease risk, regulates blood sugar.
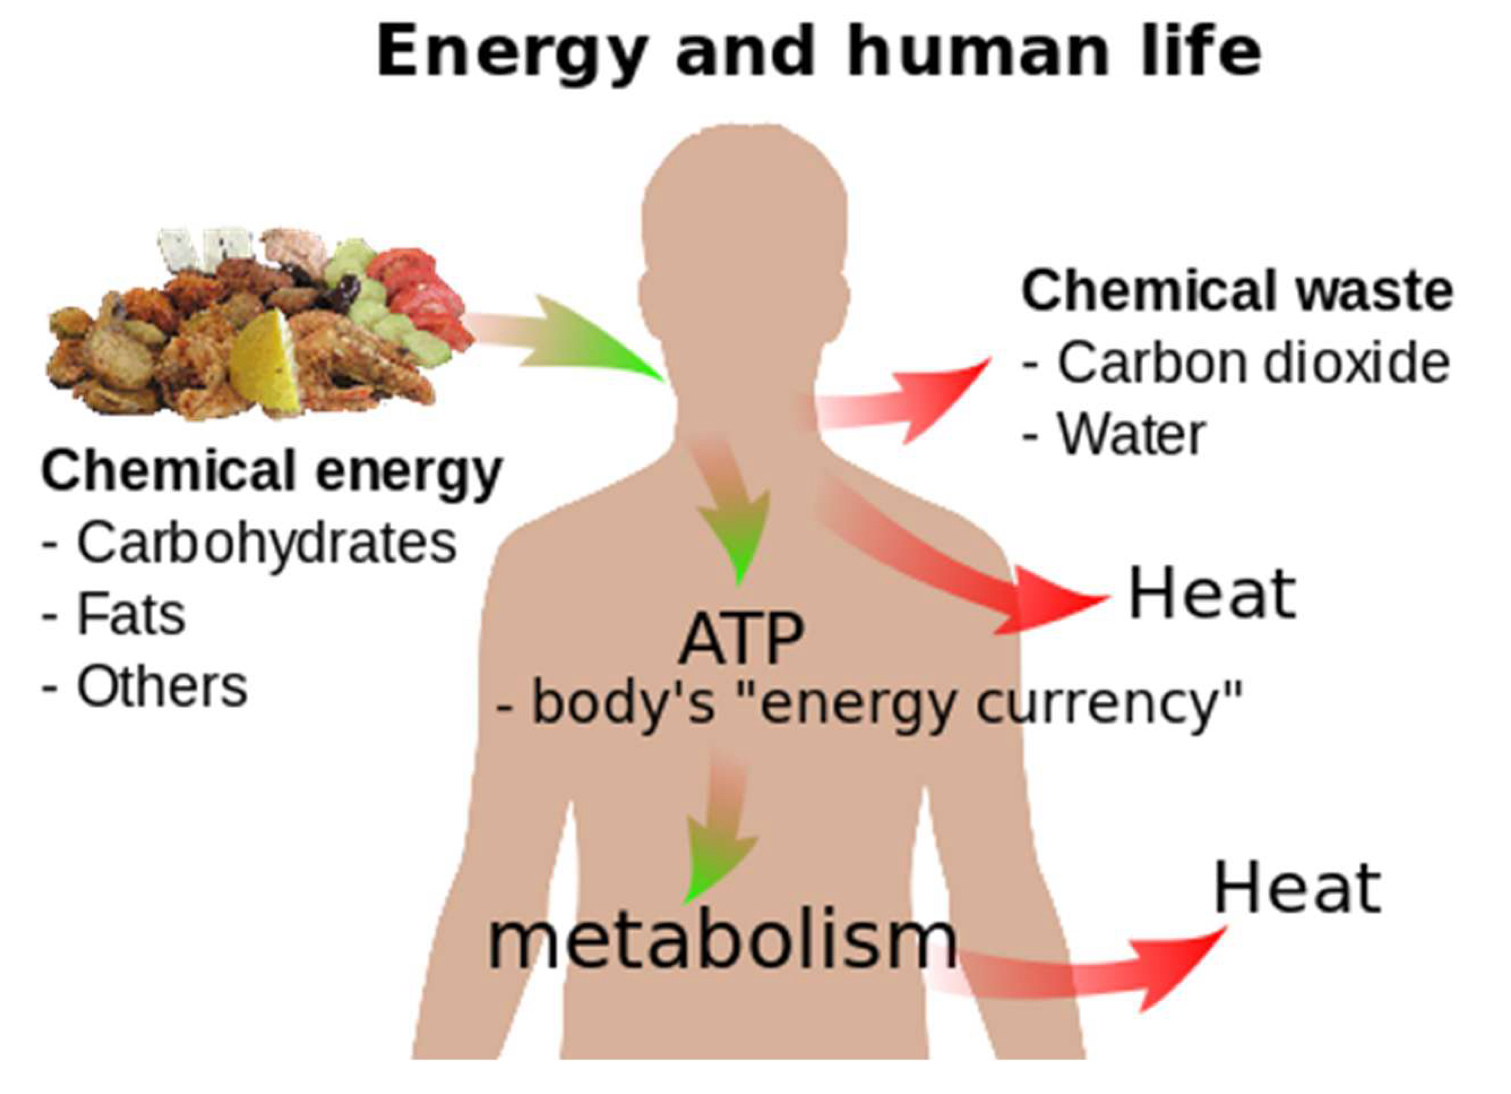
Slide 39: Energy Balance and Metabolism
• Energy Intake vs. Energy Expenditure:
• Excess intake → Weight gain
• Deficit intake → Weight loss
• Basal Metabolic Rate (BMR): Minimum energy required to maintain vital functions.
• Thermic Effect of Food (TEF): Energy required to digest and metabolize food.
Slide 40: Atwater Factors
• Atwater factors are used to estimate the energy value of food components.
• Energy values per gram:
• Protein: 17 kJ/g (4 kcal/g)
• Fat: 37 kJ/g (9 kcal/g)
• Carbohydrates: 17 kJ/g (4 kcal/g)
• Alcohol: 29 kJ/g (7 kcal/g)
• 1 kcal = 4.184 kJ
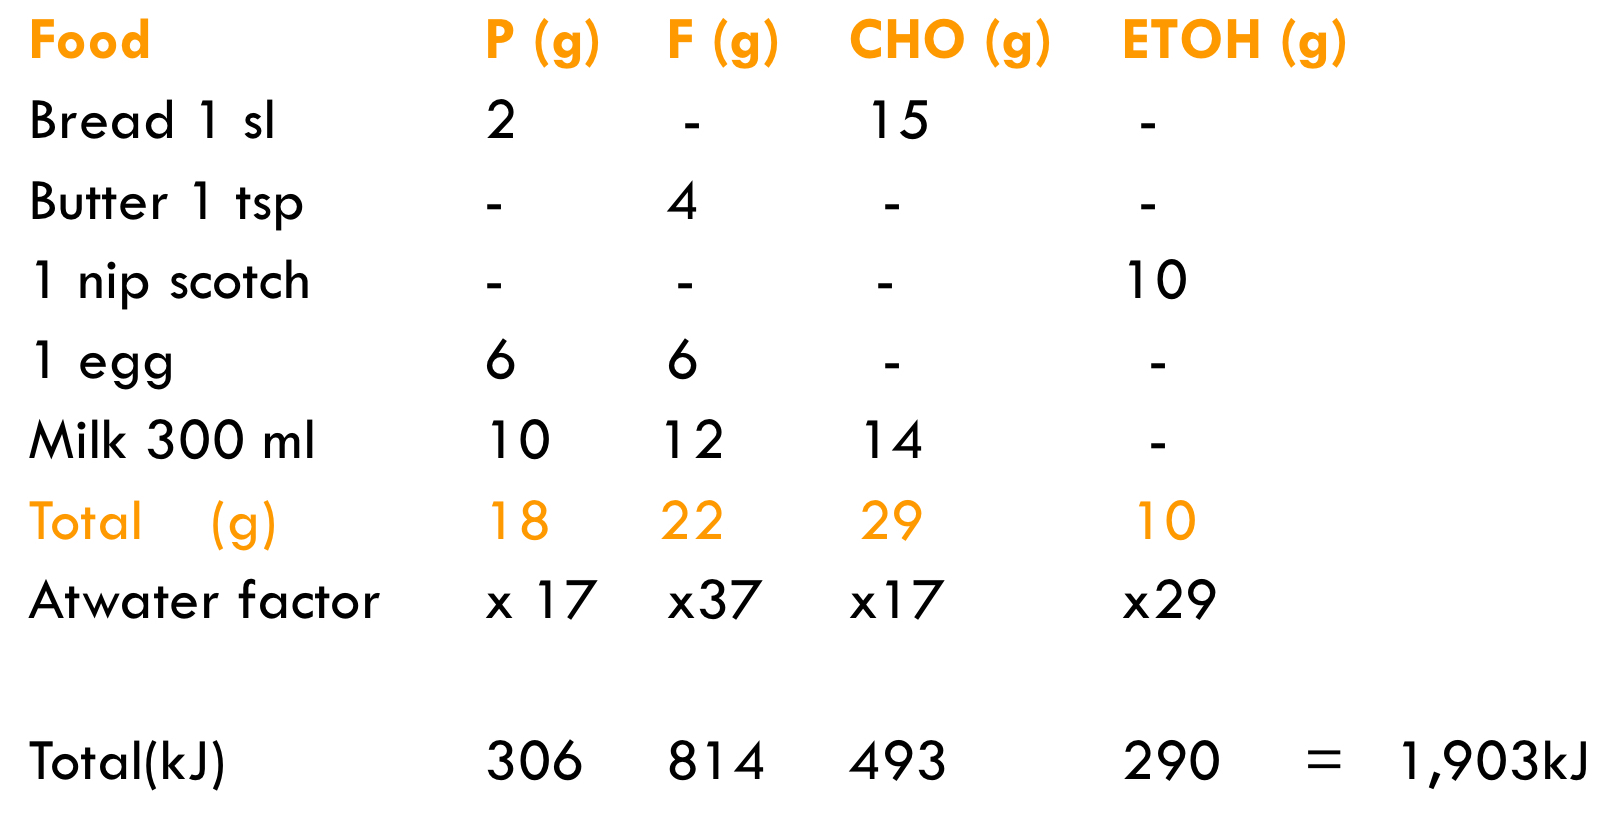
Slide 41: Diet Calculation Example
• A sample meal:
• 1 slice of bread: 2g protein, 15g carbohydrate, 0g fat
• 1 tsp butter: 4g fat
• 1 nip scotch: 10g alcohol
• 1 egg: 6g protein, 6g fat
• 300ml milk: 10g protein, 12g fat, 14g carbohydrate
• Energy calculation using Atwater factors:
• Protein: 18g × 17 kJ/g = 306 kJ
• Fat: 22g × 37 kJ/g = 814 kJ
• Carbohydrates: 29g × 17 kJ/g = 493 kJ
• Alcohol: 10g × 29 kJ/g = 290 kJ
• Total energy intake: 1,903 kJ
Slide 42: Energy Distribution in the Diet
• Total energy intake (1,874 kJ) distributed as follows:
• Protein: (306 kJ ÷ 1,874 kJ) × 100 = 16.2%
• Fat: (814 kJ ÷ 1,874 kJ) × 100 = 43.4%
• Carbohydrates: (464 kJ ÷ 1,874 kJ) × 100 = 24.8%
• Alcohol: (290 kJ ÷ 1,874 kJ) × 100 = 15.5%
• Acceptable Macronutrient Distribution Range (AMDR) for Australians:
• Protein: 15–25%
• Fat: 20–35%
• Carbohydrates: 45–65%
Slide 43: Micronutrients
• Micronutrients are needed in small amounts (mg or μg).
• Do not provide energy but are essential for enzyme function.
• Categories:
• Vitamins: Fat-soluble (A, D, E, K) and water-soluble (B-complex, C).
• Minerals: Major minerals (calcium, potassium, sodium) and trace elements (iron, zinc, iodine).
Slide 44: Vitamins Overview
• Fat-Soluble Vitamins (stored in fat tissue):
• Vitamin A, D, E, K
• Water-Soluble Vitamins (excreted in urine, not stored):
• B vitamins (B1, B2, B3, B6, B12, folate, pantothenic acid, biotin)
• Vitamin C
• Roles of vitamins:
• Vitamin C: Antioxidant, collagen synthesis.
• B vitamins: Metabolism of macronutrients.
• Vitamin A: Vision and immune function.
Slide 45: Preserving Vitamins in Food
• Methods to retain vitamin content:
• Minimize cooking time and use little water.
• Avoid soaking vegetables.
• Limit exposure to air and light.
• Avoid using baking soda when cooking vegetables.
• Store fresh food properly and consume quickly.
Slide 46: Minerals Overview
• Major minerals:
• Calcium: Bone health, muscle contraction.
• Iron: Oxygen transport (hemoglobin).
• Potassium, Magnesium, Sodium: Electrolyte balance.
• Trace minerals:
• Zinc: Immune function, wound healing.
• Copper: Red blood cell formation.
• Iodine: Thyroid hormone production.
Slide 47: Nutrients in Food Example (Multigrain Bread)
• Macronutrients:
• Carbohydrates: 16.9g
• Fibre: 1.58g
• Protein: 3.4g
• Fat: 0.83g
• Micronutrients:
• Thiamin: 0.15mg
• Riboflavin: 0.02mg
• Niacin: 1.03mg
• Folate: 102.96μg
• Sodium: 144mg
• Magnesium: 26mg
• Calcium: 34mg
Slide 48: How Much Do We Need?
• Nutrient requirements depend on:
• Age and gender
• Body size and weight
• Physiological state (e.g., pregnancy, lactation)
• Individual variations (safety margins apply to RDIs)
Slide 49: Nutrient Reference Values (NRVs)
• Reference values that determine nutrient intake recommendations:
• Recommended Dietary Intake (RDI)
• Estimated Average Requirement (EAR)
• Adequate Intake (AI)
• Upper Limit (UL)
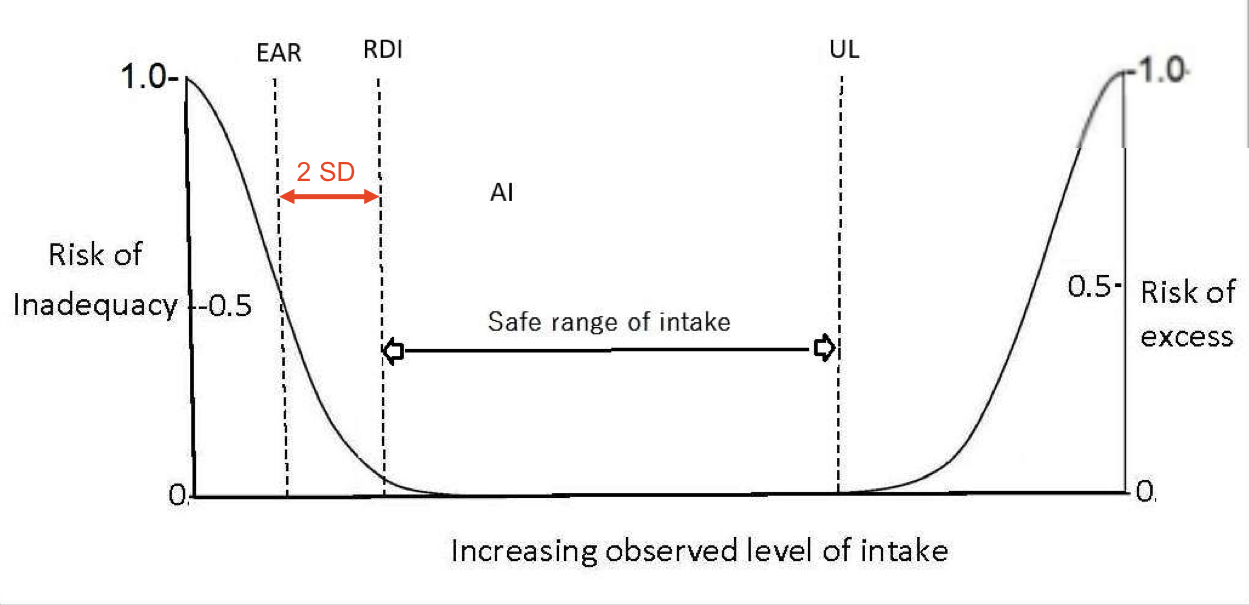
Slide 50: Definitions of NRVs
• EAR (Estimated Average Requirement):
• Nutrient intake that meets 50% of healthy individuals in a population.
• RDI (Recommended Dietary Intake):
• Meets the needs of 97-98% of healthy individuals.
• AI (Adequate Intake):
• Used when EAR and RDI are unavailable.
• UL (Upper Limit):
• Maximum safe level of intake before risk of toxicity.
Slide 51: Estimated Energy Requirement (EER)
• The average dietary intake that maintains energy balance in a healthy individual.
• Factors affecting EER:
• Age, gender, weight, height, physical activity level.
Slide 52: How Much Is Enough?
• Nutrient recommendations vary by:
• Age group
• Gender
• Pregnancy/lactation
Slide 53: NRVs and Their Application
• NRVs are used for population-level dietary planning.
• Not designed for individual assessments.
Slide 54: Suggested Dietary Targets (SDT) for Chronic Disease Prevention
• SDT represents nutrient intakes linked to reducing chronic disease risk.
• Example: Higher fibre intake is linked to lower heart disease risk.
Slide 55: Australian Suggested Dietary Targets (SDT)
• Guidelines set by the NHMRC for optimal health.
Slide 56: Acceptable Macronutrient Distribution Range (AMDR)
• Recommended proportion of daily energy intake:
• Protein: 15–25%
• Fat: 20–35%
• Carbohydrates: 45–65%
Slide 57: How Are NRVs Determined?
• Based on scientific evidence of nutrient requirements.
Slide 58: Communicating a Healthy Diet in Australia
• Australian Guide to Healthy Eating (AGHE).
• National Dietary Guidelines.
Slide 59: Australian Dietary Guidelines (ADG)
• Provides science-based recommendations for healthy eating.
• Designed to promote long-term health and reduce chronic disease risk.
Slide 60: US MyPlate Guide to Healthy Eating
• Comparison with Australian dietary guidelines.
Slide 61: Nutrition Australia Healthy Eating Pyramid
• Visual representation of a balanced diet.
Slide 62: AGHE Food Groups
• Vegetables, grains, proteins, dairy, fruits.
Slide 63: Limitations of AGHE
• Does not specify portion sizes or mixed foods.
Slide 64: End of Lecture
• Conclusion and next steps in learning about dietary assessment methods.
Slide 65: Nutritional Characteristics of the Five Food Groups
• Five core food groups from the Australian Guide to Healthy Eating (AGHE):
1. Vegetables, legumes, beans – Provide fibre, vitamins (A, C, K), and minerals.
2. Fruits – Rich in vitamins (C), fibre, and natural sugars.
3. Grain (cereal) foods – Major source of carbohydrates, fibre, B vitamins, and iron.
4. Lean meats, poultry, fish, eggs, tofu, nuts, seeds, legumes – Provide protein, iron, zinc, and B vitamins.
5. Milk, yoghurt, cheese (and alternatives) – Main source of calcium and protein.
Slide 66: Nutritional Characteristics of the Five Food Groups (Continued)
• Each food group provides essential nutrients for different bodily functions.
• Balanced intake of all five groups supports optimal health and reduces chronic disease risk.
Slide 67: What Doesn’t the Plate Tell Me?
• The AGHE plate model does not provide information on:
• Exact serve sizes for different life stages (children, elderly, athletes, etc.).
• How many serves are required per food group per day.
• Age and gender-specific variations in dietary needs.
• How much oil/fat should be consumed for a balanced diet.
• Guidance on discretionary (sometimes) foods like snacks and treats.
• How to categorize mixed foods (e.g., pizza, casseroles).
• Solution: Refer to the AGHE Educator’s Guide and consumer brochures for more detailed guidance.
Slide 68: Quirks of the Australian Guide to Healthy Eating (AGHE)
• Unusual categorization of some foods:
• Legumes and lentils are in two food groups (vegetables AND meat/meat alternatives).
• Tomatoes classified as vegetables (culinary), but botanically, they are fruits.
• Fats and oils are not considered a food group, even though healthy fats are essential.
• Milk alternatives (e.g., almond milk) must be fortified with calcium (≥100mg per 100mL) to be a proper dairy substitute.
Slide 69: More on the AGHE and Dietary Intake Assessment Methods
• Further discussion on dietary assessment methods in upcoming tutorials.
• Students will learn how to apply dietary guidelines in practical settings.
Slide 70: End of Lecture – Thank You!
• Conclusion of the lecture on Nutrition for Exercise and Health.
• Encouragement to use course materials and recommended readings for deeper understanding.