Ch.6 Investments
2 Broad Sources of Uncertainty:
Risk of general economic conditions (Market Risk)
Inflation and interest rates
Risk to a specific company
Management decisions and competitive pressures
To construct a risky portfolio ---> understand how asset return uncertainties interact.
Bonds do better than stocks in the mild and severe recessions
Expected Return on each fund = probability-weighted average of the outcomes
Mix of Stock and Bond:
0.4 = percent of stocks
0.6 = percent of bonds
11% = ?
15% = ?
In this scenario, portfolio volatility is lower that either component fund
Stocks and bonds are balanced because of their inverse relationship during a recession
Covariance:
COV = (X1 - X2)(Y1 - Y2)
X1 & Y1 = individual returns
X2 & Y2 = expected returns (mean)
Product shows whether the deviations move together and by how much.
3 Rules of Risky Asset Portfolios:
The rate of return on a portfolio is the weighted average of returns on component securities (portfolio proportions as weights).
The expected rate of return on a portfolio is similarly the weighted average of the expected returns on component securities (portfolio proportions as weights).
The variance of the rate of return on a two-risky-assets portfolio is (see book formula) where p(bs) is the correlation coefficient between the returns on the stock and bond funds.
Assess benefits from diversification by using rules 2 & 3 to compare the risk and expected return of a better portfolio and benchmark.
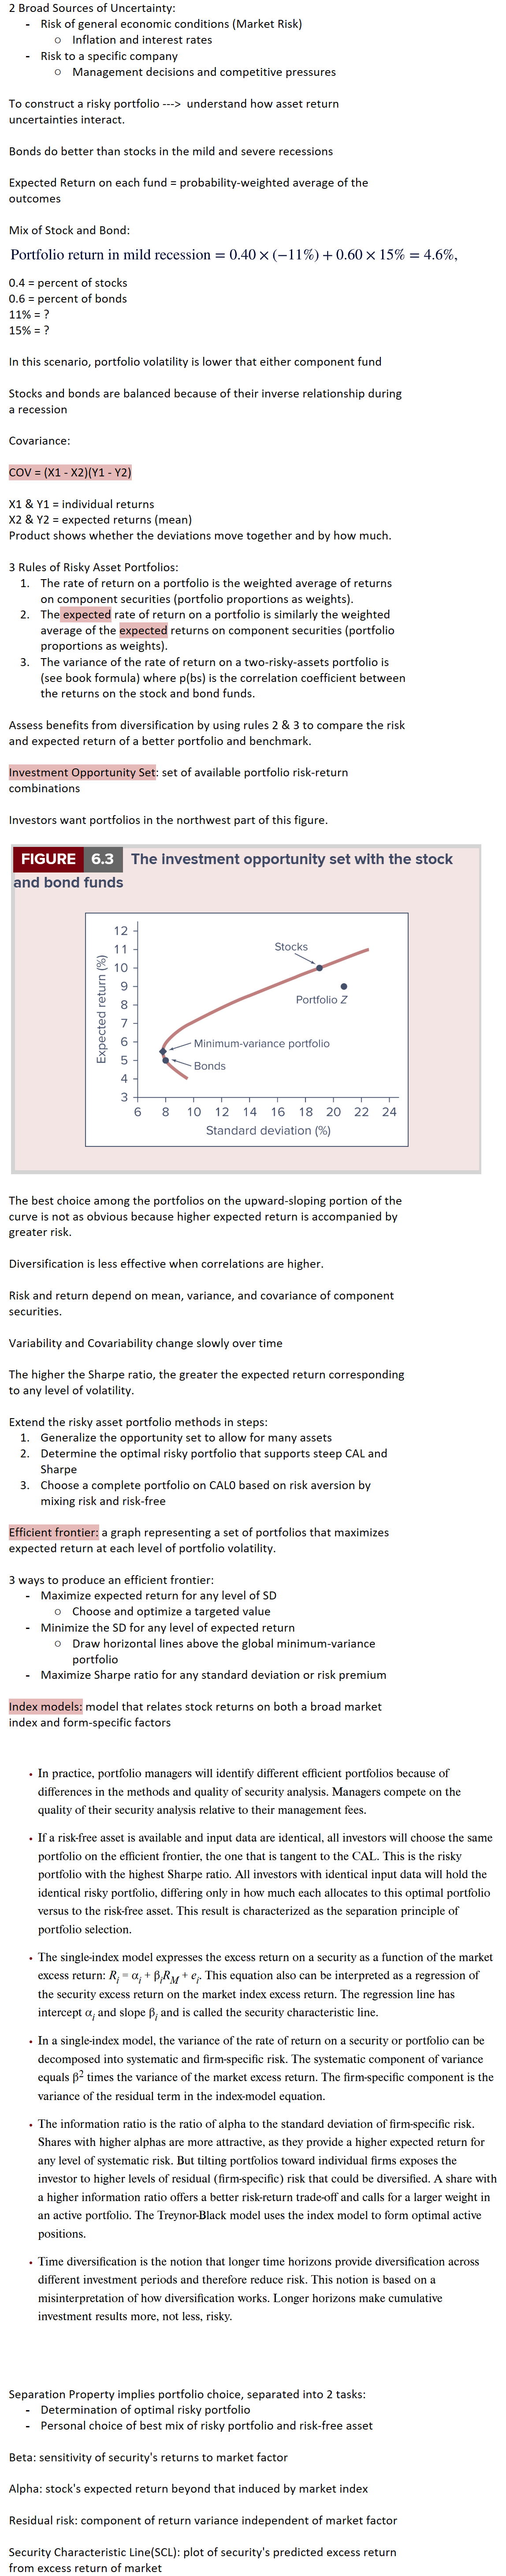
Investment Opportunity Set: set of available portfolio risk-return combinations
Investors want portfolios in the northwest part of this figure.
The best choice among the portfolios on the upward-sloping portion of the curve is not as obvious because higher expected return is accompanied by greater risk.
Diversification is less effective when correlations are higher.
Risk and return depend on mean, variance, and covariance of component securities.
Variability and Covariability change slowly over time
The higher the Sharpe ratio, the greater the expected return corresponding to any level of volatility.
Extend the risky asset portfolio methods in steps:
Generalize the opportunity set to allow for many assets
Determine the optimal risky portfolio that supports steep CAL and Sharpe
Choose a complete portfolio on CAL0 based on risk aversion by mixing risk and risk-free
Efficient frontier: a graph representing a set of portfolios that maximizes expected return at each level of portfolio volatility.
3 ways to produce an efficient frontier:
Maximize expected return for any level of SD
Choose and optimize a targeted value
Minimize the SD for any level of expected return
Draw horizontal lines above the global minimum-variance portfolio
Maximize Sharpe ratio for any standard deviation or risk premium
Index models: model that relates stock returns on both a broad market index and form-specific factors
Separation Property implies portfolio choice, separated into 2 tasks:
Determination of optimal risky portfolio
Personal choice of best mix of risky portfolio and risk-free asset
Beta: sensitivity of security's returns to market factor
Alpha: stock's expected return beyond that induced by market index
Residual risk: component of return variance independent of market factor
Security Characteristic Line(SCL): plot of security's predicted excess return from excess return of market