

Math Notes Algebra 2 (2024-25)
~~~UNIT 1.1-1.2~~~
-CYU 1.1-
-4a. The Graph of a function y=f(x) is shown. Find f(-1)
f(-1) essentially means that the x of the f(x) {which is -1} is the X on the graph. So, we plot the point on -1 X. Because the equation is y=f(x), we know that the function must be on the Y-line. Thus, we draw a verticle line on the -1X point, and our value is where the line intersects with that line.
-5a. The complete Graph of a function y=f(x) is shown. The table shows some values for function f. Find the values to complete the table
We can find the missing values by plotting the inputs on the X line and seeing where the line intersects on the Y axis. One intersects with 1, 0 can only intersect with 0, and -2 intersects with 4.
-6a. The function N(t) gives the number of people in an auditorium, t hours after the doors open. Two hours after the doors open, are 108 people in the auditorium.
Because N represents the number of people and T means time, N(t) represents the number of people after a specific time. Thus, the equation would be N(2)=108
-7abc. The table shows some values for the linear function f. Identify the y-intercept of the Graph of f. Determine the slope of the Graph of f. Write an equation for f(x).
a. To find the Y-intercept, we have to look for the input of 0. This is because the output from zero is the y-intercept on the 0,0 point. In the table, we see that 0’s production is 10. Thus, the Y-intercept is 10.
b. To determine the slope of the Graph, we have to use the slope formula x-x/y-y. For a table, we take the outer numbers on each side (The first and last) and use those as our points. That gives us an equation of 2—2/16-4. Both subtractions make a positive, and 16-4 is 12, so we get 4/12. Simplify to a slope of 1/3.
c. The equation will be y=mx+b. We already know the slope and y-intercept, so we plug them in for y=1/3X+10.
-10. Give the domain and range of P(d).
There are 30 days in June and 100% of the course to complete. Thus, the range and domain will be (0 X 30) and (0 X 100)
-Interval 1.1 Notation-
cd For a set of numbers shown on the number list below, represent the set using interval notation.
Because the point is on an unclosed -4 and ends on a closed 11-point, the interval notation will be (-4, 11].
-1.2 Quick Check-
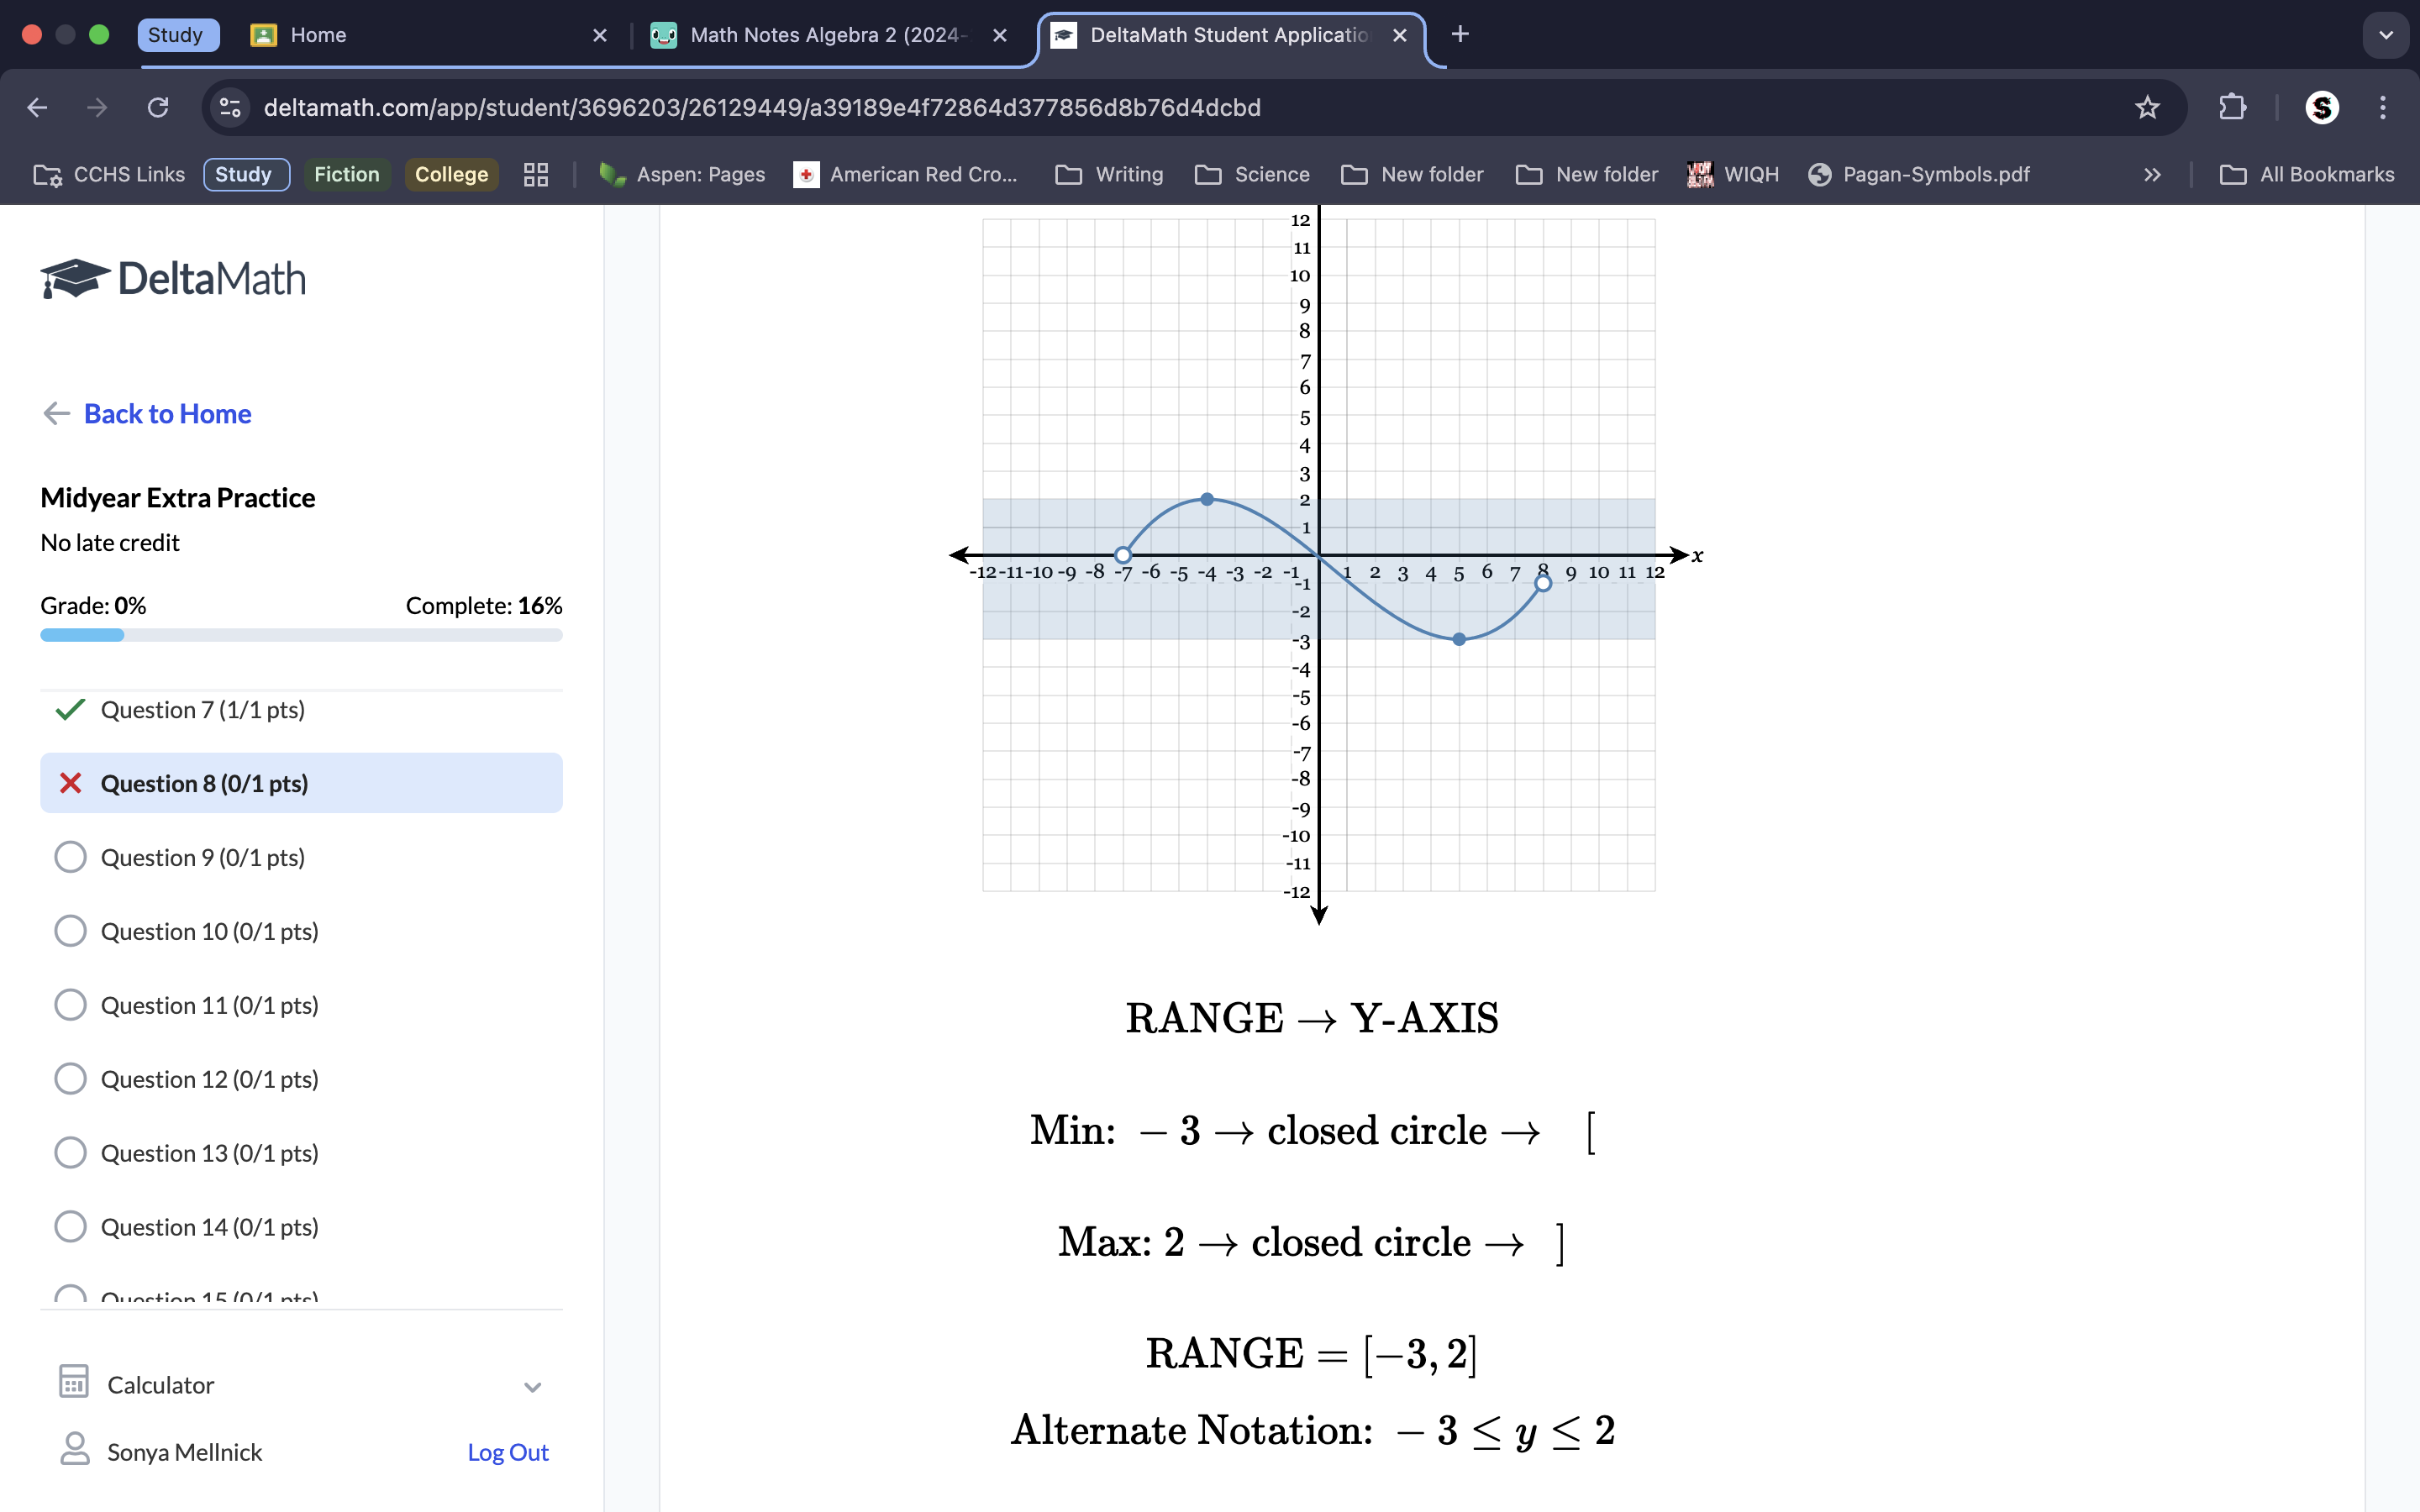
b, state the minimum and maximum values of the function over its entire domain.
The minimum and maximum points on the domain are the leftmost x point(minimum) and the rightmost x point(maximum). Thus, the minimum x point is (-8, -6), and the maximum x point is (9, 0).
-1.2 More Practice-
4a. For the Function defined by f (x)=16-x2, Use your calculator’s table option to help fill out the outputs in the table above.
Using the TBLSET function on the calculator would be best to get the table values. First, press the Y= button and type in the function on your calculator [(16-x2 )]—press graph. Press the 2nd Graph to get the TABLE. Move the arrows to see all your points. Then press 2nd WINDOW to get TBLSET. Change the table’s settings to the number at which it starts on 1. Negative and Positive inputs of the same number have the same output.
6a. The Table below shows the temperature, in degrees Fahrenheit, as a function of the number of hours after 5:00 pm. What is the y-intercept of this function? What does it represent in the context of this problem?
The y-intercept is the output from the 0 input. Thus, the y-intercept is 68, according to the table presented. In the context of the problem, the y-intercept would represent the temperature. Since the Graph starts at 5 pm and goes from 5 pm, the y-intercept would be the temperature at or after 5 pm.
Quiz Review:
-4c. The problem claims that the postcard’s relationship has w(l) = the width of the postcard multiplied by the length since that’s how we calculate our width. The l remains long, so to get our formula (since we know l*w=A), we would use the formula Area=l*w(l).
-5b. Since x=the x in f(x), we would plug -1 into the f(x) formula. (-1-3)2 -2= 14. We can find what g(0) is since the formula for g is y=g(x), meaning that the Y value on the listed X value point is our number. Following the Graph, this makes g(0) -2. Thus, when we subtract f(x) {14} from g(0) {-2}, we get a final answer of 12.
-6ab. To get f(x)+g(x), we add the functions together because the problem claims that f(x) and g(x) equal their respective functions. Simplify 2(x-1) by distributing to get 5x-2+2x-2. Then, we combine the common factors to get a simplified answer of 7x-4.
To get f(x)-g(x), we do the same thing as above, subtracting from each other rather than adding. 5x-2-2x-2. 7x-4=3x, our answer.
-8. When we only have one poiInfinitynfinity, we use X>/<(depending on where the segment is going) other points on the line. When using interval, notInfinitynfinity uses (), not [].
-10. When using interval, notInfinitynfinity uses (), not []. Infinity also uses </>; other points are not classified as open circles or infinite use ≤/≥. The increasing intervals are from below 0 to 0, so we keep it with those points. The same applies to increasing intervals; we use interval notation to mark this, not inequalities.
-11a. Plug 4 in for X since the function is f(4). Absolute value lines don’t mean anything different; they make everything negative regardless.
-12ab. Because the function is f(x), a+c can be plugged in for X. Thus, 2a-4(a+c)can be distributed to 2a-4a+4c. Simplify and combine to get -2a+4c.
Plug the 6a-3b in for x since the function is h(x). -3(6a-3b). Distribute and simplify to get a final answer of -18a+9b.
15cde. Because we don’t have a direct function line, we must list all the points for the domain and range.
19f. Because there are multiple points on this line, we have to have the domain for each one.
~~~UNIT 1.3-1.5~~~
Ask about converting standard form into slope-intercept form
-CYU 1.3-
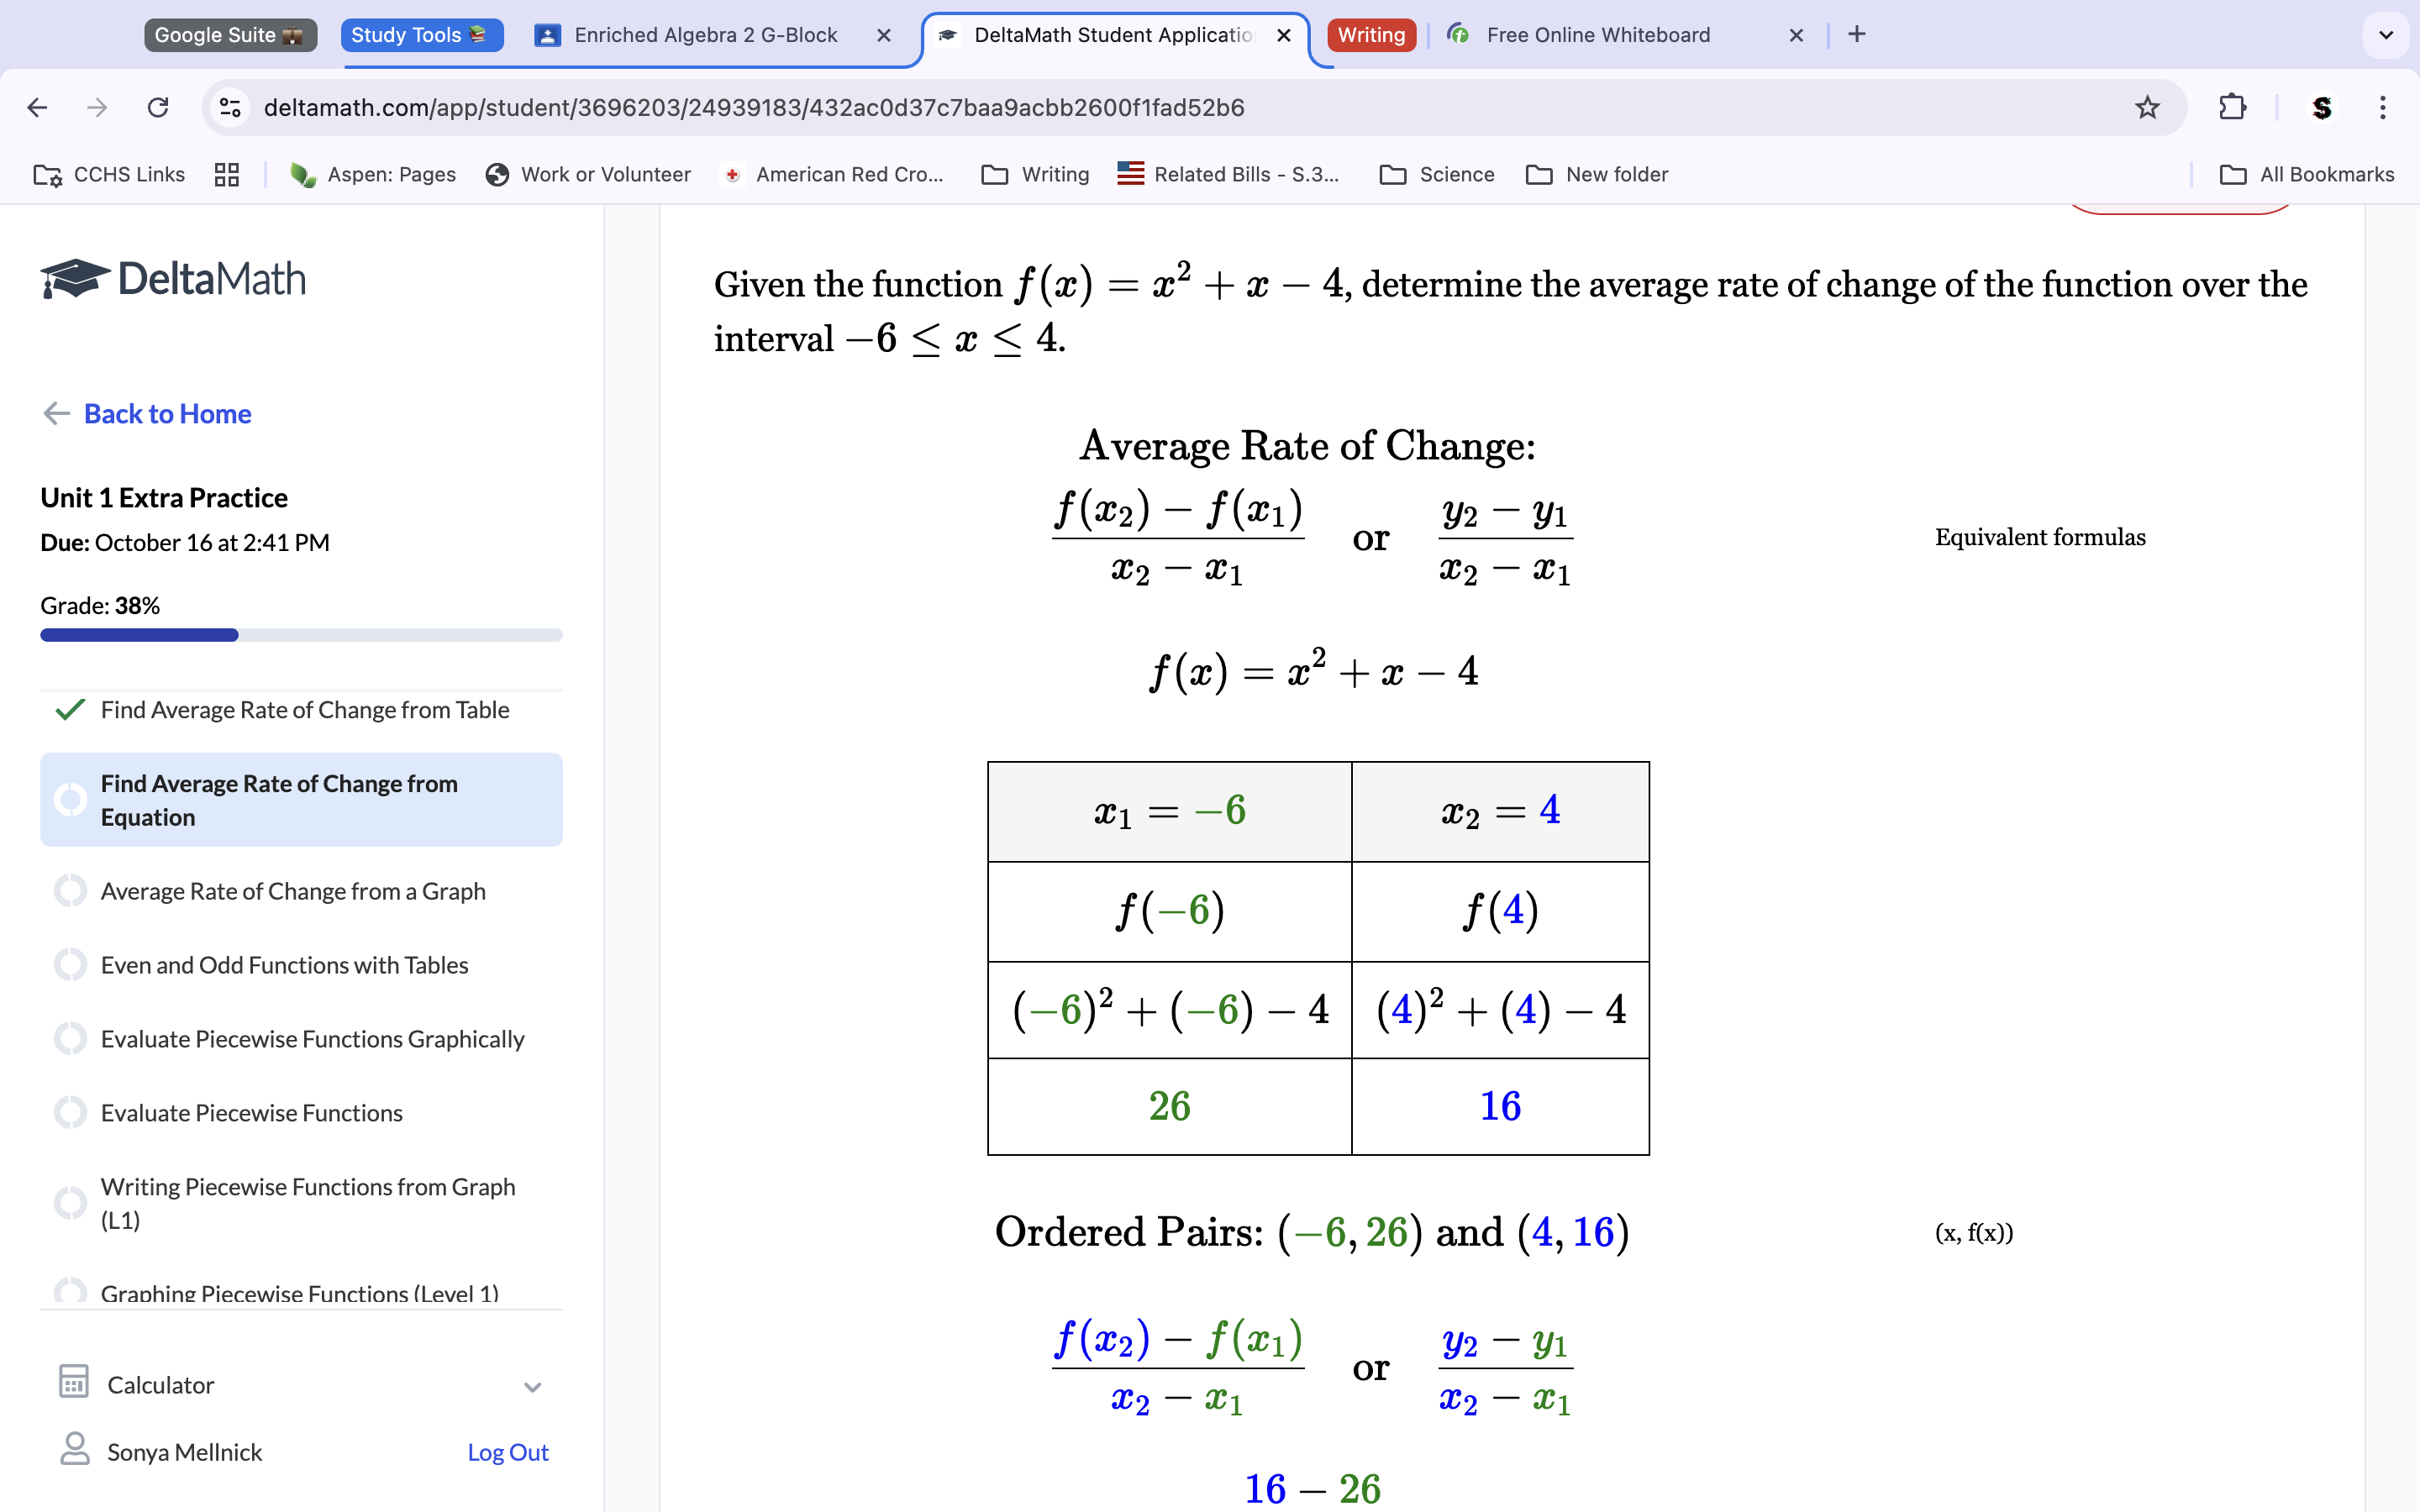
2. Find the average rate of change of f(x)=3x-8 between x=-7 and x=4.
Because x=-7 and x=4, we plug both X’s in our equation to get corresponding Y-POINTS. Remember , B=Y-Intercept, Y=Y points. When both X’s are plugged in, we get corresponding Y points of -29 and 4. Use the slope formula to get the average rate of change. Remember, -7 and 4 are your X points.
6b. Find a possible value for the number of people in line at t=6, given that the average rate of change of P between t=3 and t=6 is negative, but the average rate of change between t=5 and t=6 is positive.
To get a possible value, we use an inequality. We can find the values by doing slope form. T=3 has a y point of 85. We don’t know the T=6 point, so I’ll use t(6). We see both X points (3, 6), so we subtract them to get 85-t(6)/-3. Because the average rate of change between t=3 and t=6 must be negative, the top number must be positive, so t(6) can’t be over 85. For the second one, we do the same thing. The table tells us T=5 y point is 49. So, our final equation is 49-t(6)/-1. Because this slope must be positive, the top number must also be negative, meaning t(6) must be higher than 49. To get possible values, we put these two facts into inequality format. P must be more than 49 but less than 85. 49<p<85.
9. The graph of y=g(x) is shown. Order the following from least to g
Calculate the slope between each point on the given intervals for each problem using rise over run from each point on the given X intercept in the inequalities. Remember when slopes are harmful, and two negative numbers on a hill instead make an upbeat version of that slope. Order them from least to most lavish. Using this formula, the order is III, II, IV, I.
-CYU 1.5-
Fill in the blanks to write a piecewise equation.
If you buy 2 pounds or less, then the price is 9.95. If you buy more than 2 pounds, you pay 7.95. We already have the inequality laid out for us, so we know that the equation will be C(p)= 2 equations because there are two possible outcomes. The first is 9.95 if you pay 2 pounds or less. So, our equation will be 9.95 if 0<p≤2. This is because to pay 9.95, you must buy somewhere between 0 and 2 pounds. For the 2nd equation, it is 7.95 for over 2 pounds. So, our equation will be 7.95 if p>2. Put both into the complete function equation of C(p)= 9.95 0<p≤2, 7.95 p>2.
6. Graph y=f(x)
8bc. Does the club charge a higher hourly rate with two children than 1? If a family has more than two children, how much does the club additionally charge per hour?
The club does not charge a higher rate. This is because the shown function inequality uses ≤2, which means less than or equal to 2 regarding the first price. Thus, the number for 2 or 1 child is the same. The club additionally charges $4 an hour for more than two kids. The function shows an equation for 10 +4(x-2). X is equal to the number of children. Because we are asking for per child, we are essentially asking for the average rate of additional charge, where we can look at the slope in the equation, which is 4. Remember that asking for something usually refers to the average rate of change.
Point Slope Review. Graph the line y+4=-5/2(x+3) on the coordinate plane.
The function line tells us that the line has a point of (3, 4) by giving us those numbers on the y and x point segments of the equation. The line also provides us with the slope (-5/2), so use rise over run with the hill from the point (3, 4) across the entire Graph to get your line.
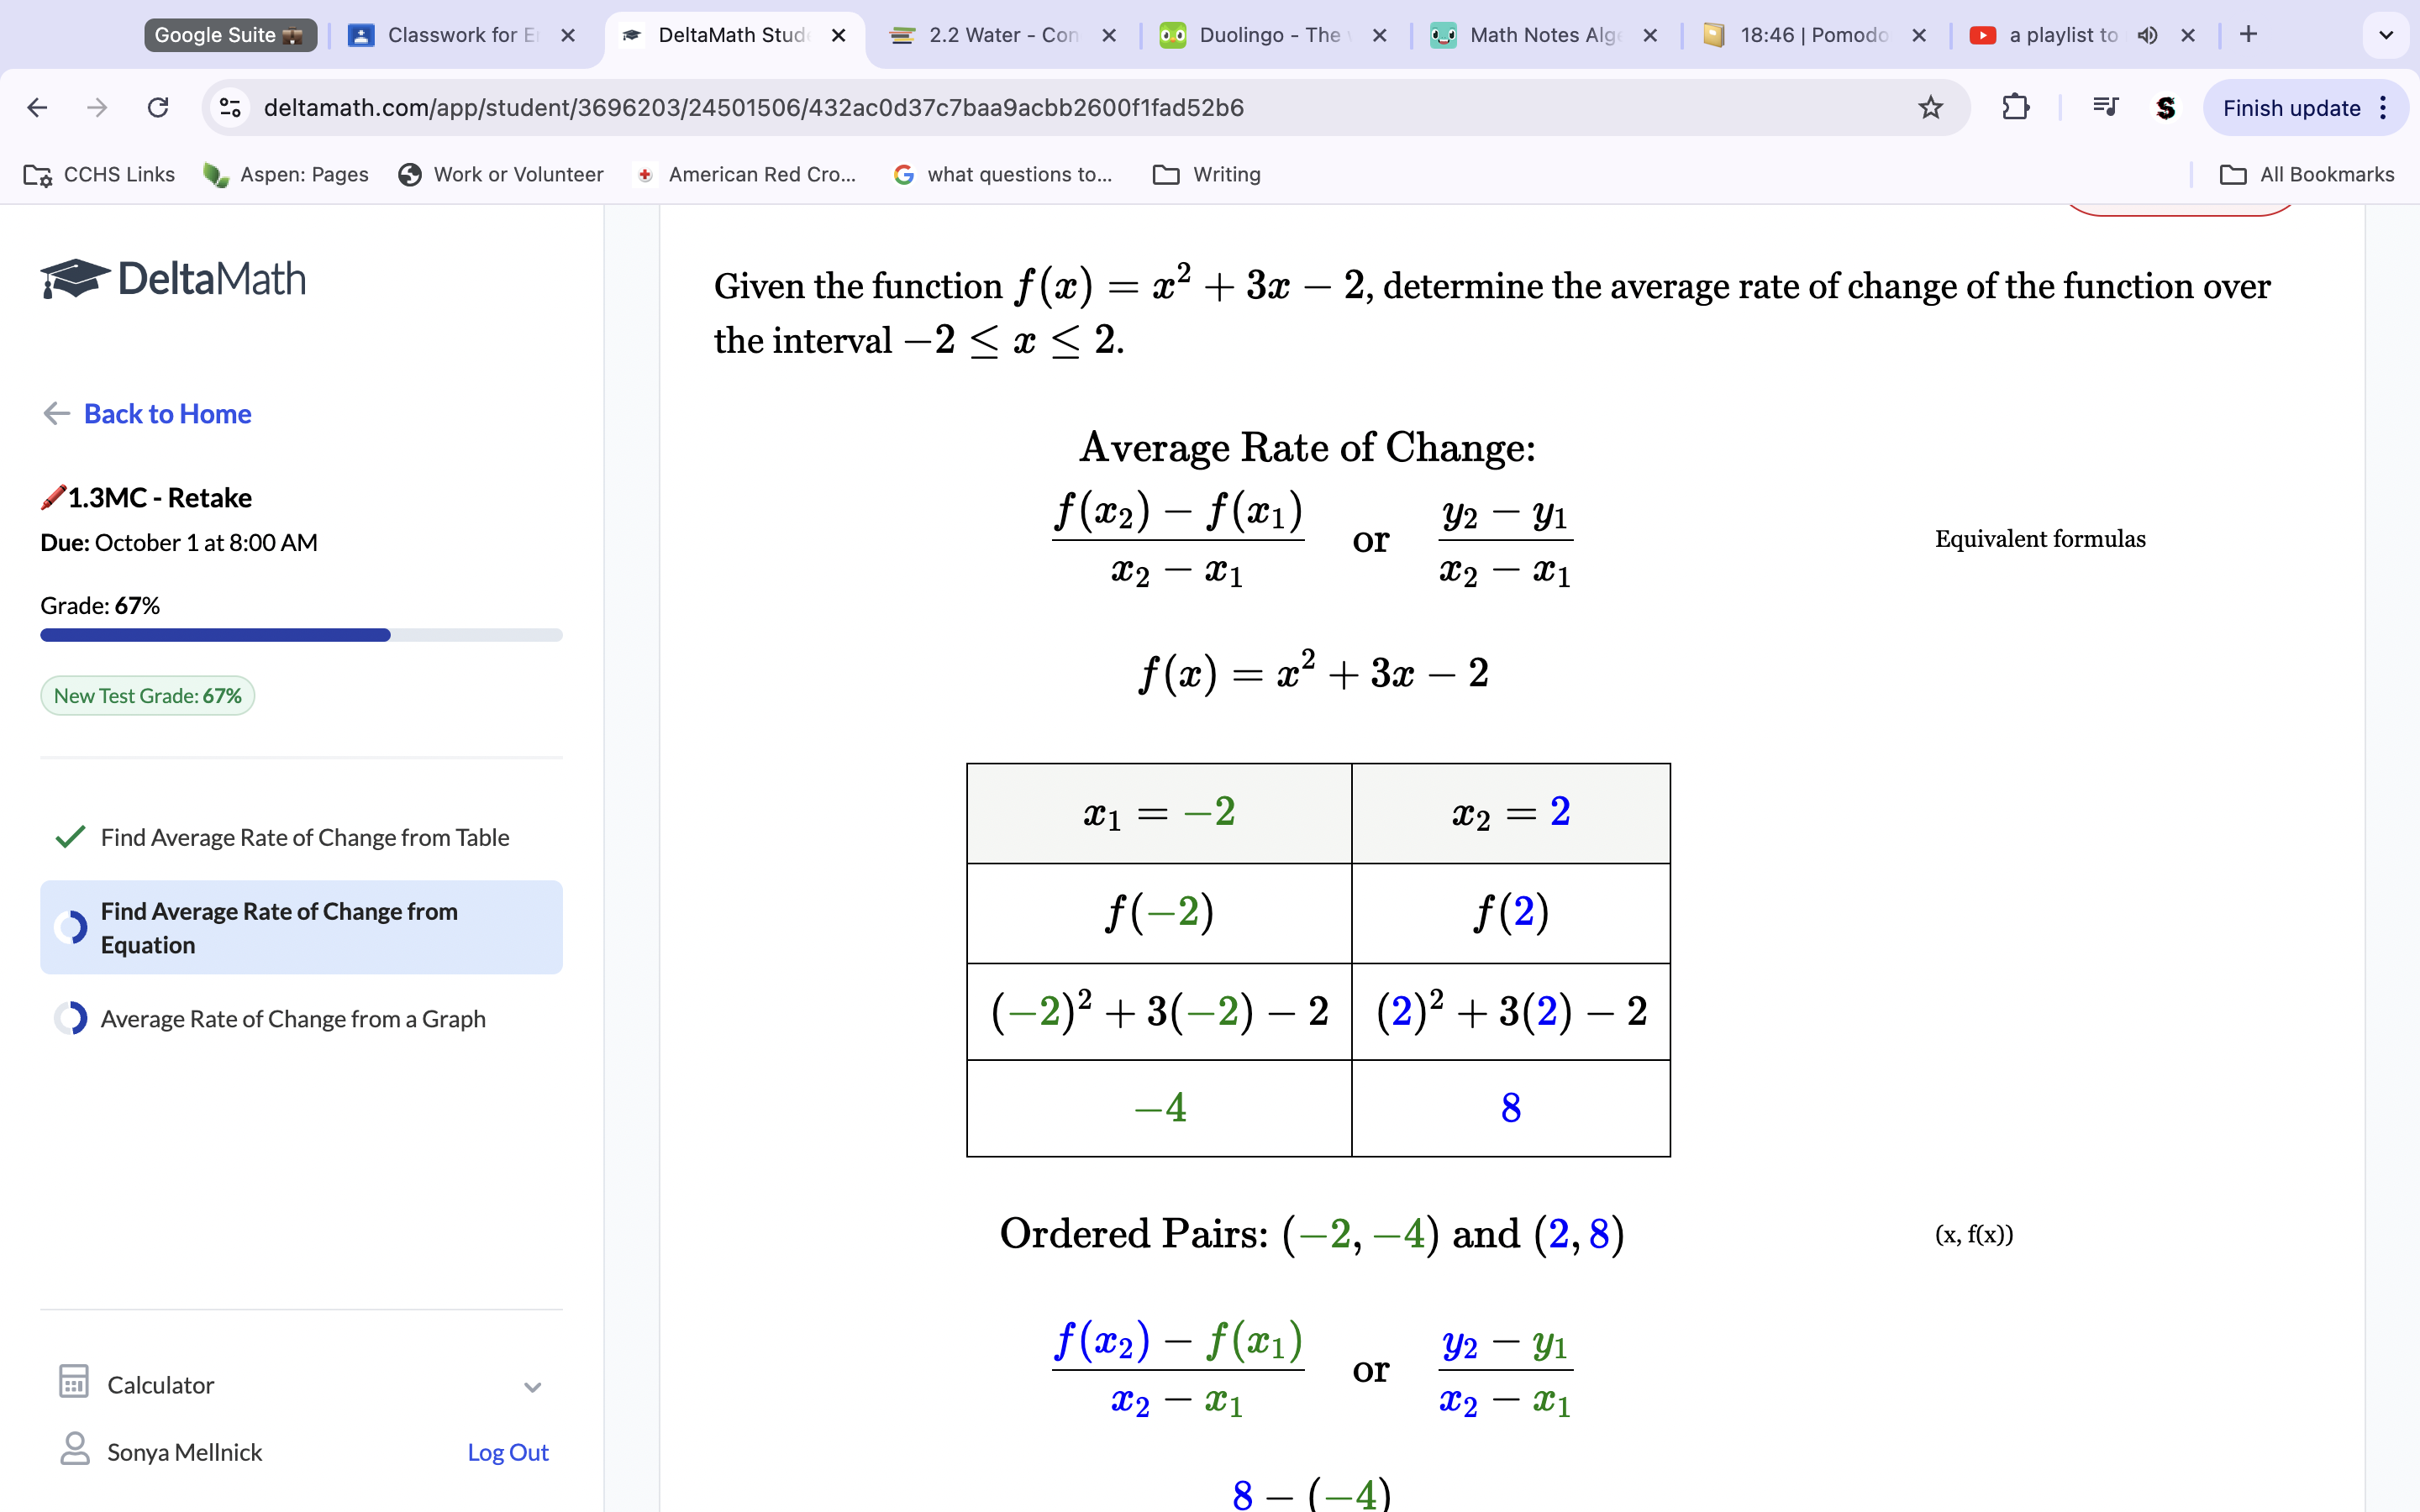
-Mastery Check 1.3-
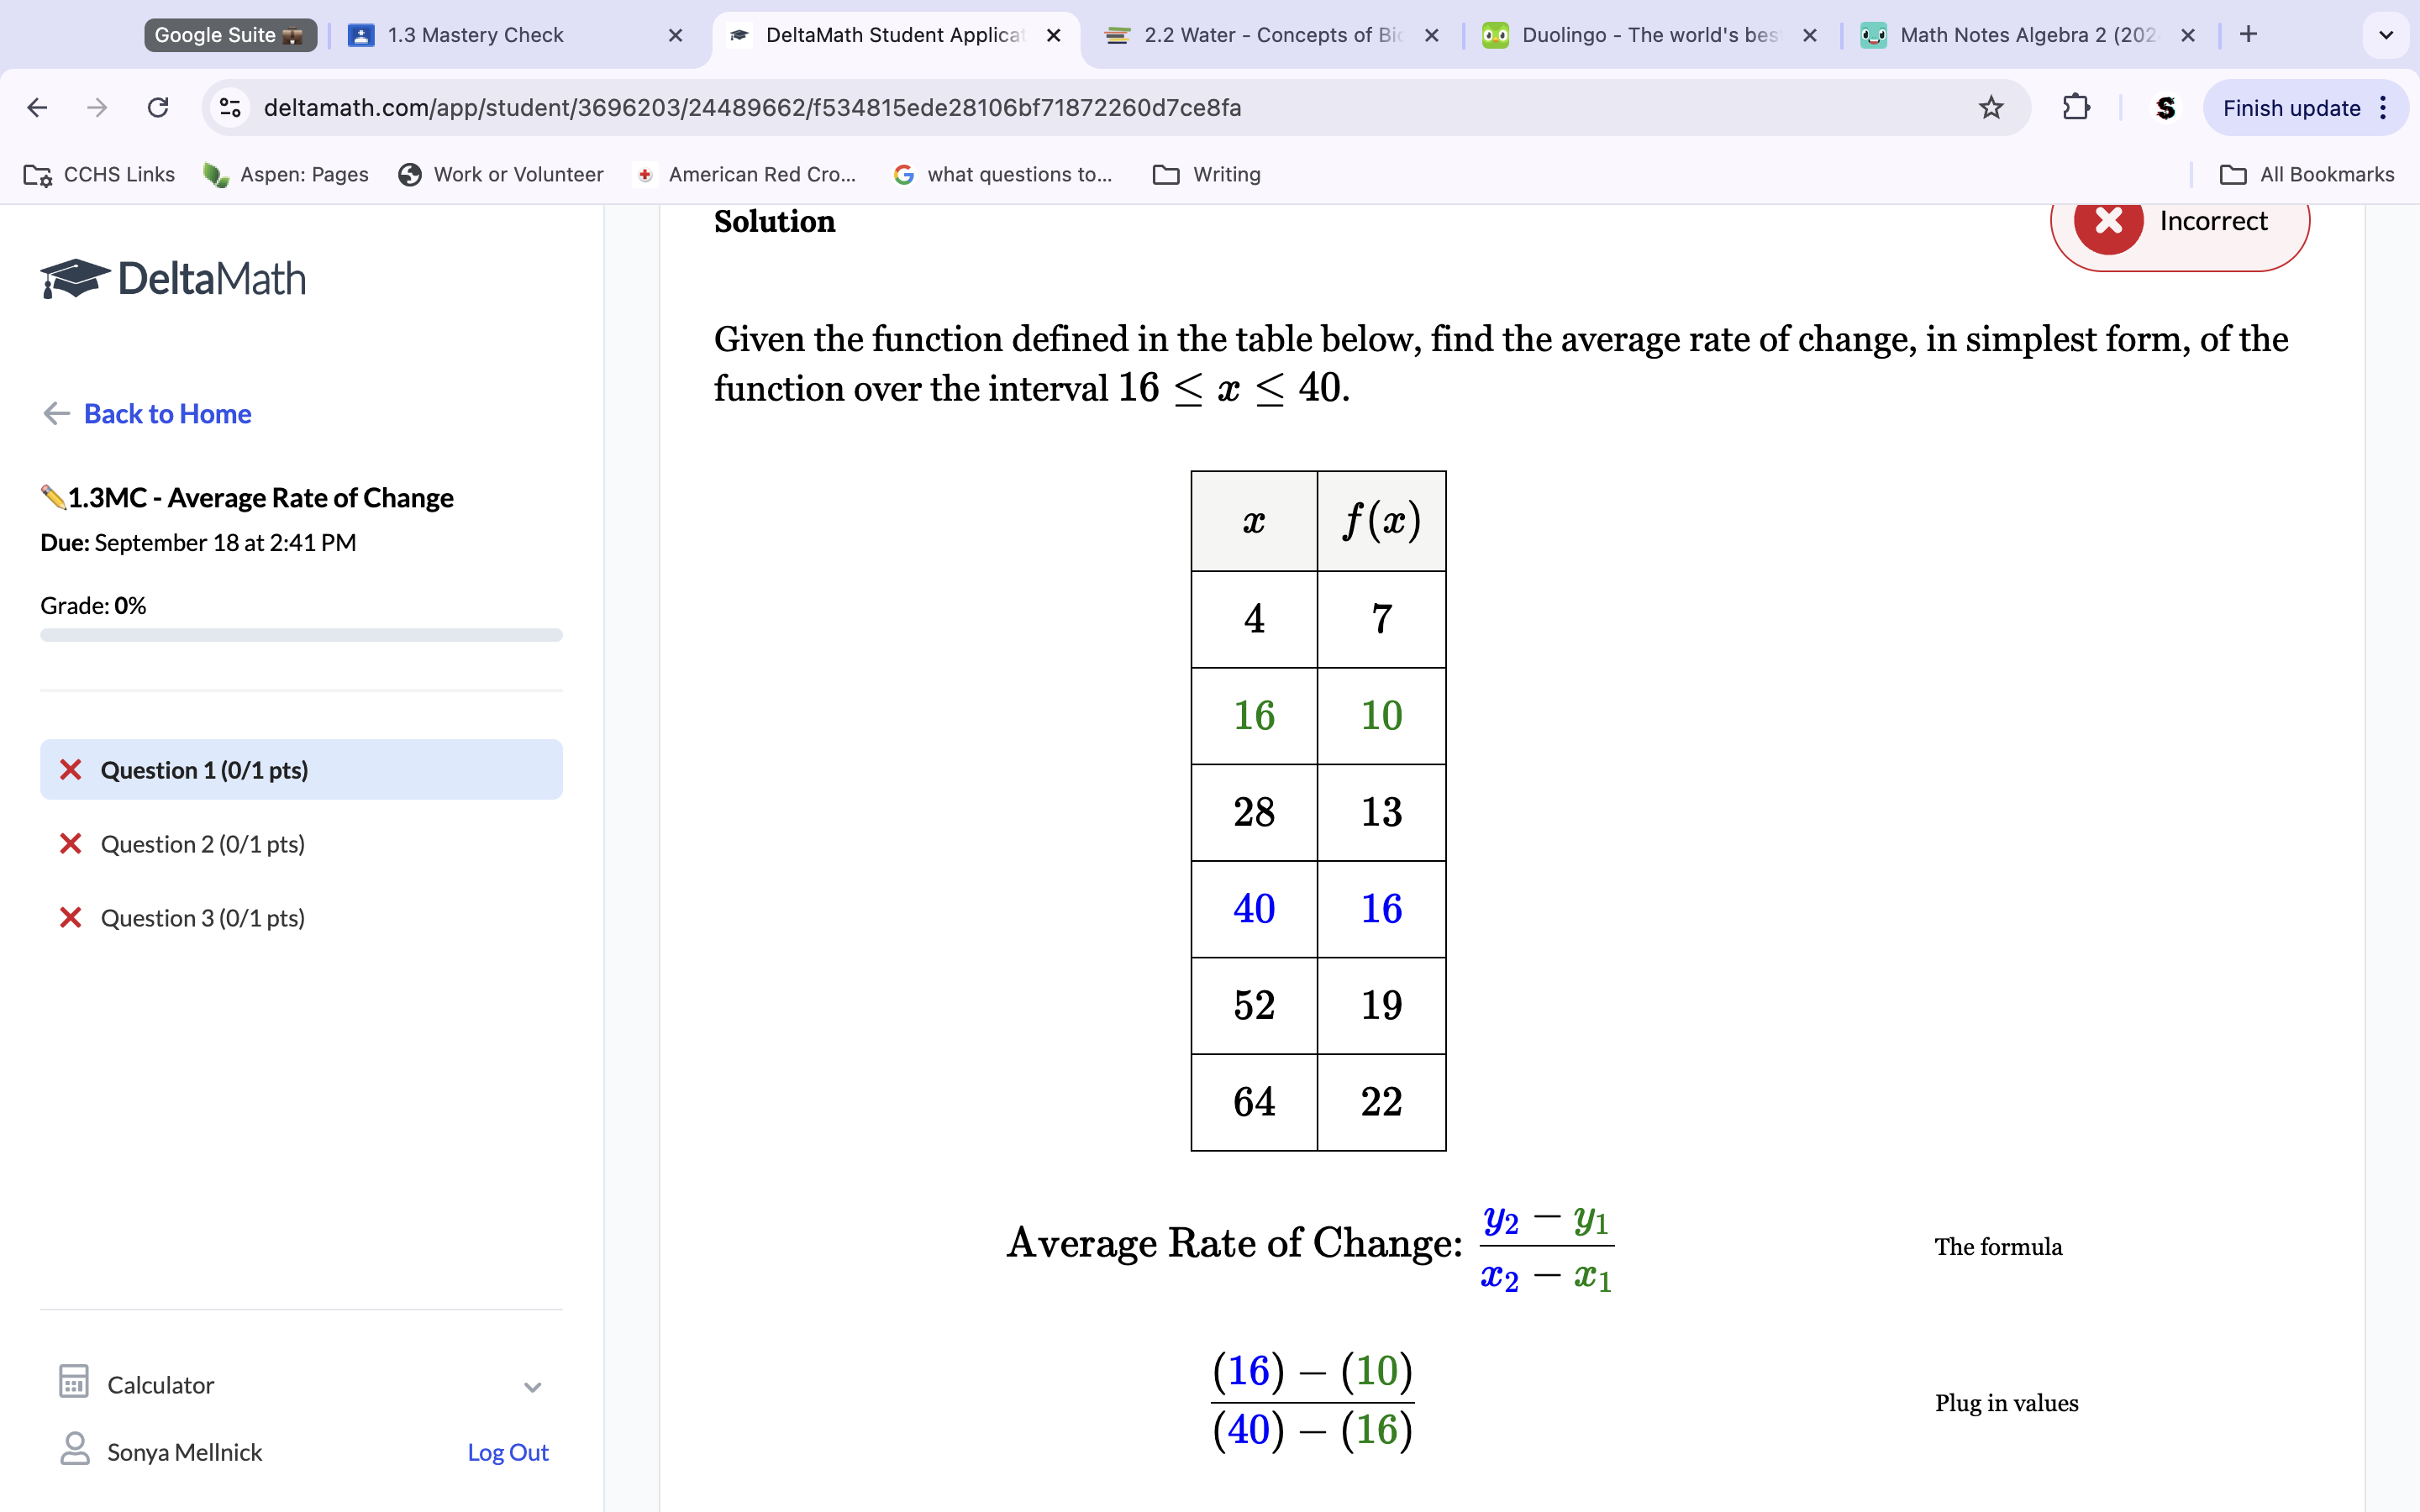
Always look for the side of the table with both numbers as X-intercepts. Find the corresponding Y-intercept by looking at each number’s corresponding point on the other side of the table. Use the slope formula to get the average rate of change.
Solution (1/4).
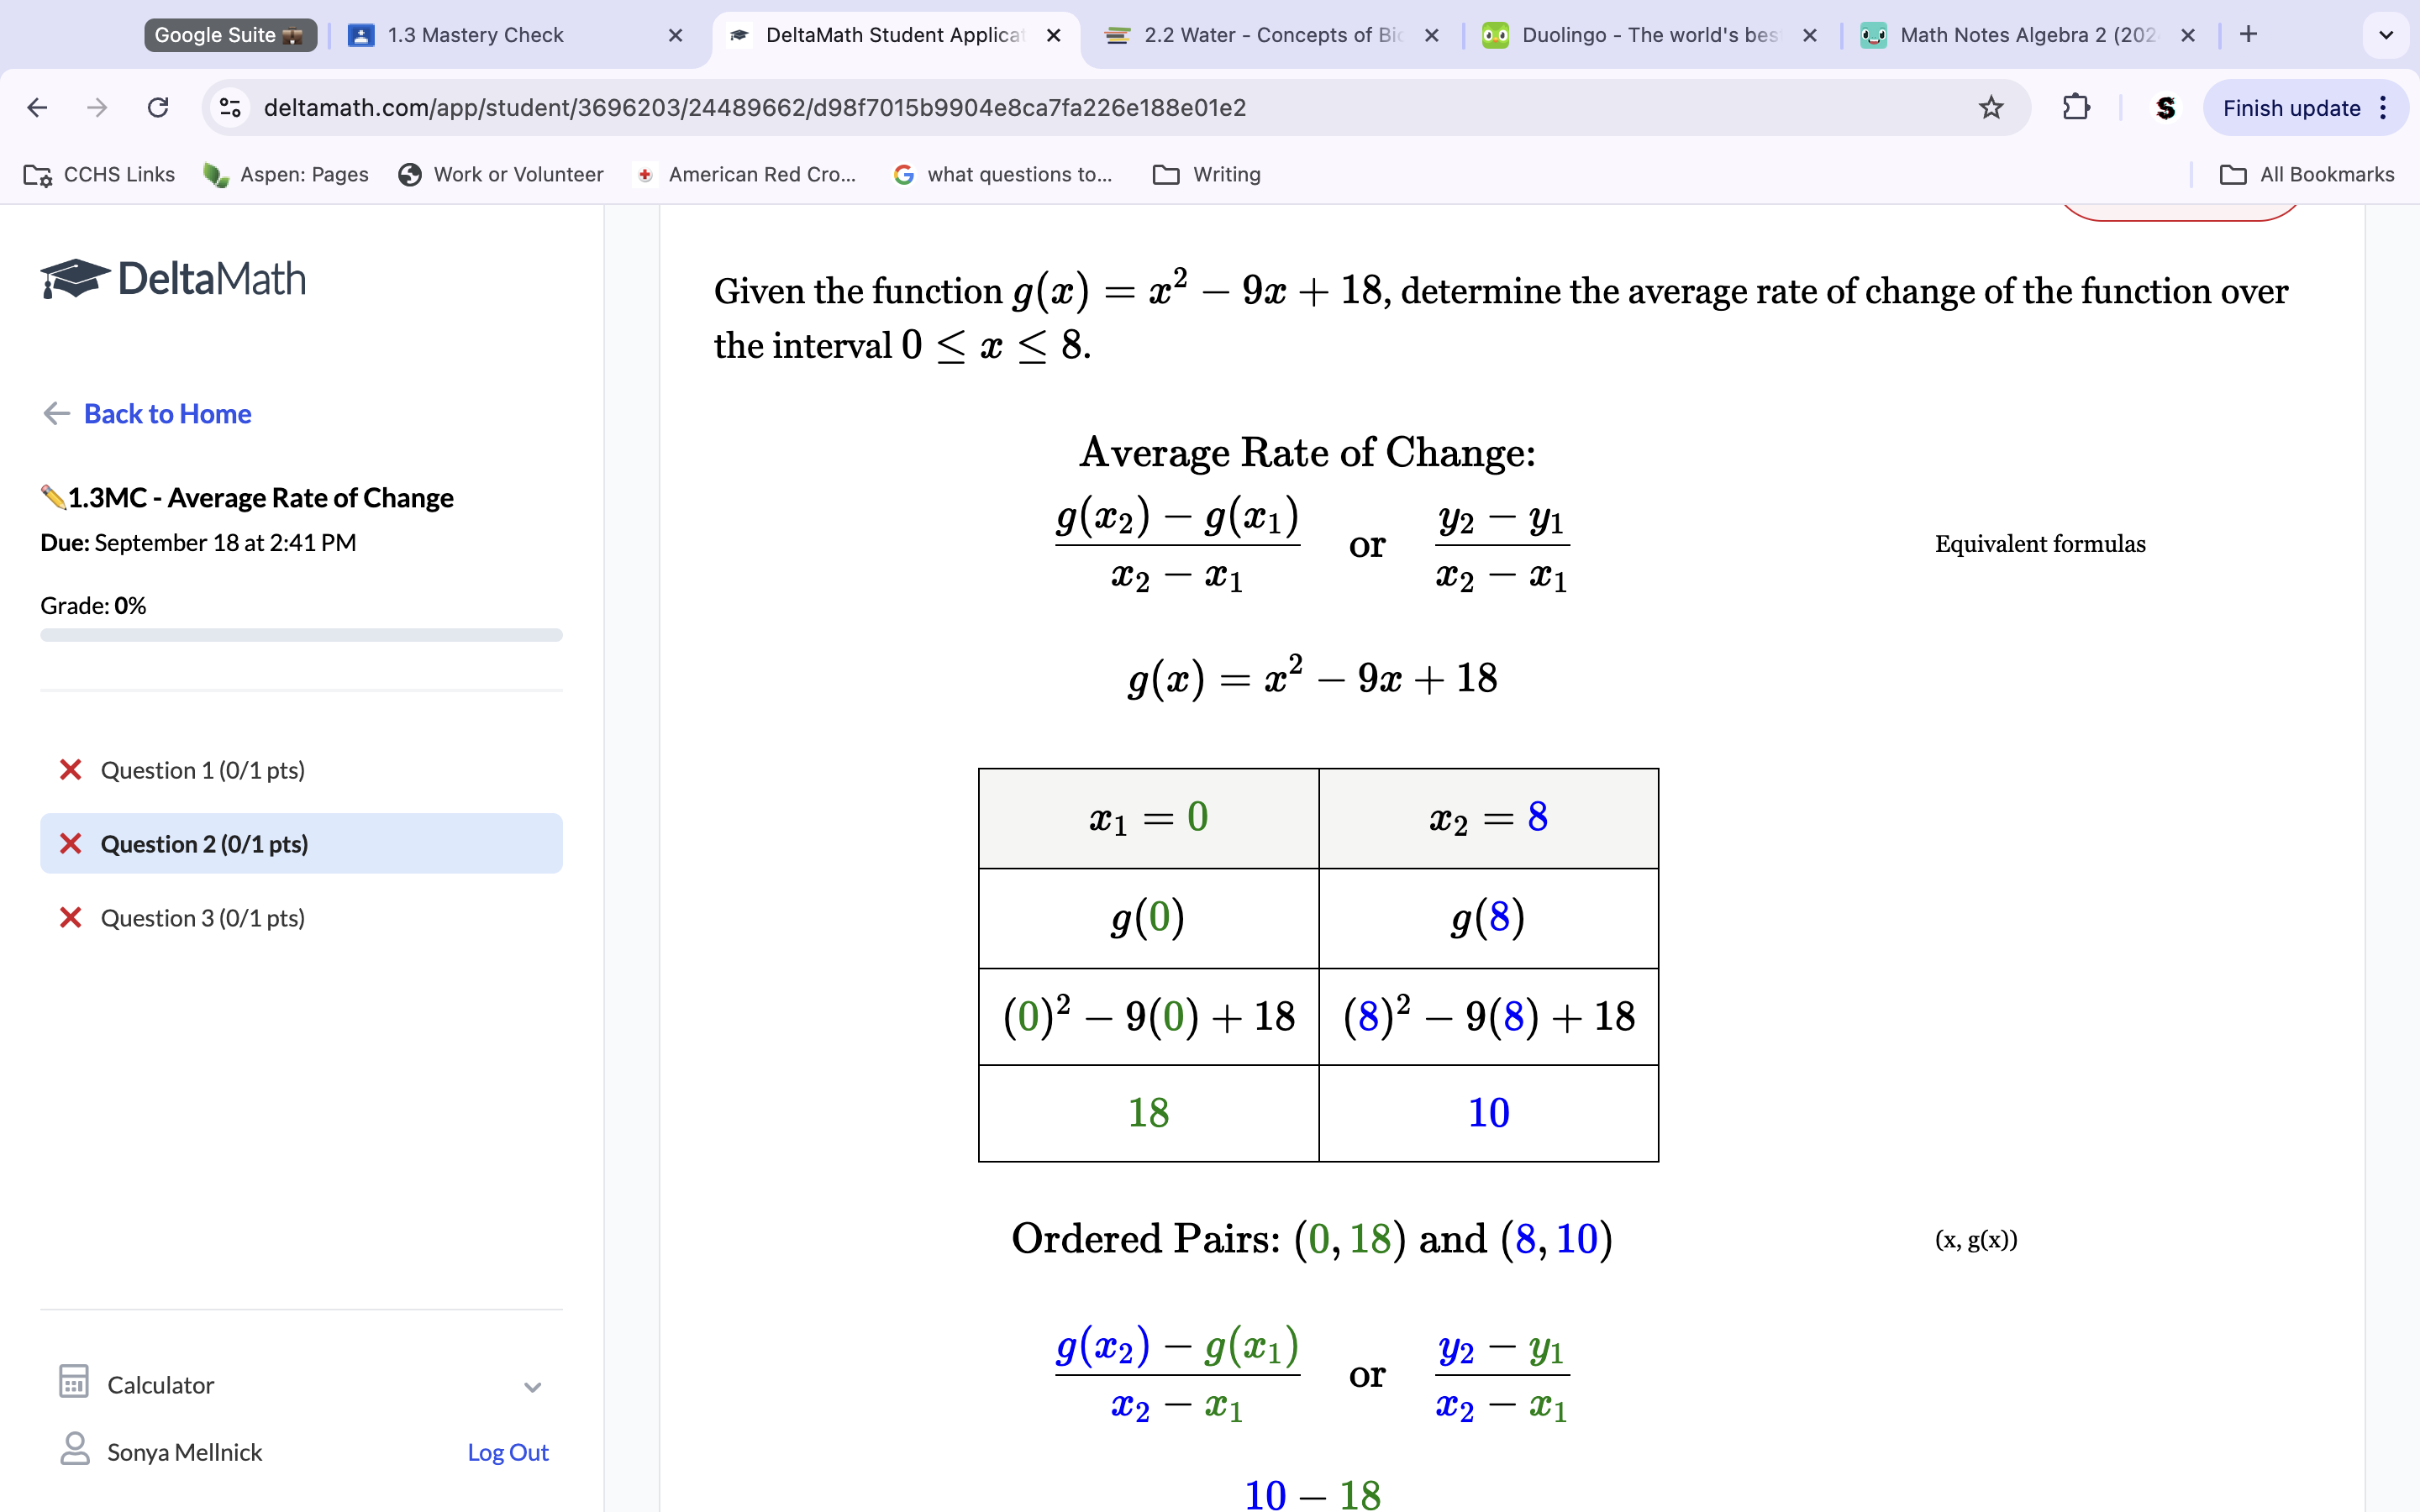
To get the average rate of change, we have to have both X and Y points; we know the X points are the numbers on the inequality, so we see the x points are 0-8. To get the Y points, plug each X into the equation separately to get the correlating y outcome for the X. This gets us points of 18-10. Use slope form rise/run to get slope/average rate of change.
Solution (-1).
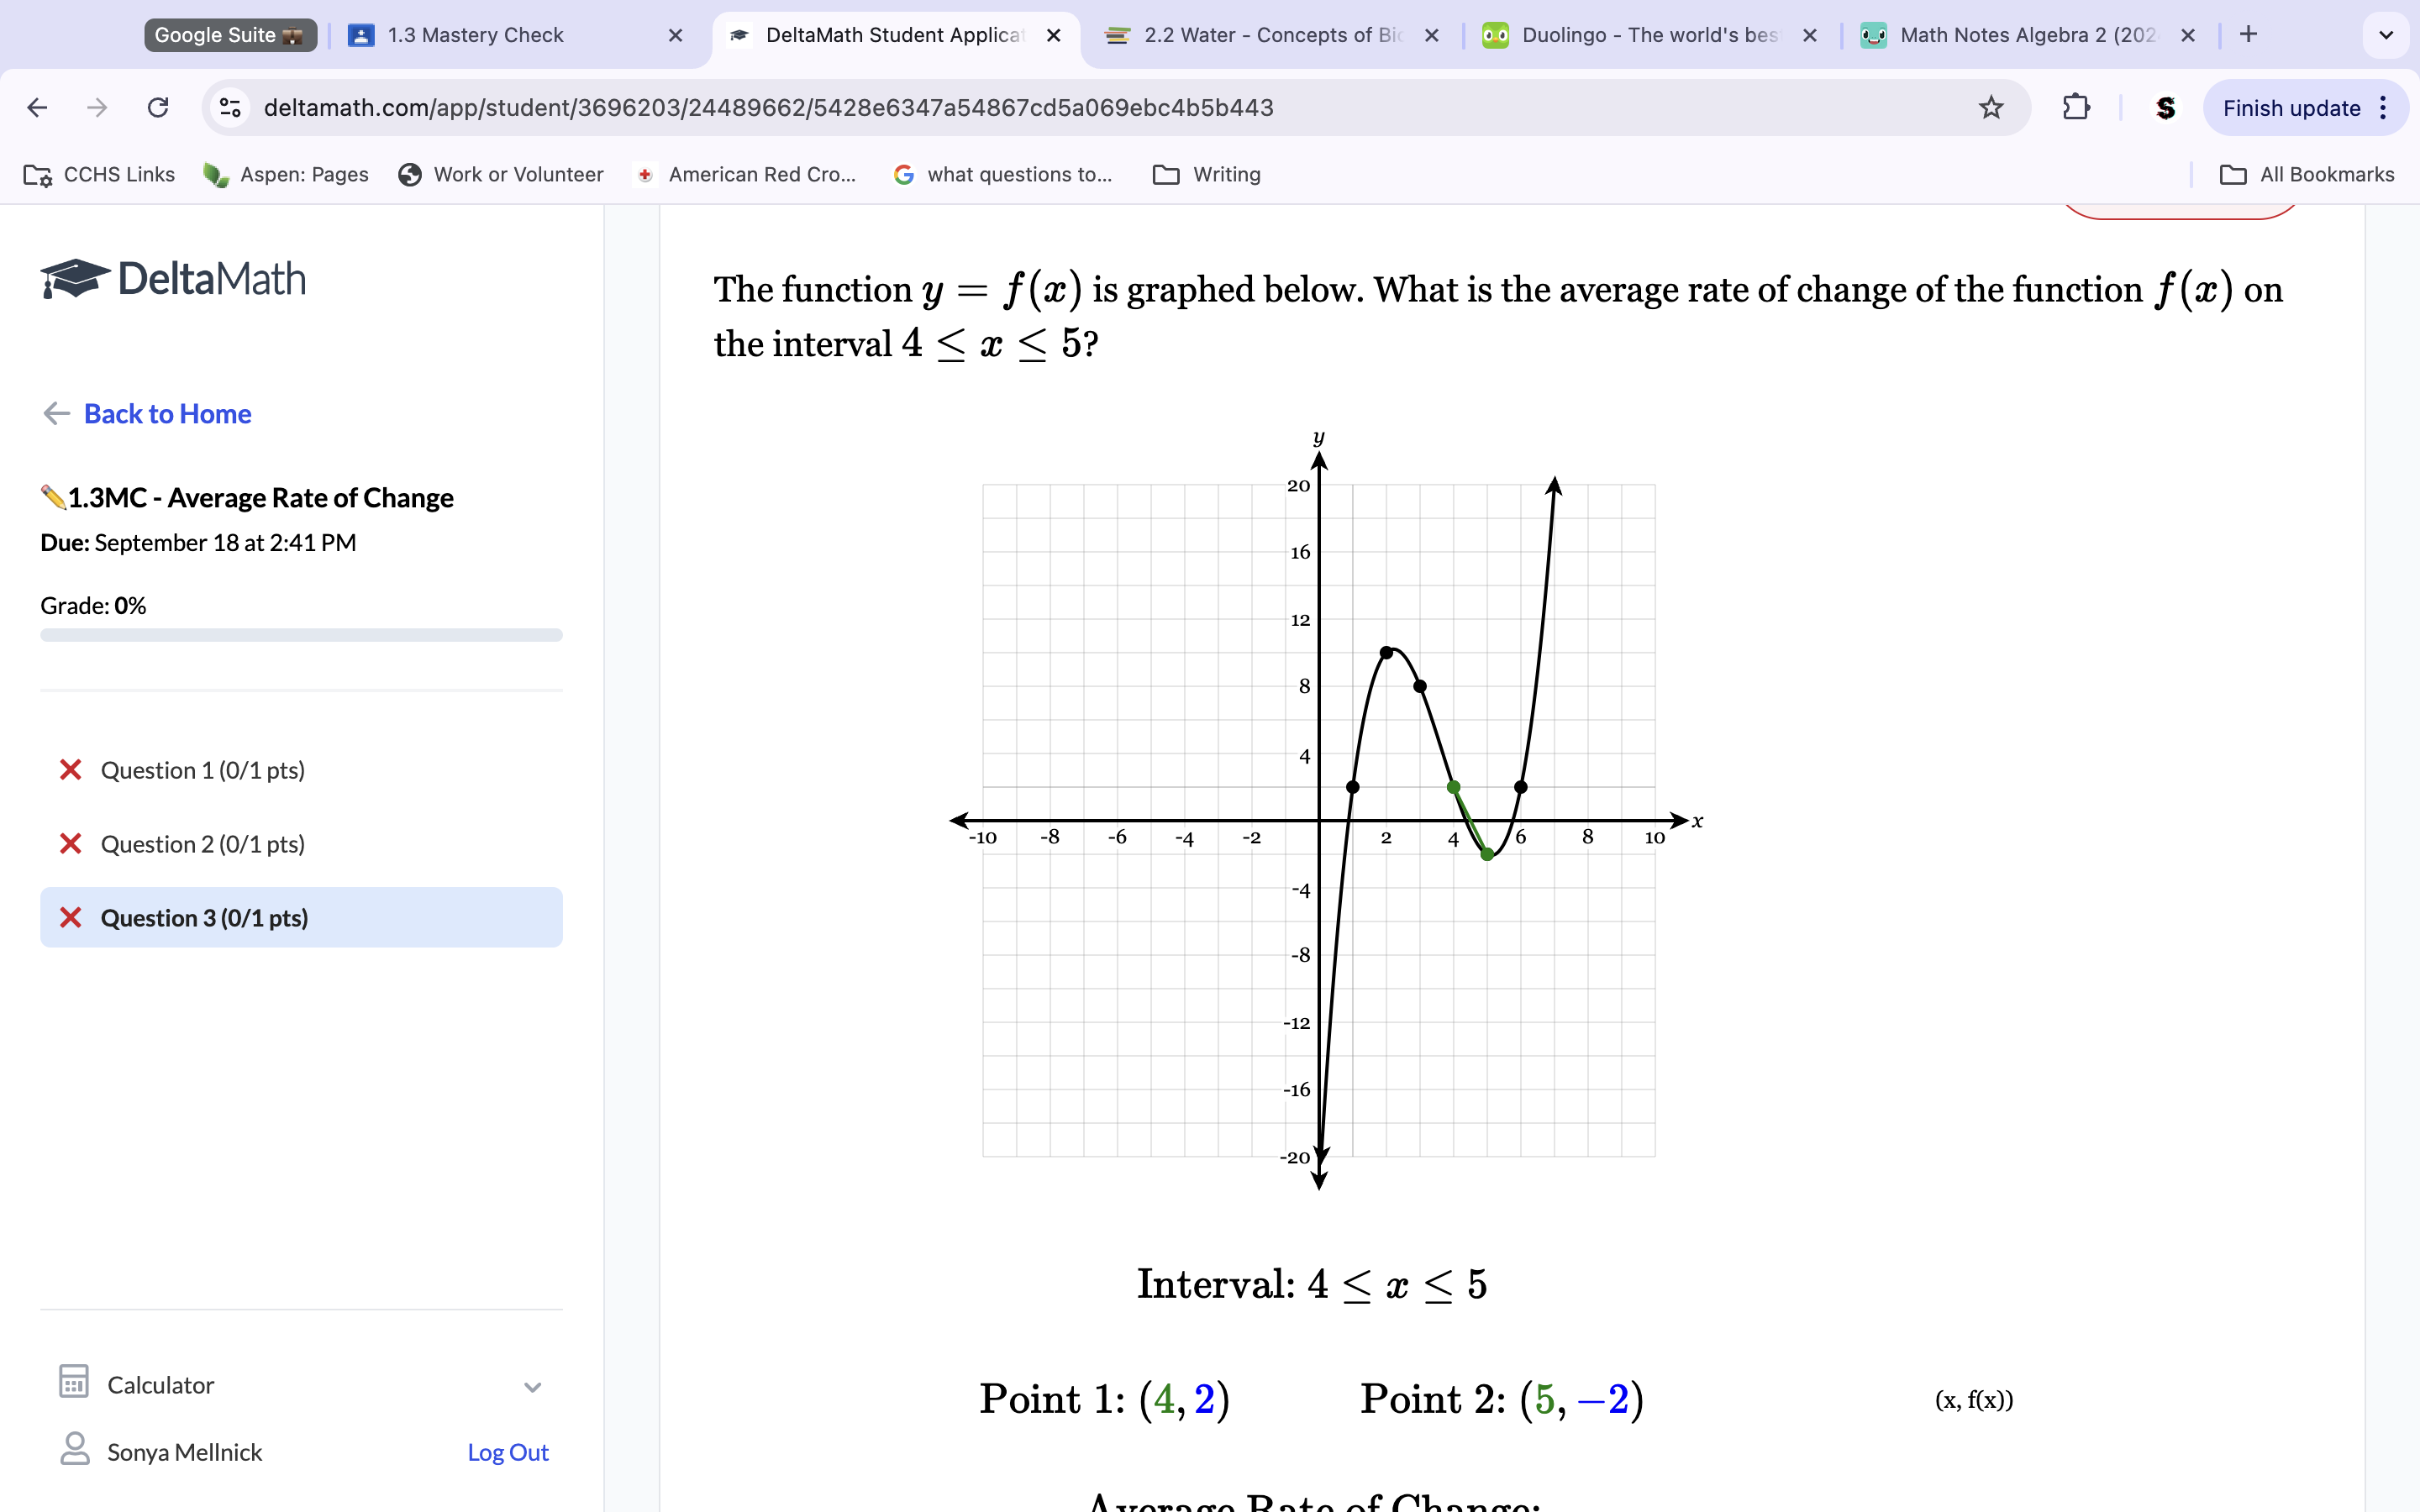
We know from the inequality the X points are 4 and 5. Find the points on the Graph for each X point to get the Y points. Look and see what their correlating y points are. These are your y points. Use the rise/run slope form to get the average rate of change.
Solution(-4).
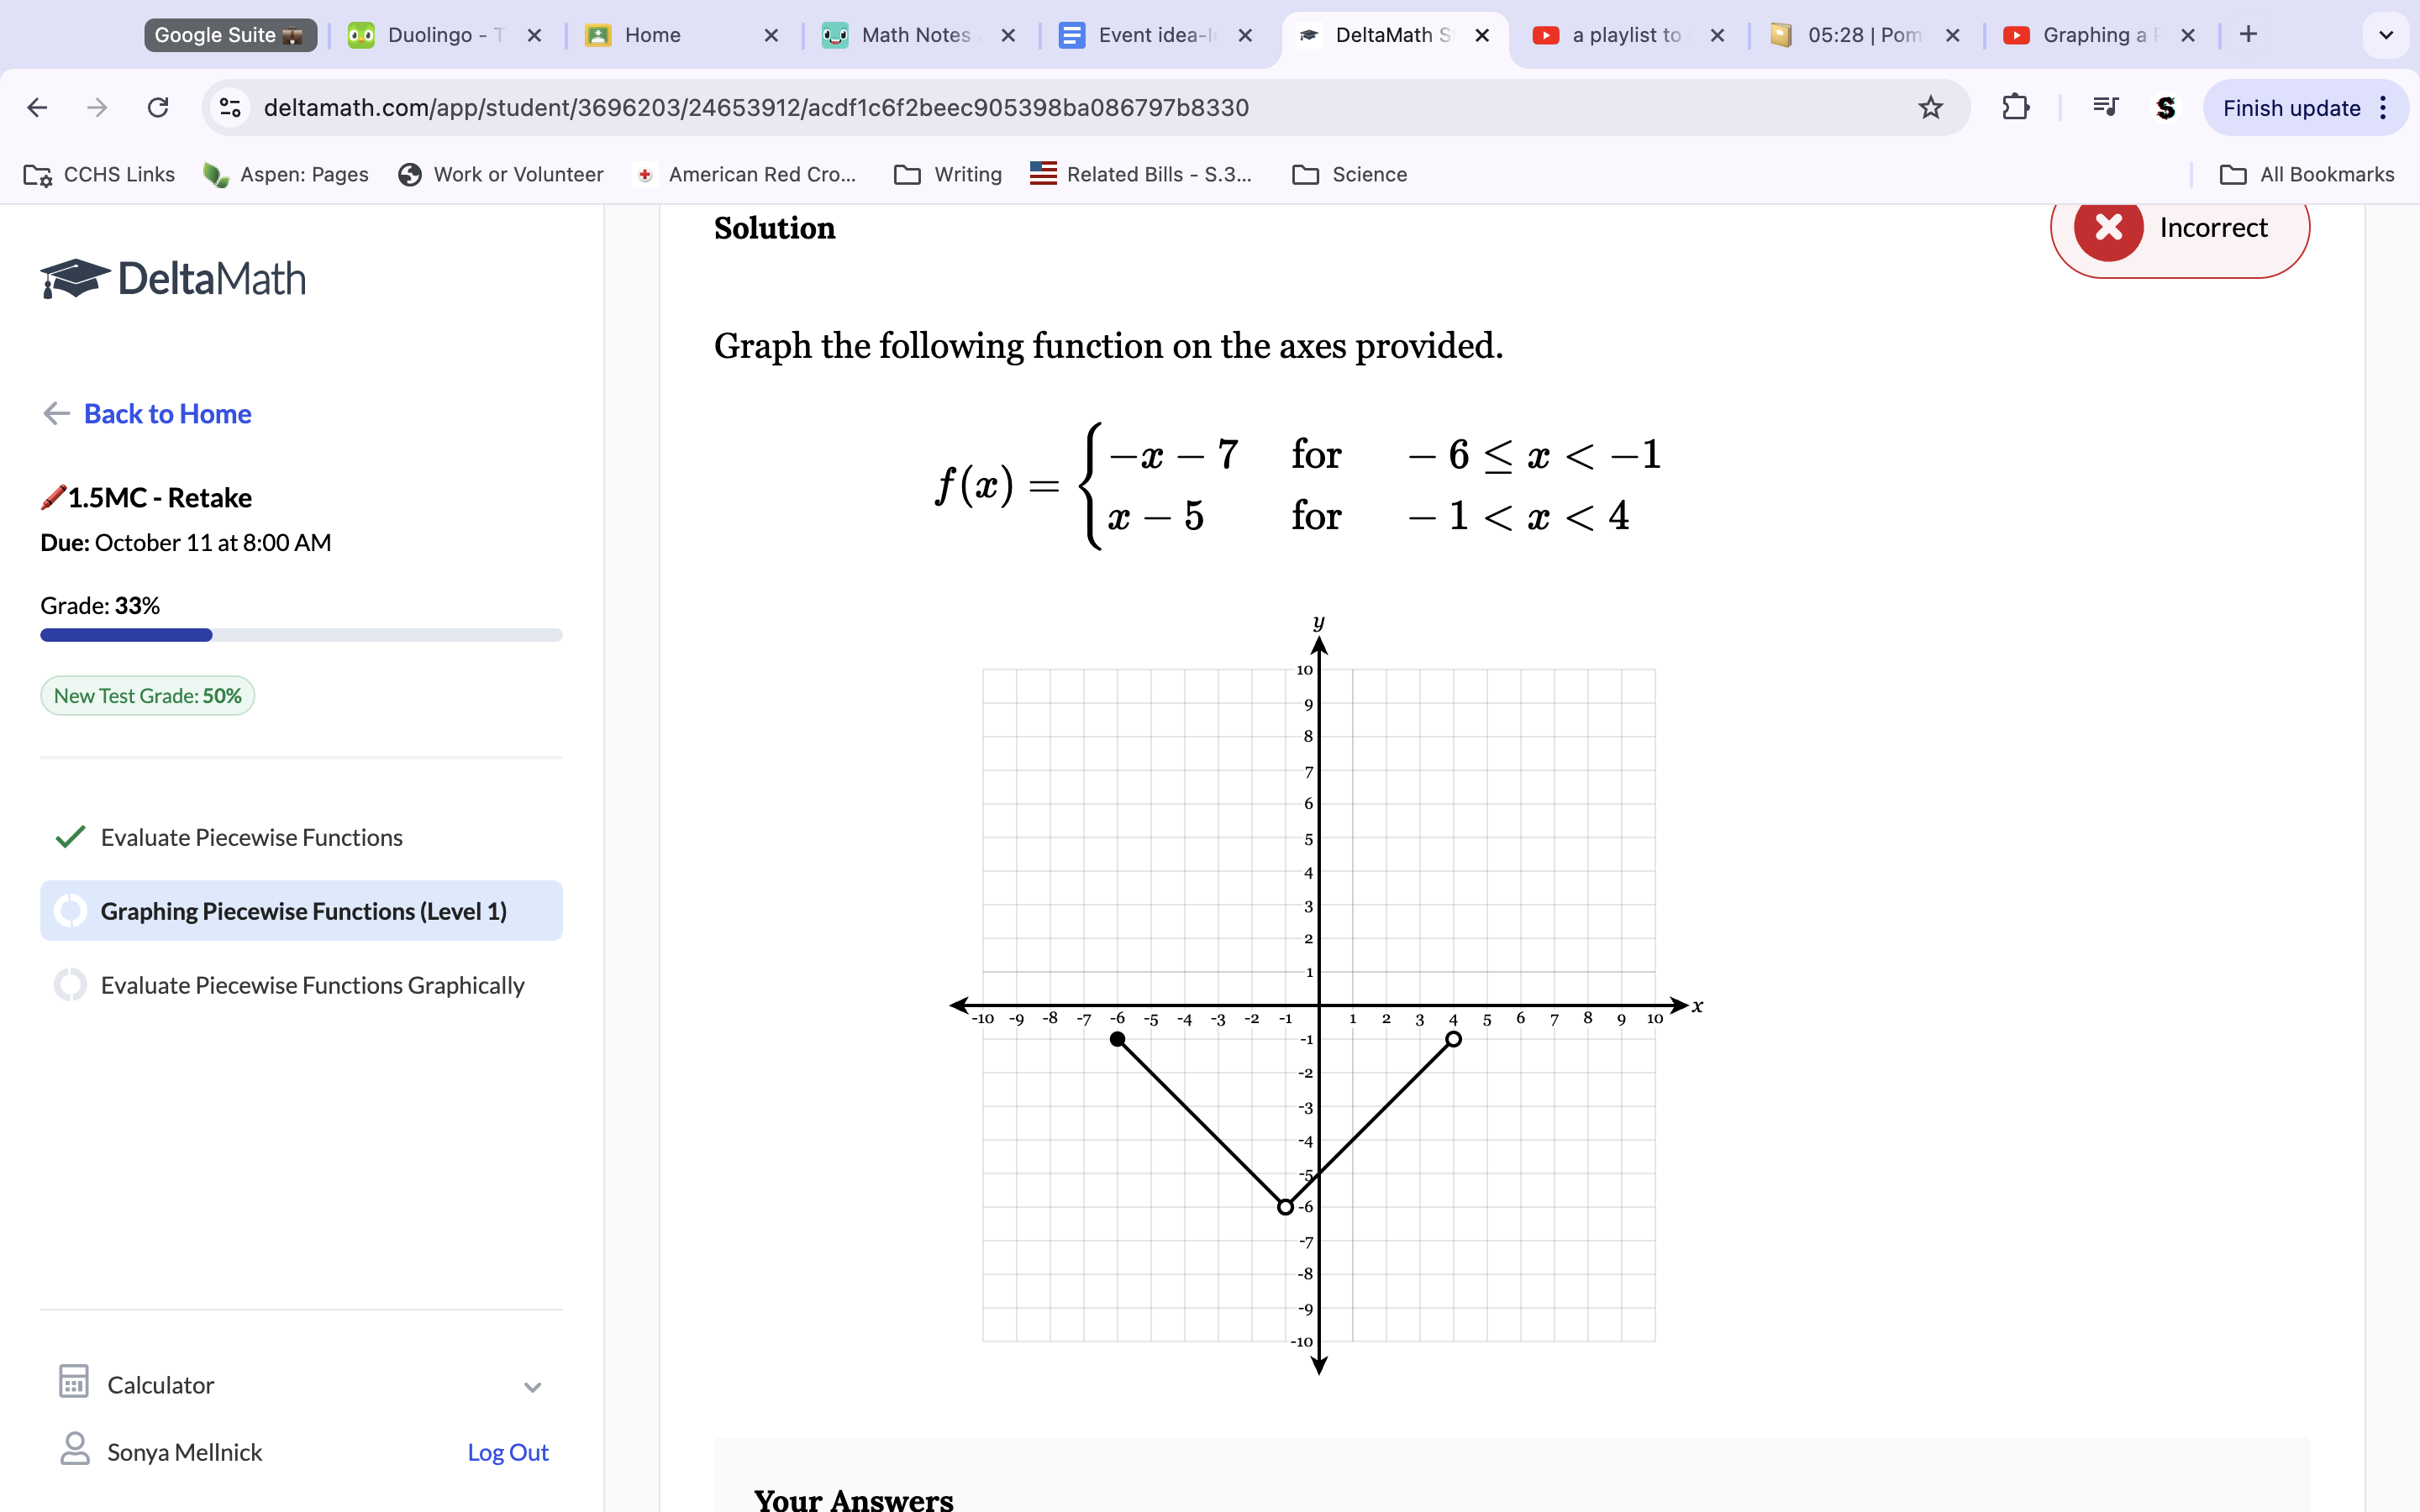
Plot a point at -7 y. Because the slope is -x(-1), go down one and correct 1. This is your line. Draw it across the entire Graph. Because the inequality is -6≤x<-1, the line is only valid between the x points of -6 and -1, so erase the rest of your line except for the space between that. Fill in circles as needed. In the second line, place a point on y -5. The slope is 1, so go up and right 1. This is your line. Draw it across the entire Graph. Because the line is only accurate between -1 and 4, erase your line except for those in between spaces. Fill in circles as needed.
To get the average rate of change, we need to know the y and x values. We know both the x values are -2 and 2. To get the y values, plug each X value (-2, 2) into the equation separately. The sum of the equation is the Y values (after plugging x’s in, we get y values as -4 and 8). Use the slope formula to get the average rate of change. -4-8/-2-2 —> -12/-4—→ 3/1—→ 3.
Solution (3). Use parentheses when using a double negative. Aka -6=x -x2 —→ -(-6)2
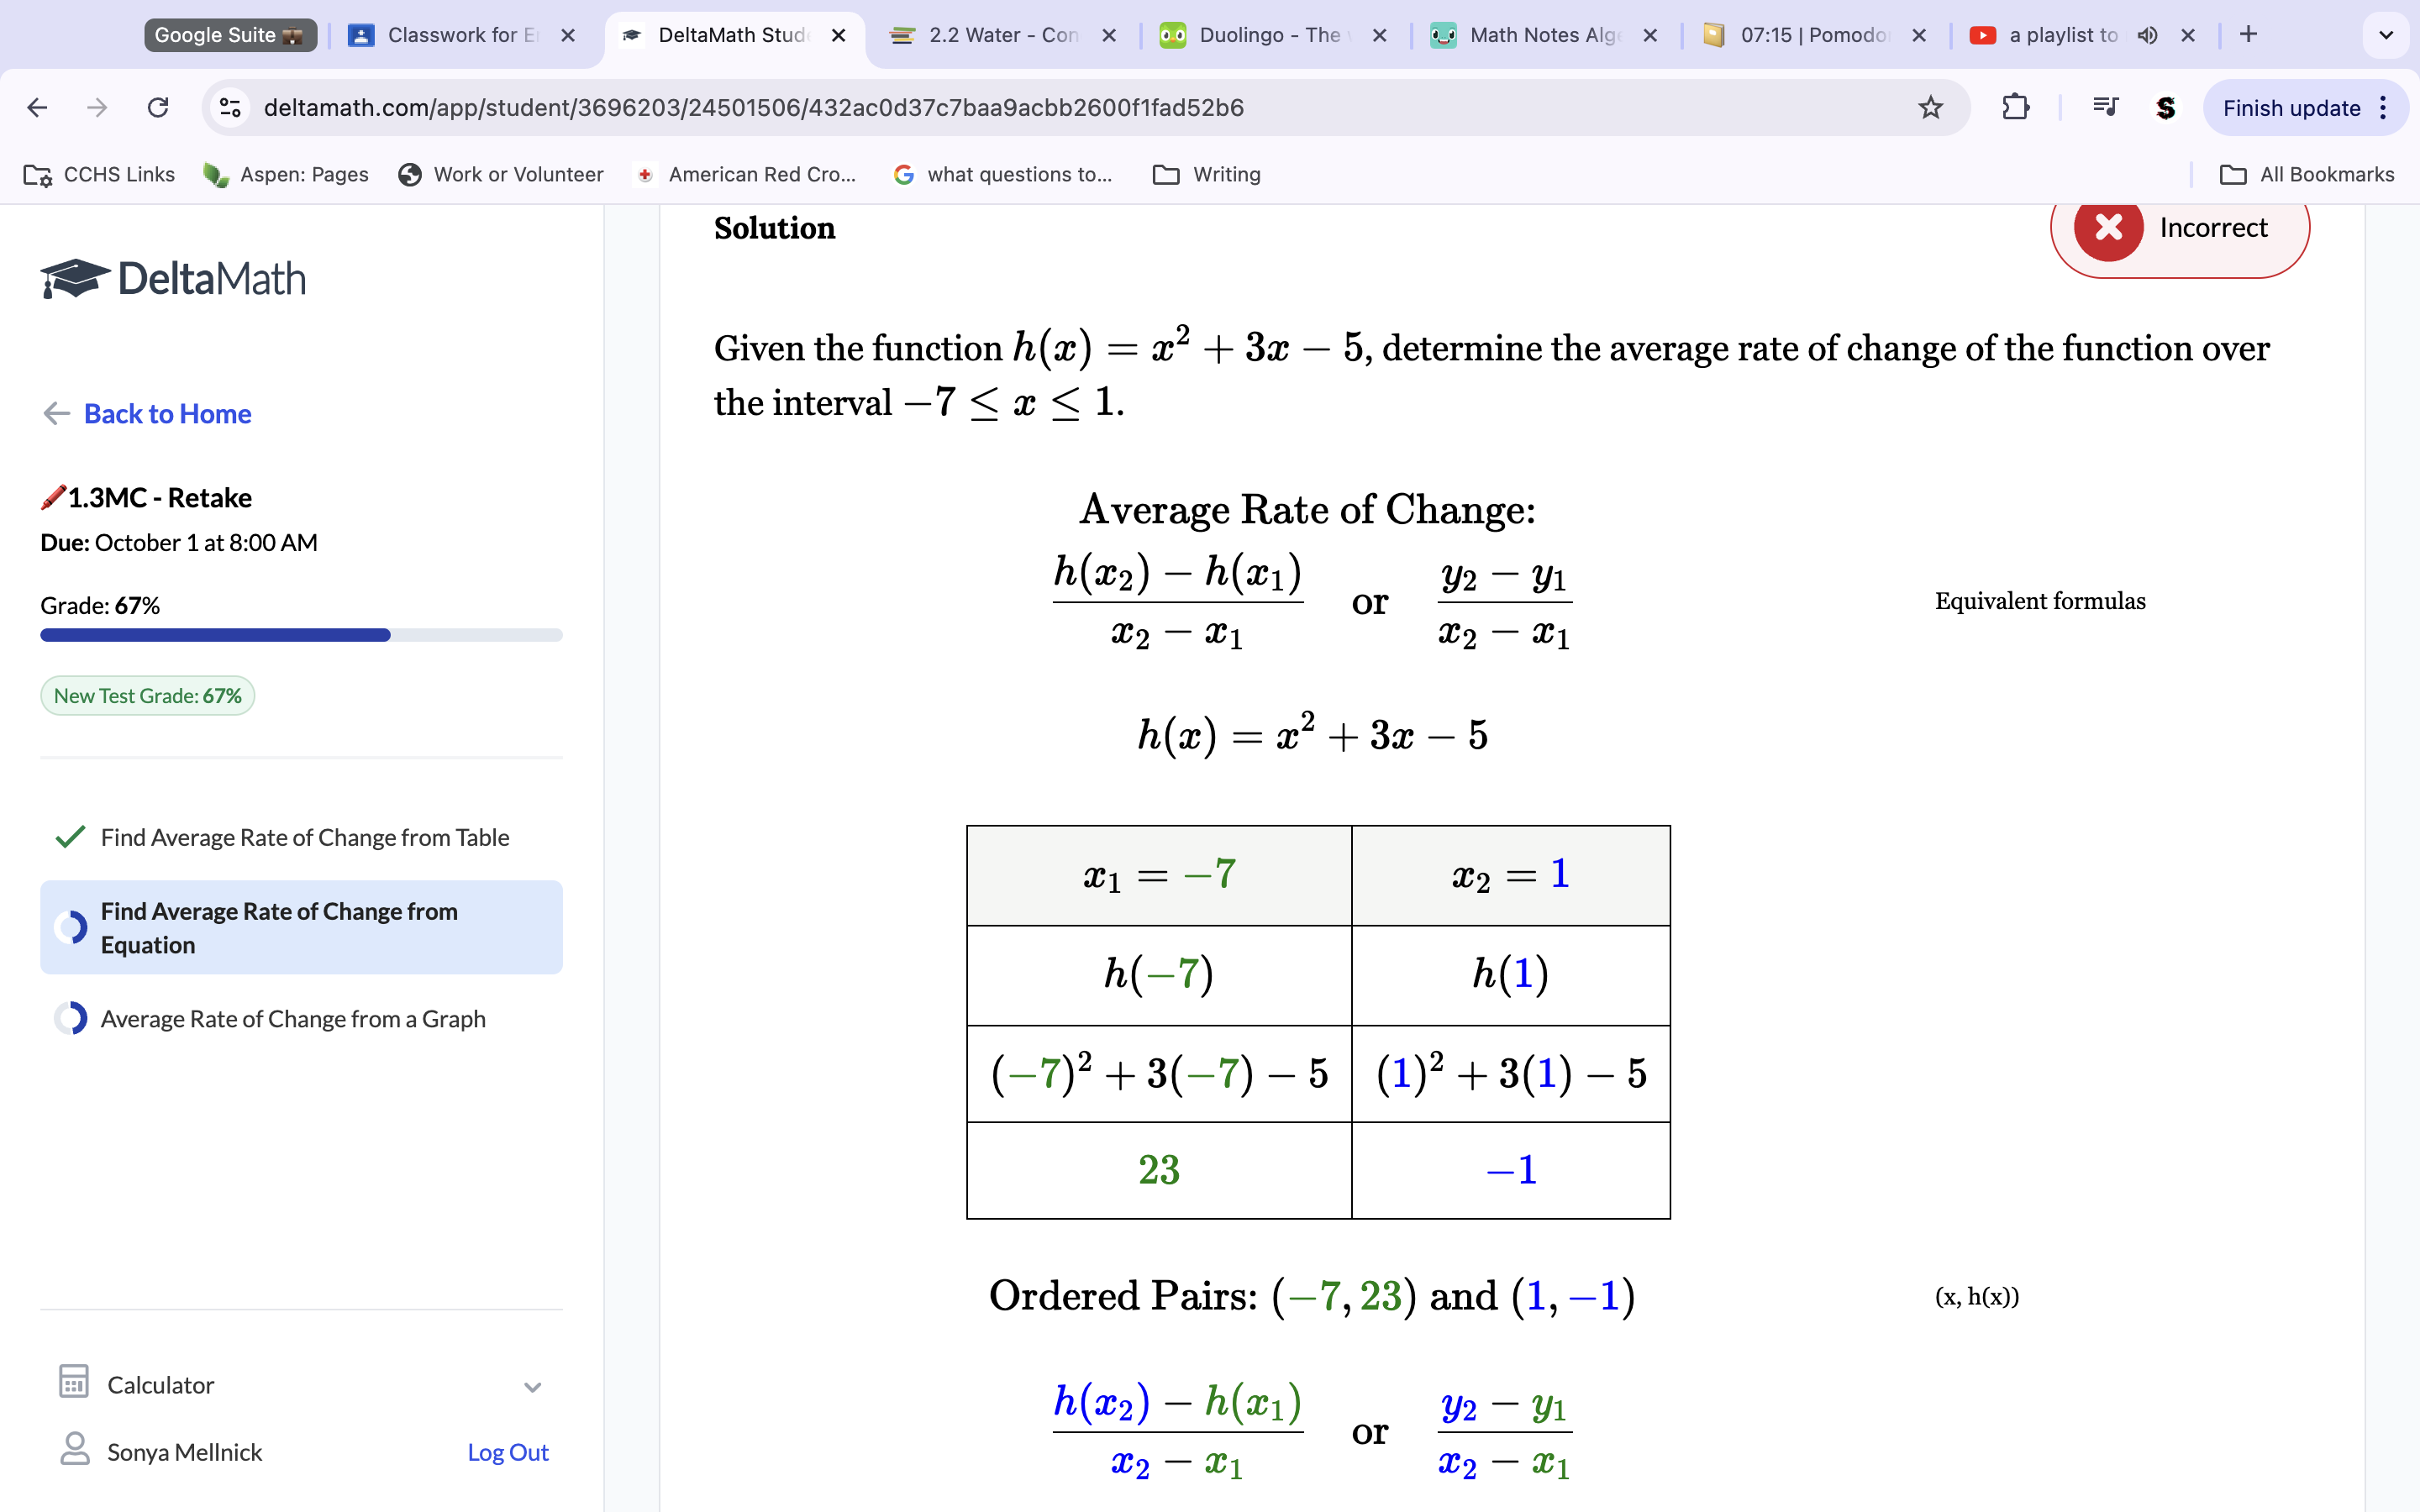
To get the average rate of change, we need to know the y and x values. We know both the x values are -7 and 1. To get the y values, plug each X value (-7, 1) into the equation separately. The sum of the equation is the Y values (after plugging x’s in, we get y values as 23 and -1). Use the slope formula to get the average rate of change. 23+1/-7-1—> 24/-8—> -3.
Solution (-3) Use Parentheses when using a double negative. Aka -6=x -x2 —→ -(-6)2
-CYU 1.4-
A table of selected values is given for odd function X. Find three other ordered pairs.
To find any other ordered pairs, we need to create the opposite of the current pairs since it is an odd function, and odd functions are opposite while even staying the same to the listed points on the table.
Benedickt was asked if the function f(x)=x3-4×2-4x+19. Is he right?
No, Benedickt is not correct. This is because Benedickt used -2, 2 instead of X instead of x, -x. We want to evaluate the function using all possible x values, so we plug x, -x (1, -1) in the equation instead. Plugging these values in, we get that X=0 and -X=6, so it is neither even nor odd because the x values are not even to each other and are not opposite. Benedickt is wrong because the function is neither nor not even. He is terrible because he used 2, -2 as points instead of x, -x.
Determine if the statement is true or false. Reflecting an even or odd function across the x-axis does not affect its function’s symmetry.
This statement is true. This is true because when reflected, both even and odd points will not change numbers; even if they are made negative/positive, the number value itself will not change, keeping it symmetrical.
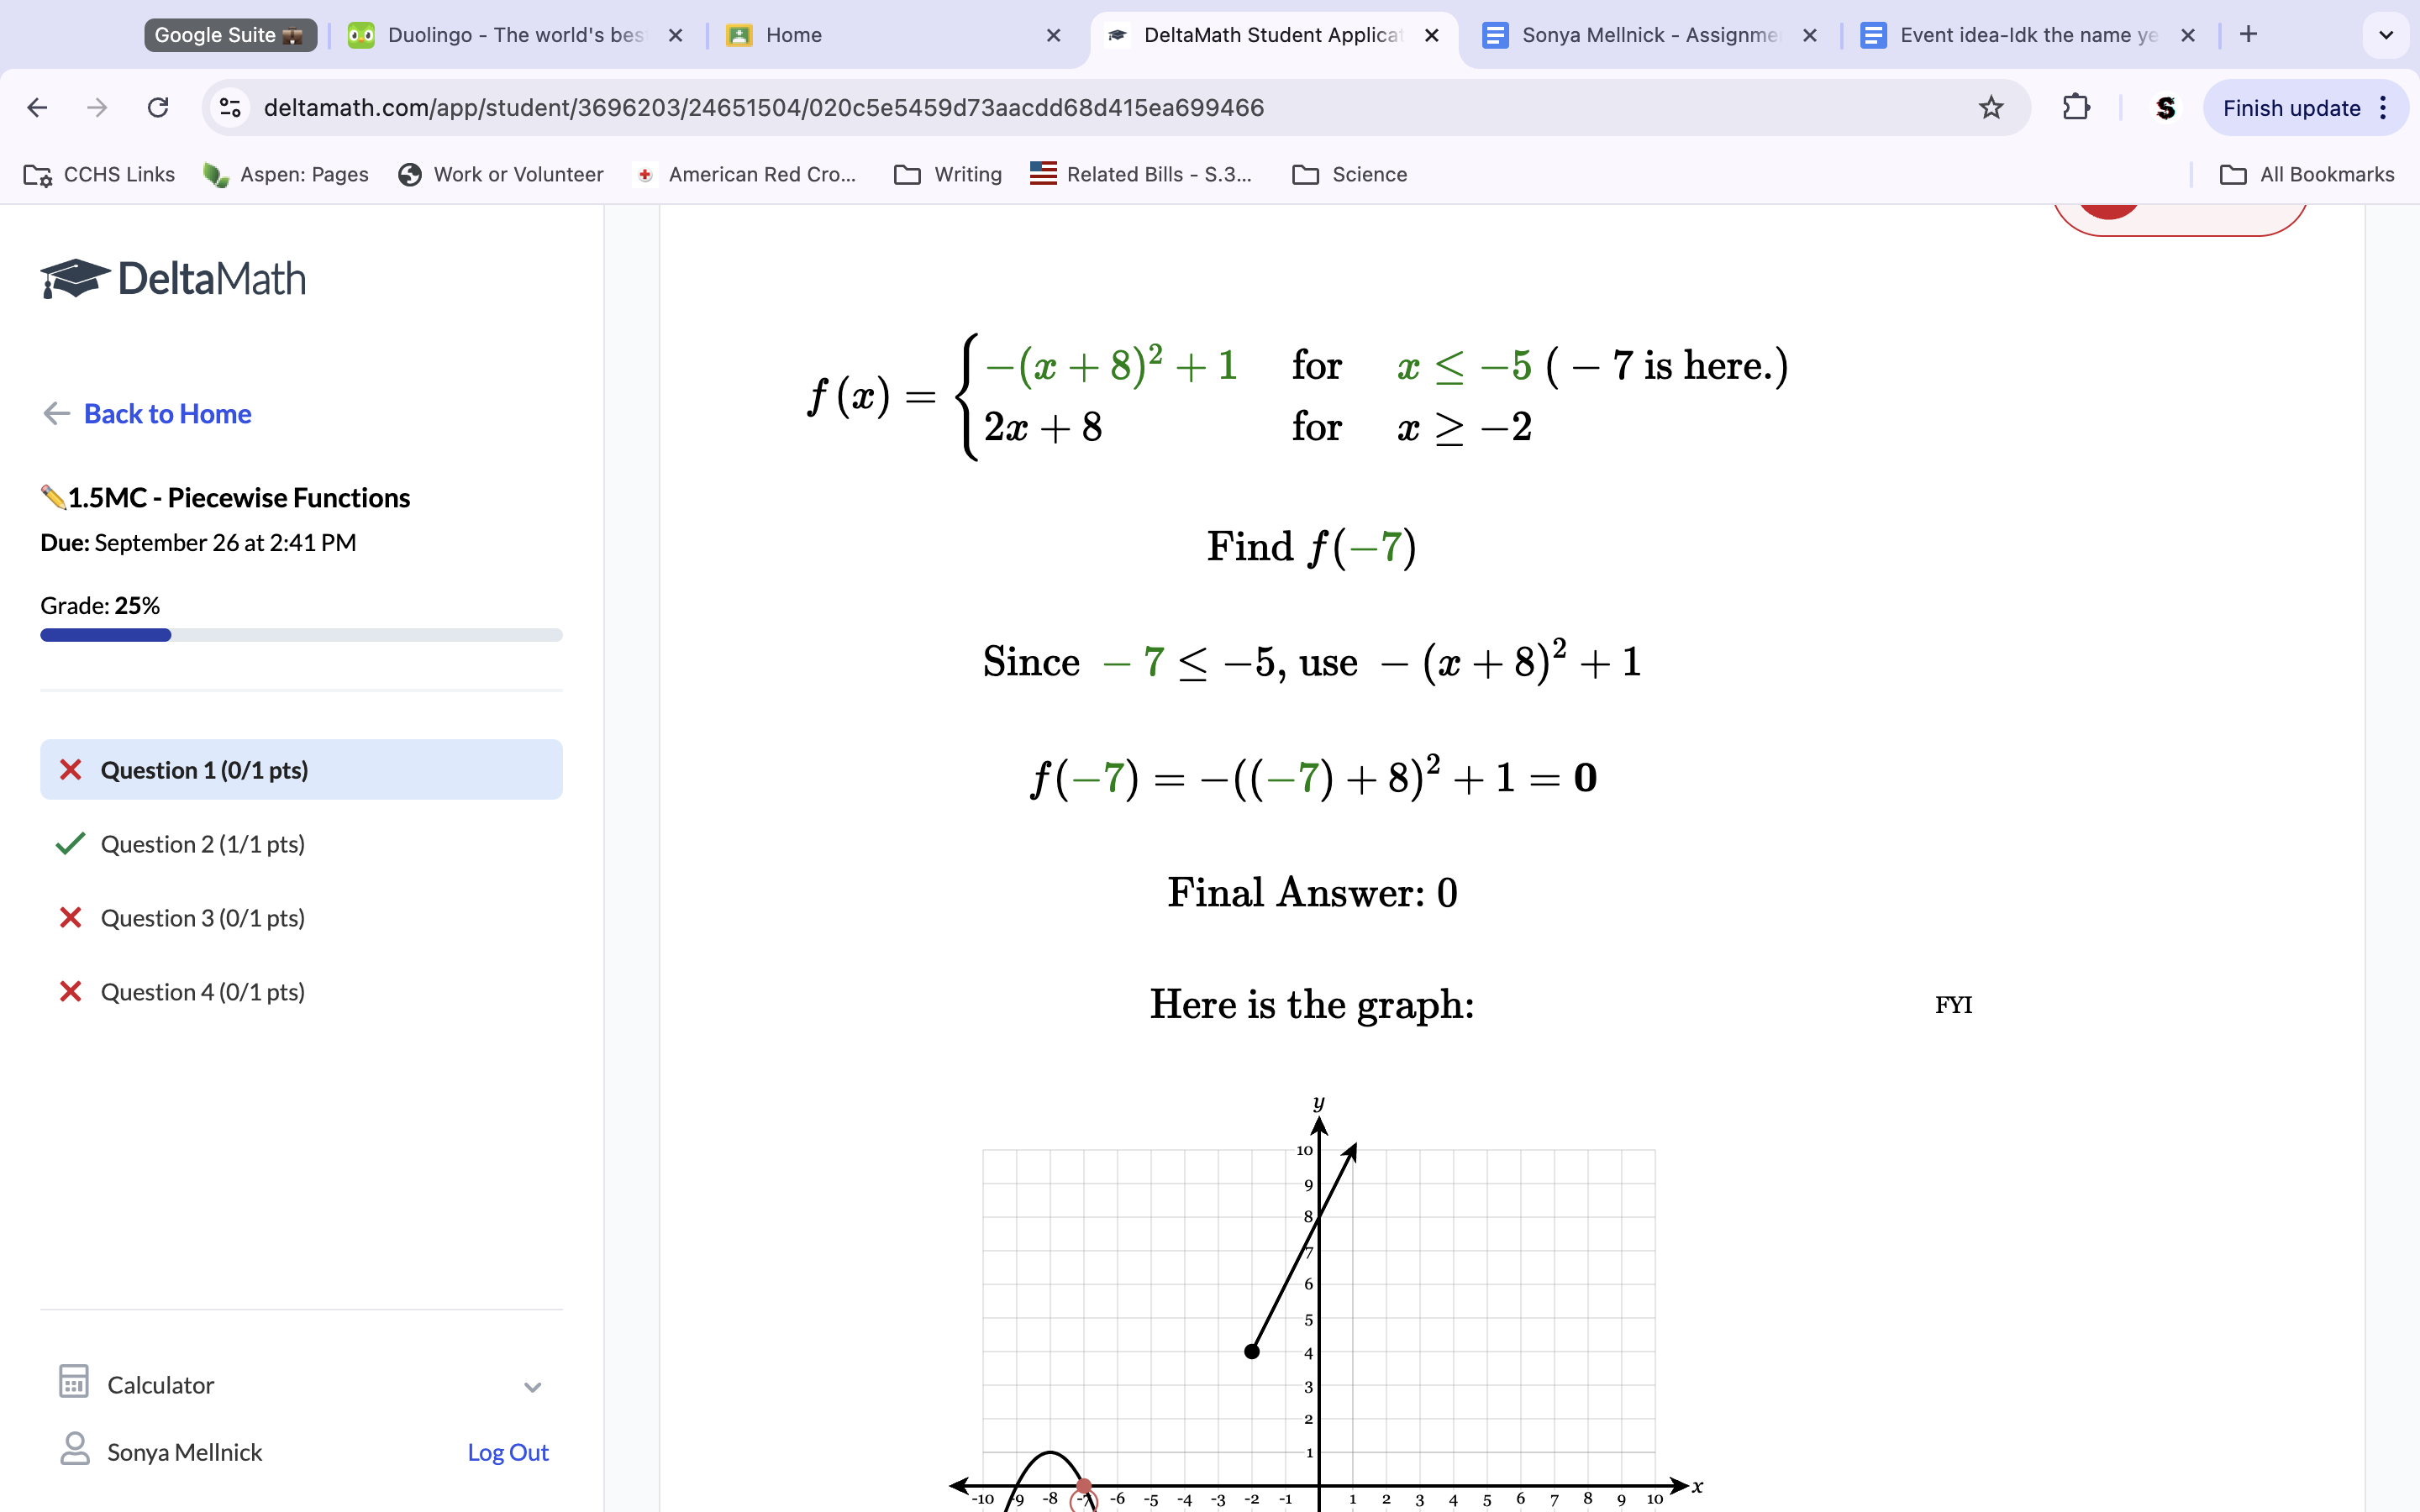
-Mastery Check 1.5-
Solution: 0.
To get our answer, we must plug -7 in for x on the first equation. This is because we are trying to find f(-7); because f(x) is our original equation, we know -7 will be plugged in for x in one of the equations. To find which equation, plug -7 in for x at each inequality to see which one is true. Because -7 is not greater than or equal to negative 2 (2nd equation) but is less than -5 (1st equation), we know to plug -7 into the first equation to get our answer. Plug -7 in for x and calculate to get a final answer of 0.
Place a point at -7 (y). Draw a line using slope (4x, 4/1) across the entire Graph. Because inequality is only true when x is less than or equal to one, erase all lines above 1. Fill in circles as needed. This is the line of equation one. To get the line of equation 2, do the above steps the same, only plugging in the y and slope and inequality listed in the 2nd equation. (Y=3, Slope= -2/1, inequality is x>5)
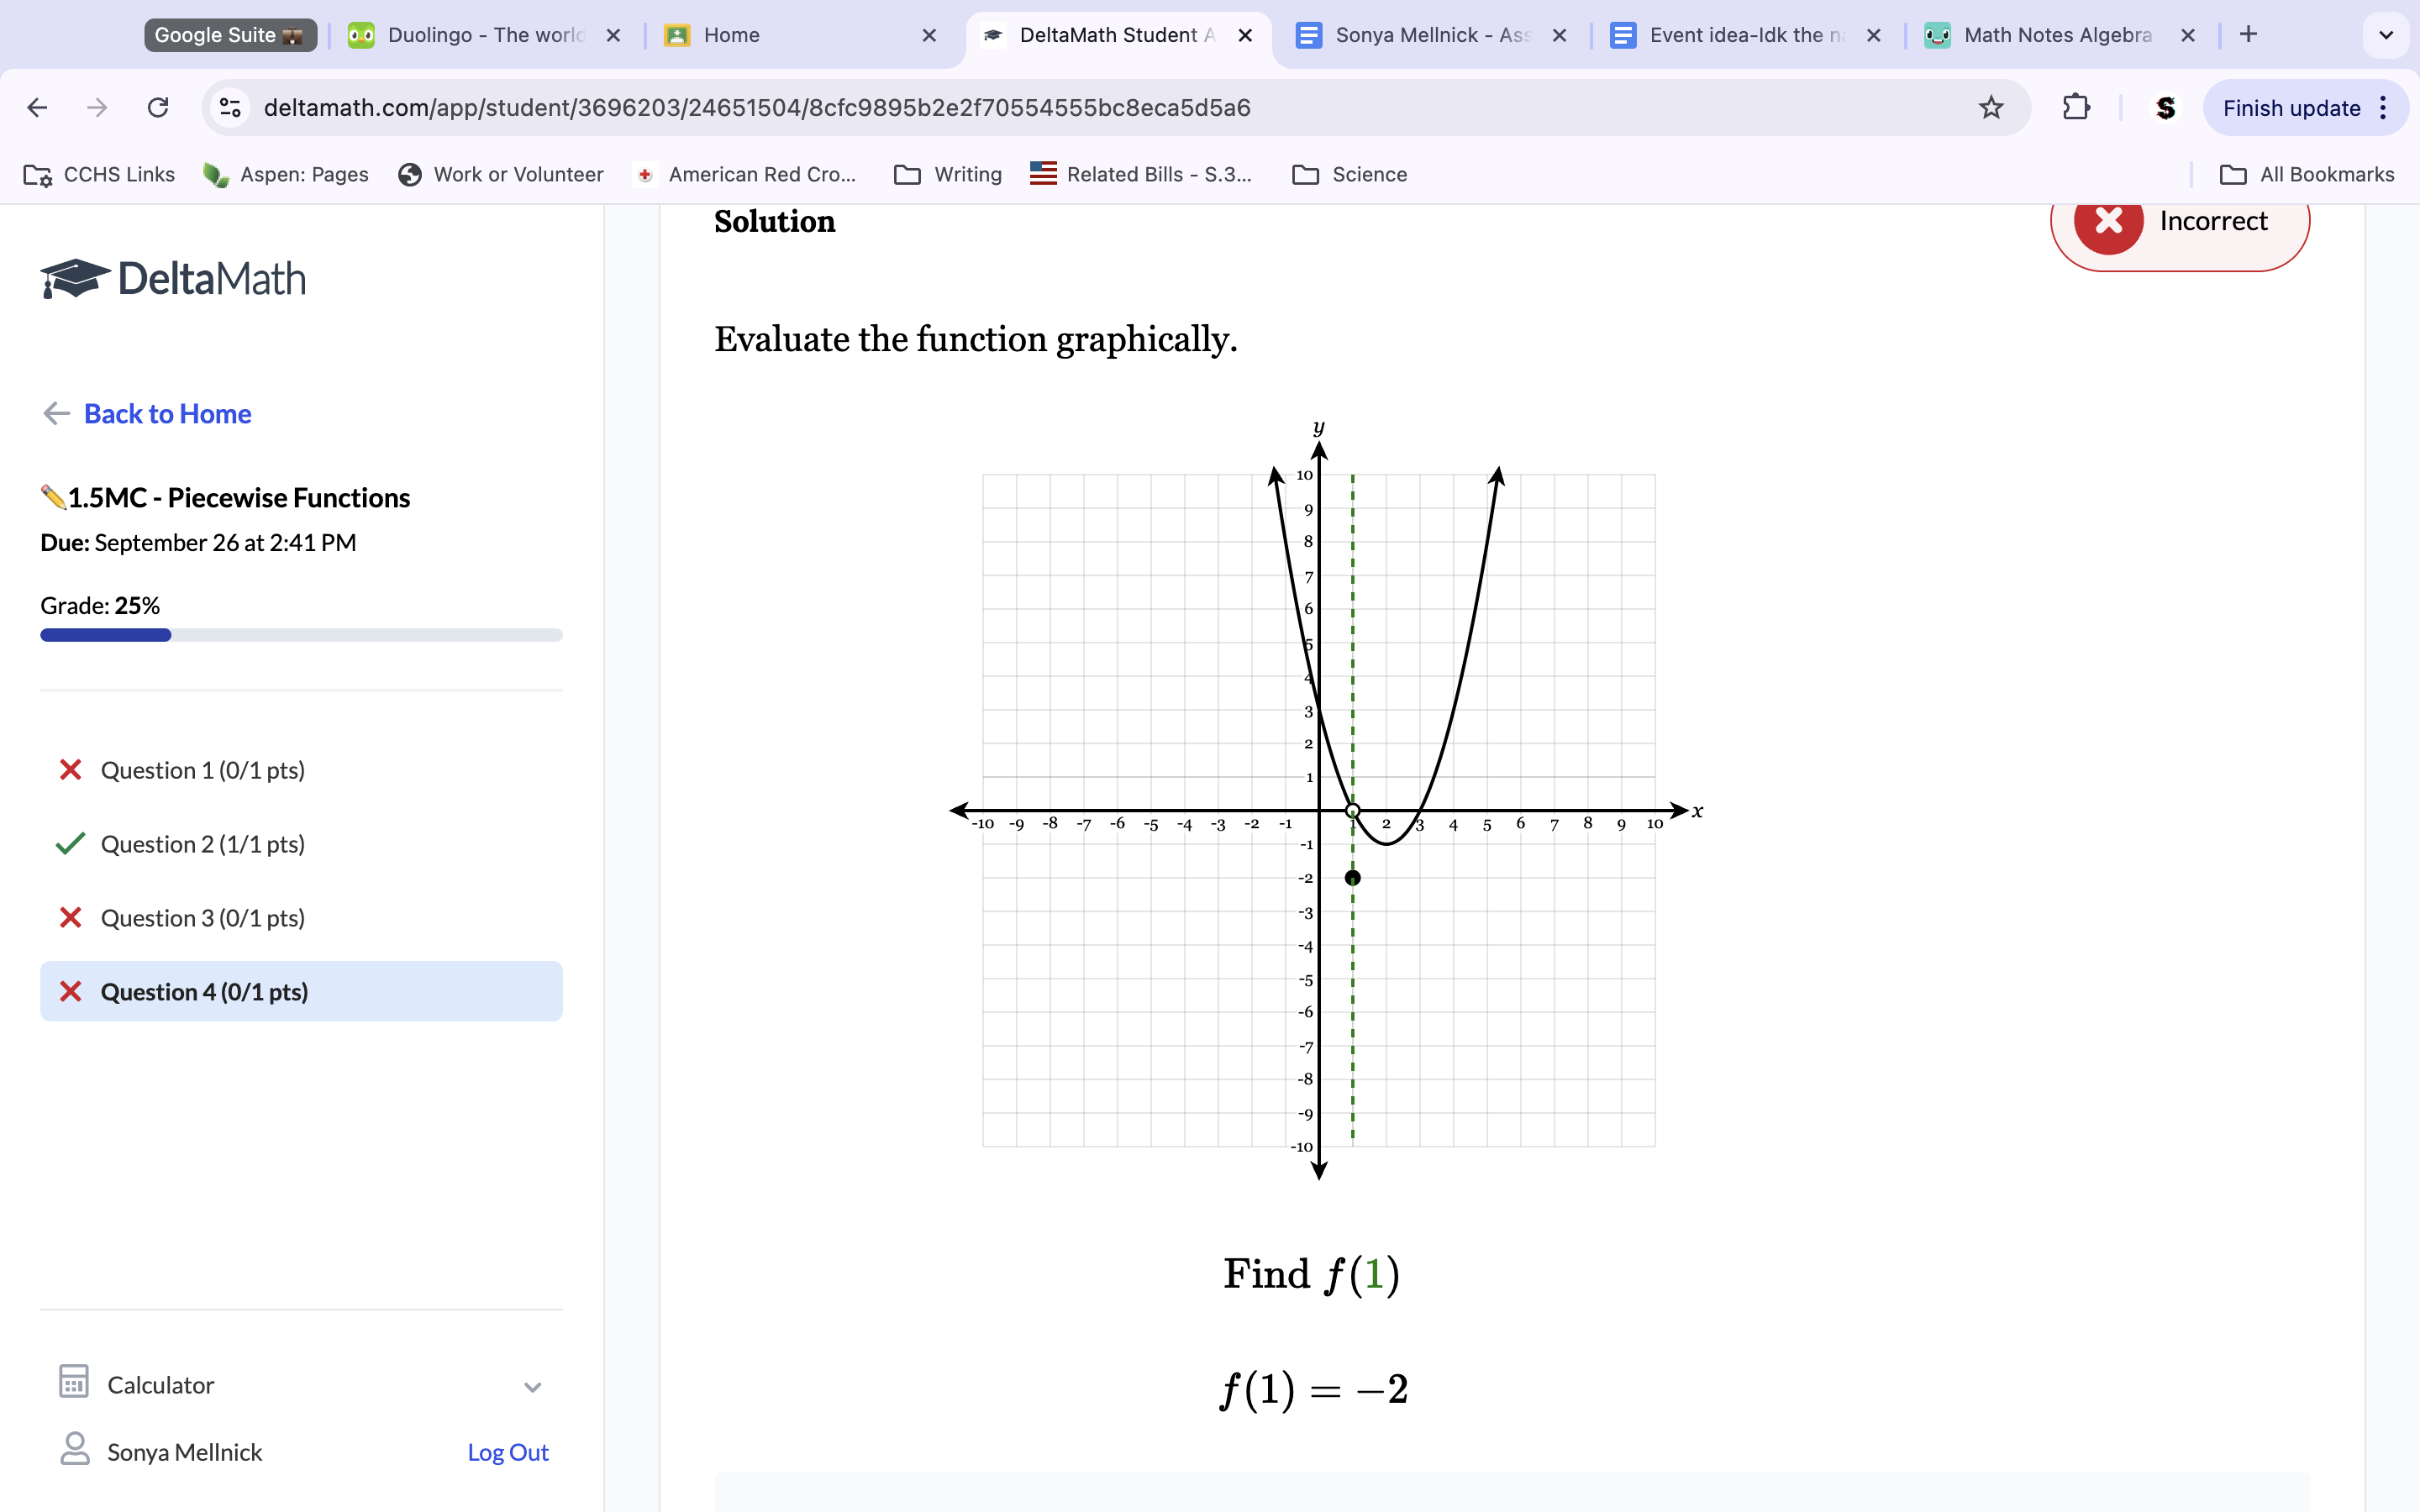
To find f(1), look for the point on the 1 x value. Because there are multiple points, choose the end with the closed/filled circle. To get the answer, look at the y value of the line you picked. That is your answer.
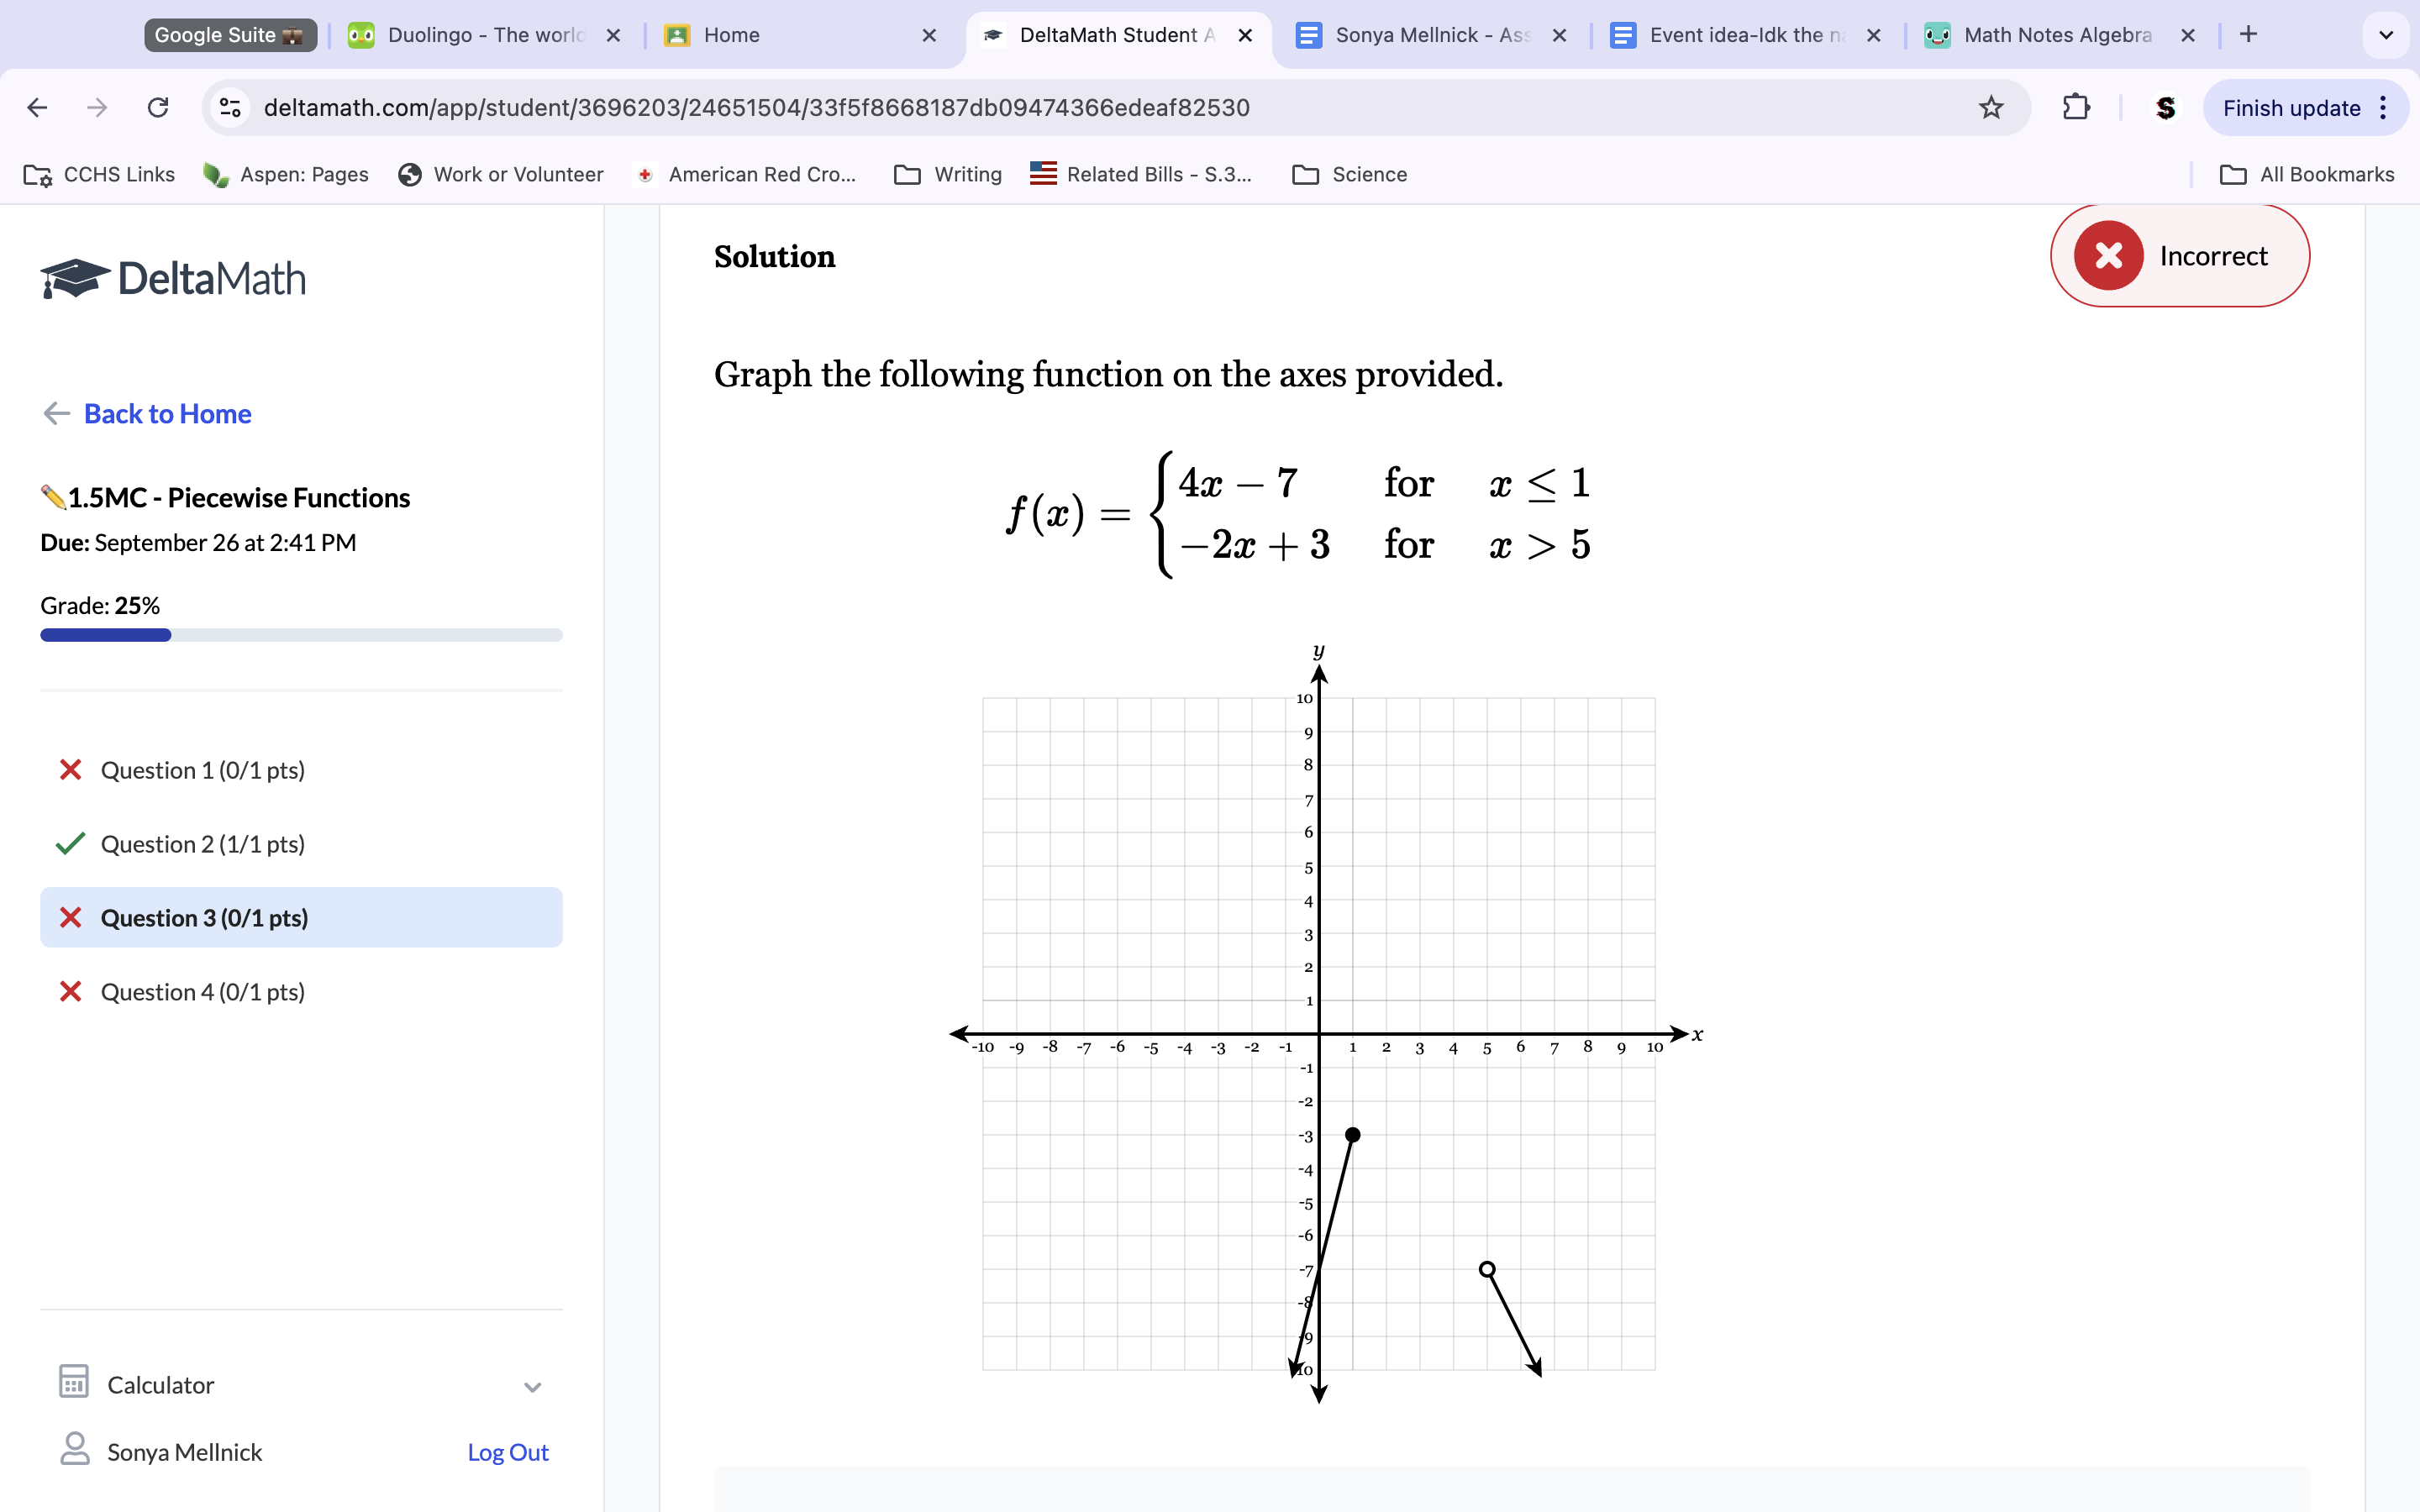
To graph the first equation, place a point at -1 y-intercept. There is no slope; a straight line will be throughout the Graph. Erase line except for inequality (-4<x<1). For the second line, plot the point at y two and draw the line with a slope of 1 across the entire Graph. Erase the line in all places except between the x-intercepts designated on the inequality (1, 5). Fill in circles as needed.
-Pre-assessment-
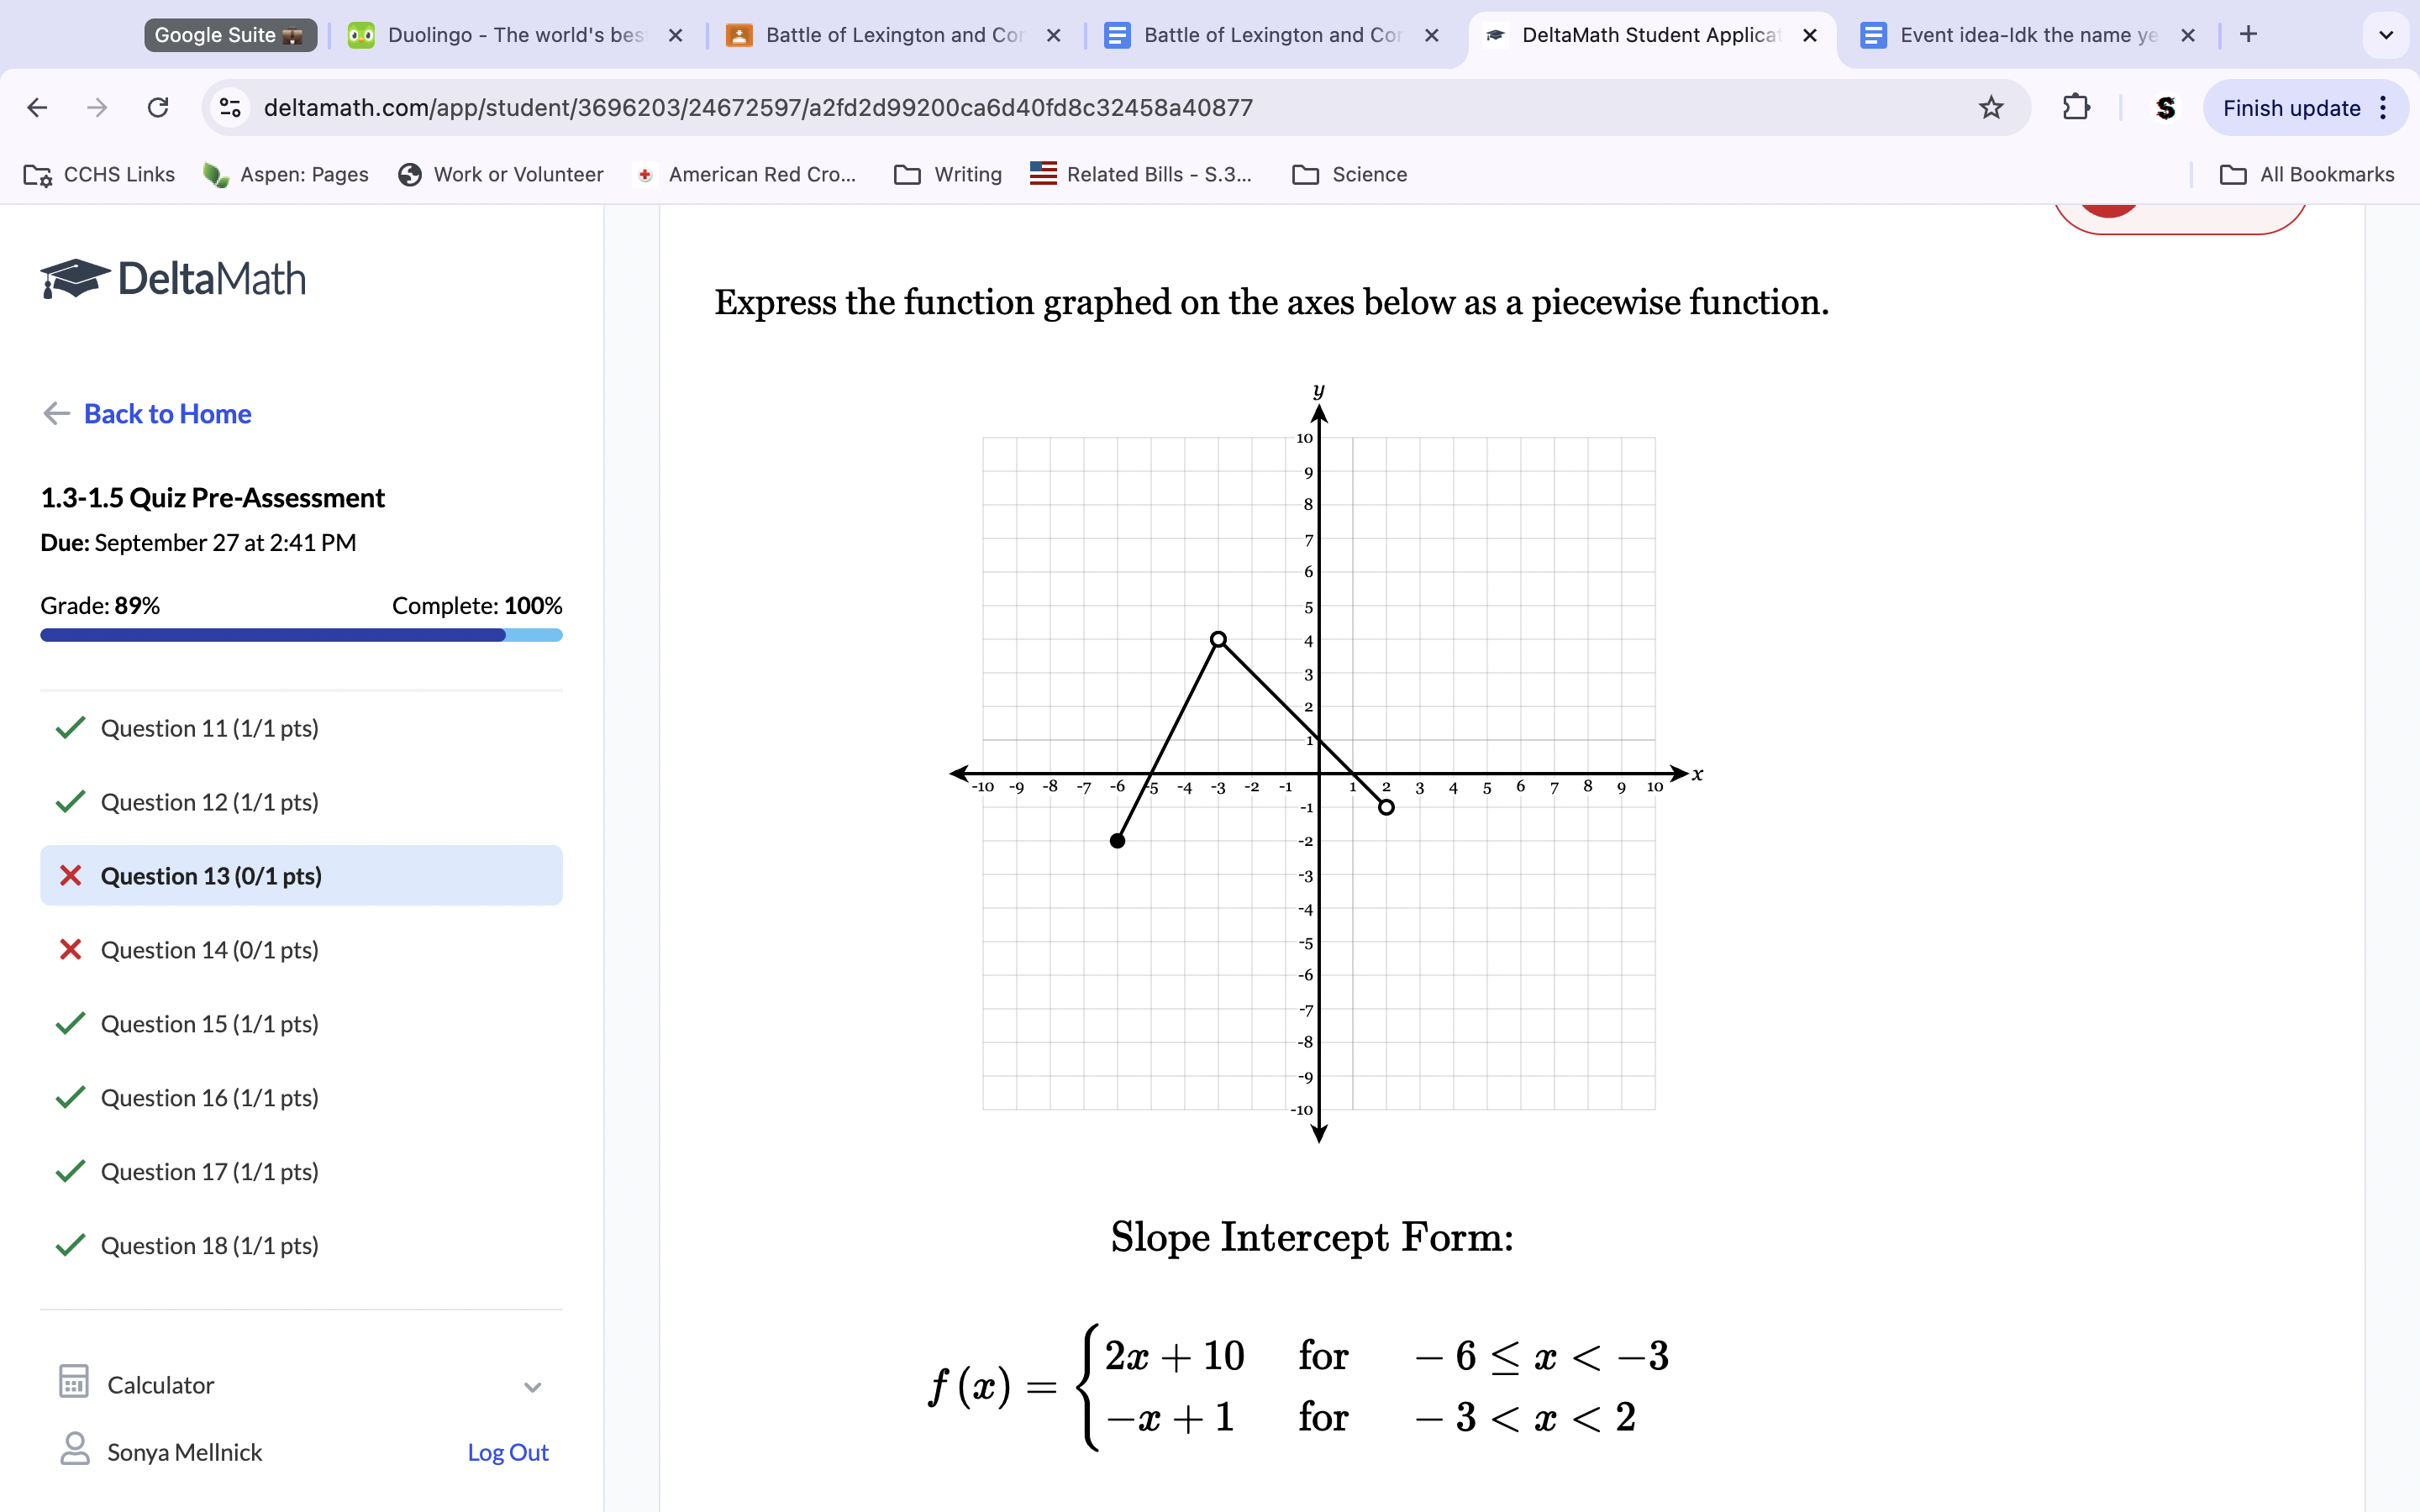
Plot a point at y one and draw the line with a slope of -1. Remember that the denominator of the slope is still positive. Otherwise, it would be two negatives, which would turn into a positive. Erase the line except for inequality designated space between designated X’s (-3, 2). Do the above steps with the first equation with the 2nd function, using only the first equation numbers.
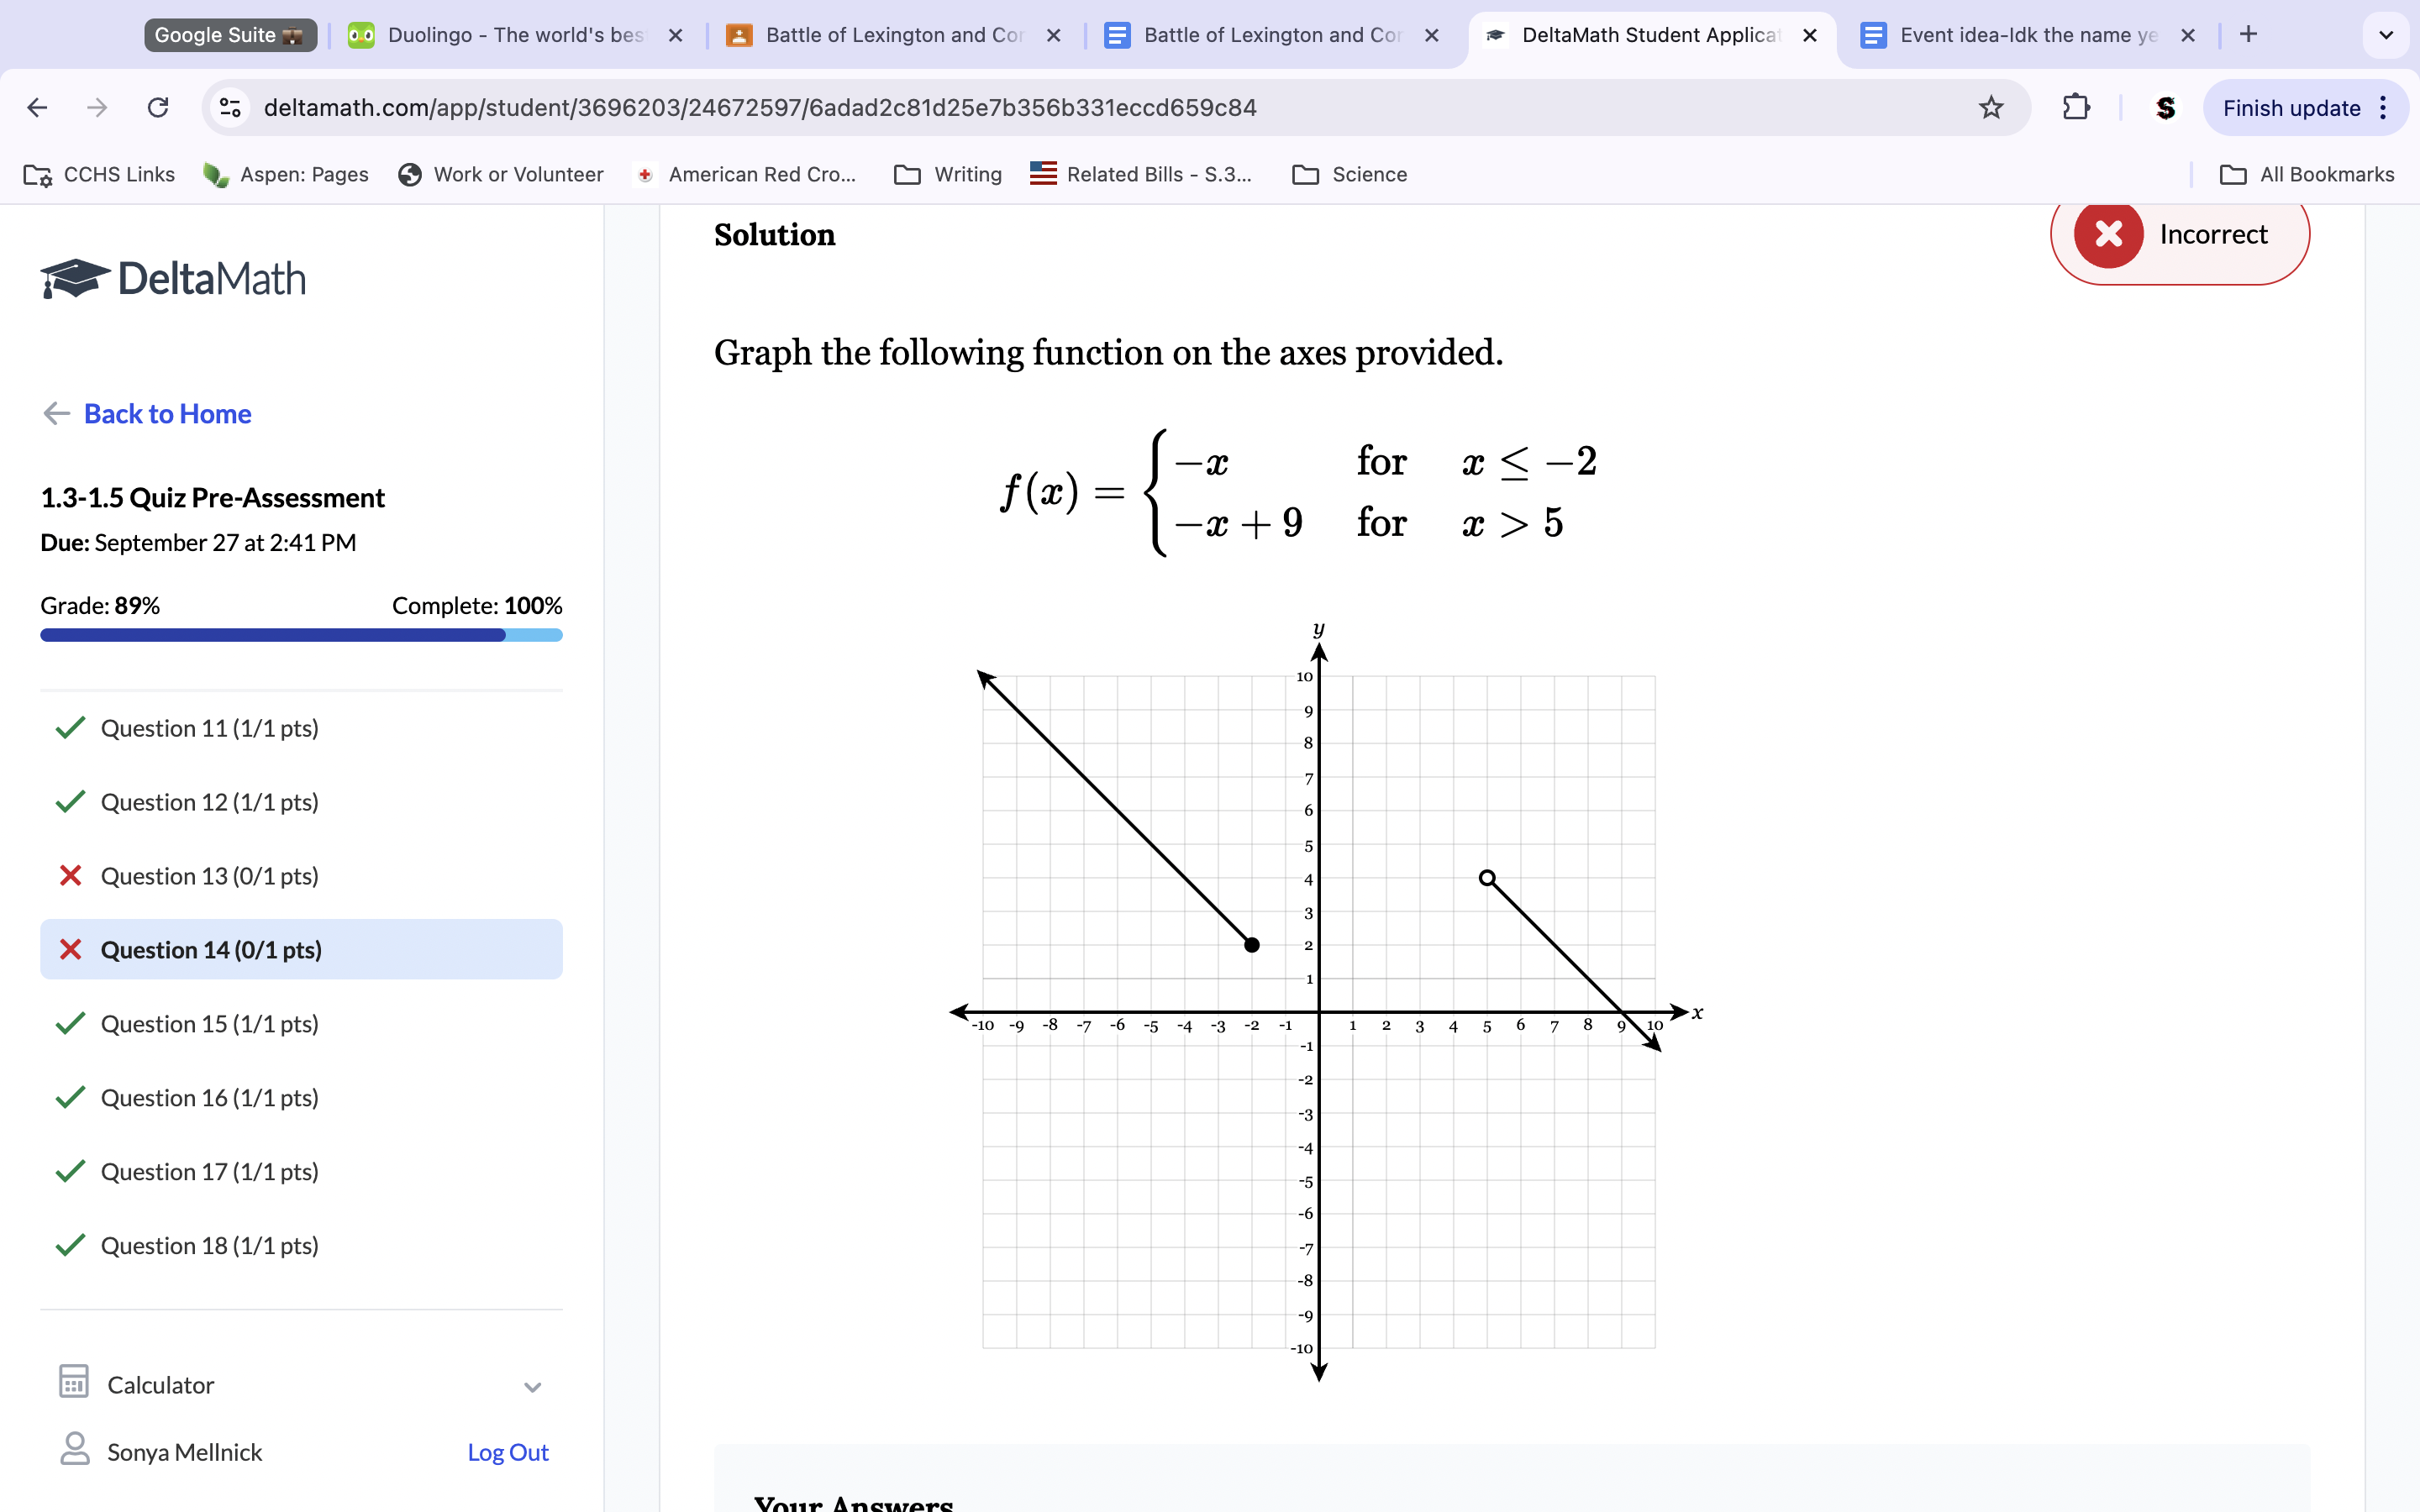
Plot a point at 9. Draw a line from that point with a slope of -1. The inequality is x>5, so the line is only valid (and drawn) when the line is greater than 5. For the 2nd equation, plot a point at 0 because no y-intercept is given. Draw a line from 0 at a slope of -1. Erase the line except for when the line is less than or equal to -2 because that is our inequality (x≤-2). Fill in circles as needed.
HOW TO GRAPH PIECEWISE FUNCTIONS:
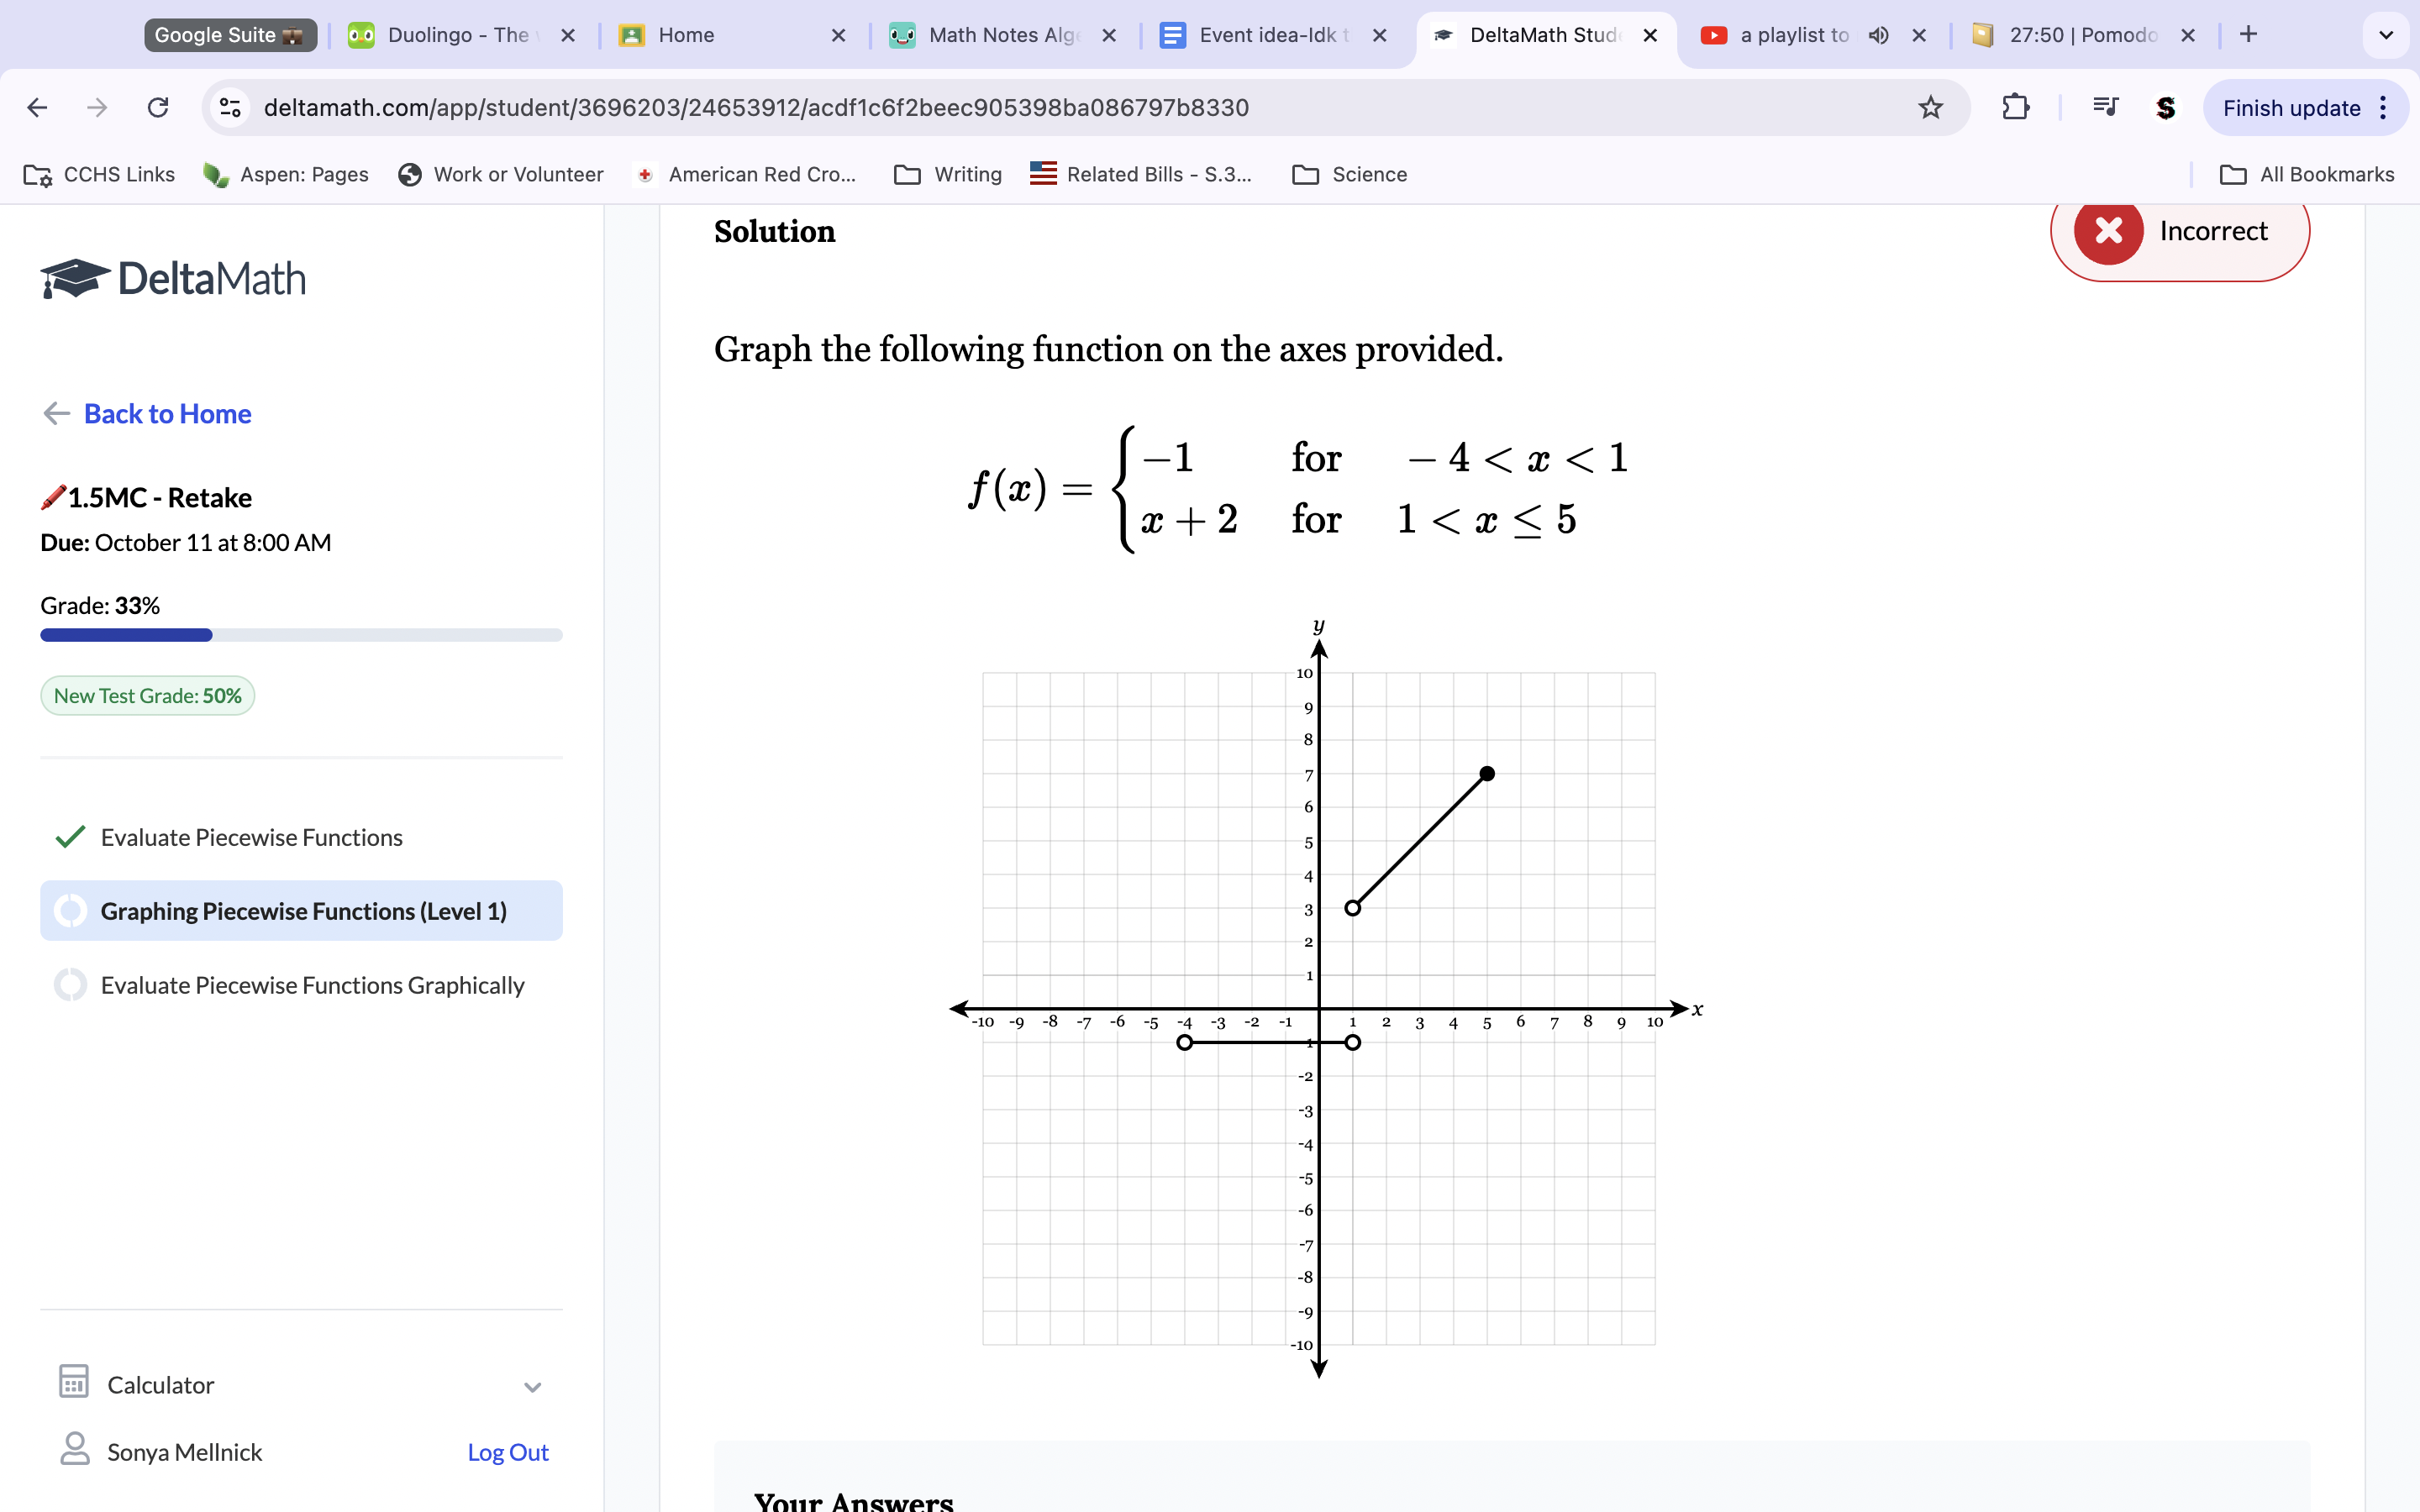
Take the equation above as an example. The -1 is the y-intercept, so we’ll place a point there. Because there is no x, we have no slope, so we keep it a straight line across the ENTIRE Graph. Then, look at your inequality. Because the disparity states -4<x<1, the line is only valid between those X points. Erase the rest of the Graph and fill in circles as needed. Because the second one has an equation of x+2, we will plot a point of 2 on the y-intercept; then, because X is placed before 2, we know X (which is equal to 1/1) is our slope, so we will graph a line using that slope from the y-intercept across the ENTIRE Graph. Plot the line regarding the inequality and fill in circles as needed.
HOW TO EVALUATE PIECEWISE FUNCTIONS:
Take the above equation as an example. Find f(1). Find the X point for one on the Graph. Then, look on the Y-line for the corresponding point. If there are multiple points, choose the one with a closed circle. It is undefined if no closed circle lines exist on the following Y-intercept.
-1.3-1.5 Practice Problems-
3b. Calculate the average rate of change if y=2x2 + x +2 [0, 1/2]. To calculate our average rate of change, we need to know both x and y values. The brackets [] give us the x values, so we only need to find the y. To find the y, we plug each x point into the equation separately to get the corresponding y points. Remember to square the x first and multiply it by the following number. This gets us the values of 2 and 3. Use slope form to get the average rate of change. 2-3/0-.5 2.
4a. Calculate the y and x-intercepts in the function. To calculate the y-intercept, make x=0. Look at the inequalities. The equation you will use in the function is whichever inequality has the true statement with 0. Plug x in for 0 in the function and calculate to get y-intercept (3). To get the x-intercept, look at the inequalities, but this time, see which one is true with x as 1. Whichever inequality is true, the correlating equation we use. Make the equation equal to 0, and calculate to get the x value(-3/2).
-Practice Test (Can’t Find Document)-
Remember to subtract the two’s before making the slope.
Remember that y is a verticle line, and x is a horizontal line, so when a line only goes through one, it is either y= or x=, depending on which line it falls under.
When plotting the y-axis in function notation, you need to place the number the line goes through on the equation. So, if the completed function doesn’t go through the y-axis, keep using the shown slope until you get there. Plot that number on the equation.
Remember that if both X values match the inequality, use both.
~~ALGEBRA 1 REVIEW~~
-CYU A-
1a. Rewrite the equation in slope-intercept form: x+2y=-2
2. Write an equation in a point-slope form that passes through the points (-3,8) and (5,-4).
3. Write an equation in slope-intercept form that goes through the points (3, -4) and (-3, 5)
4. Write an equation in a standard form that passes through the points (6, -4) and (12, 2)
-CYU B-
Which of the following points passes through the point (-4, -8)?
6a. The points (-3, 6) and (6, 0) are plotted on the grid below. Find an equation, in y=mx+b form, for the line passing through these two points.
~~UNIT 1.6-1.7~~
-1.6 Quick Check-
1b. Consider the 3 functions, f(x), g(x), and h(x) shown below. h(g(5))
H(g(5)) is -5. This is because the output of 5 on g is 0, and the y value on the H function graph has a -5 intercept on the 0 point.
1c. Consider the 3 functions, f(x), g(x), and h(x) shown below. (g*f)(-12)
To get f(-12), plug 12 in for the x value on the equation, which gets us -8. Then this makes g(-8), which the table shows is -6.
2b. (G*f) (2)
f(2) is shown to be five on the table, so we make the equation g(5). G(5) is shown to be six on the table.
3b. Given the functions f(x)=3x-2 and g(x)-5x+4, determine formulas in the simplest y=ax+b form for: g(f(x))
G(f(x)). This essentially means that we will plug the f equation into the g x coordinates since f equals the g x coordinates. So, after plugging in, we get 5(3x-2)+4. Distribute to get 15x-10+4. Combine like terms to get 15x-6.
-1.6 CYU-
1b. Given f(x)=3x-4 and g(x)=2x+7 evaluate: g(f(-2))
Plug -2 in for the x of the f function. This gets 3(-2)-4=-10. Plug -10 into the g function to get -2(-10)+7=27.
3b. The graphs of y=h(x) and y=k(x) are shown below. (k • h) (0).
Find the y point that’s on the 0 point since were looking at h(0). This equals 1. Then, move 1 to the right and find the next point in general, not just on the line. The next point is 5, but there are no points on the 1 x value, so we will place it on the next point in general, which is 5.
4. If g(x)=3x-5 and h(x)=2x-4 then (g•h)(x)=?
To get this, we must place the h function into the x-intercept(s) of the g function. This makes 3(2x-4)-5. Distribute to get 6x-12-5. Combine like terms to get 6x-17.
7. Physics students are studying the effects of temperature, t, on the speed of sound, S. Round to the nearest tenth.
Because the equation is K(C)=C+273.15, an we are given that the C=30. We will plug that number in to get K for the next equation, which was also given (√(410K). 30(C)+273.15 is 303.15, and since this equals K, we plug 303.15 into the 2nd equation. √410(303.15). This makes a final answer of 352.5.
8c. Consider the functions f(x)=2x+9 and g(x)=x-9/2. g(f(x))
Plug the f equation into the x intercept(s) of the g function. This gets us 2x+9-9/2. Combine like terms to get 2x+0/2—> 2x/2 is our final answer.
-1.6 Mastery Check-
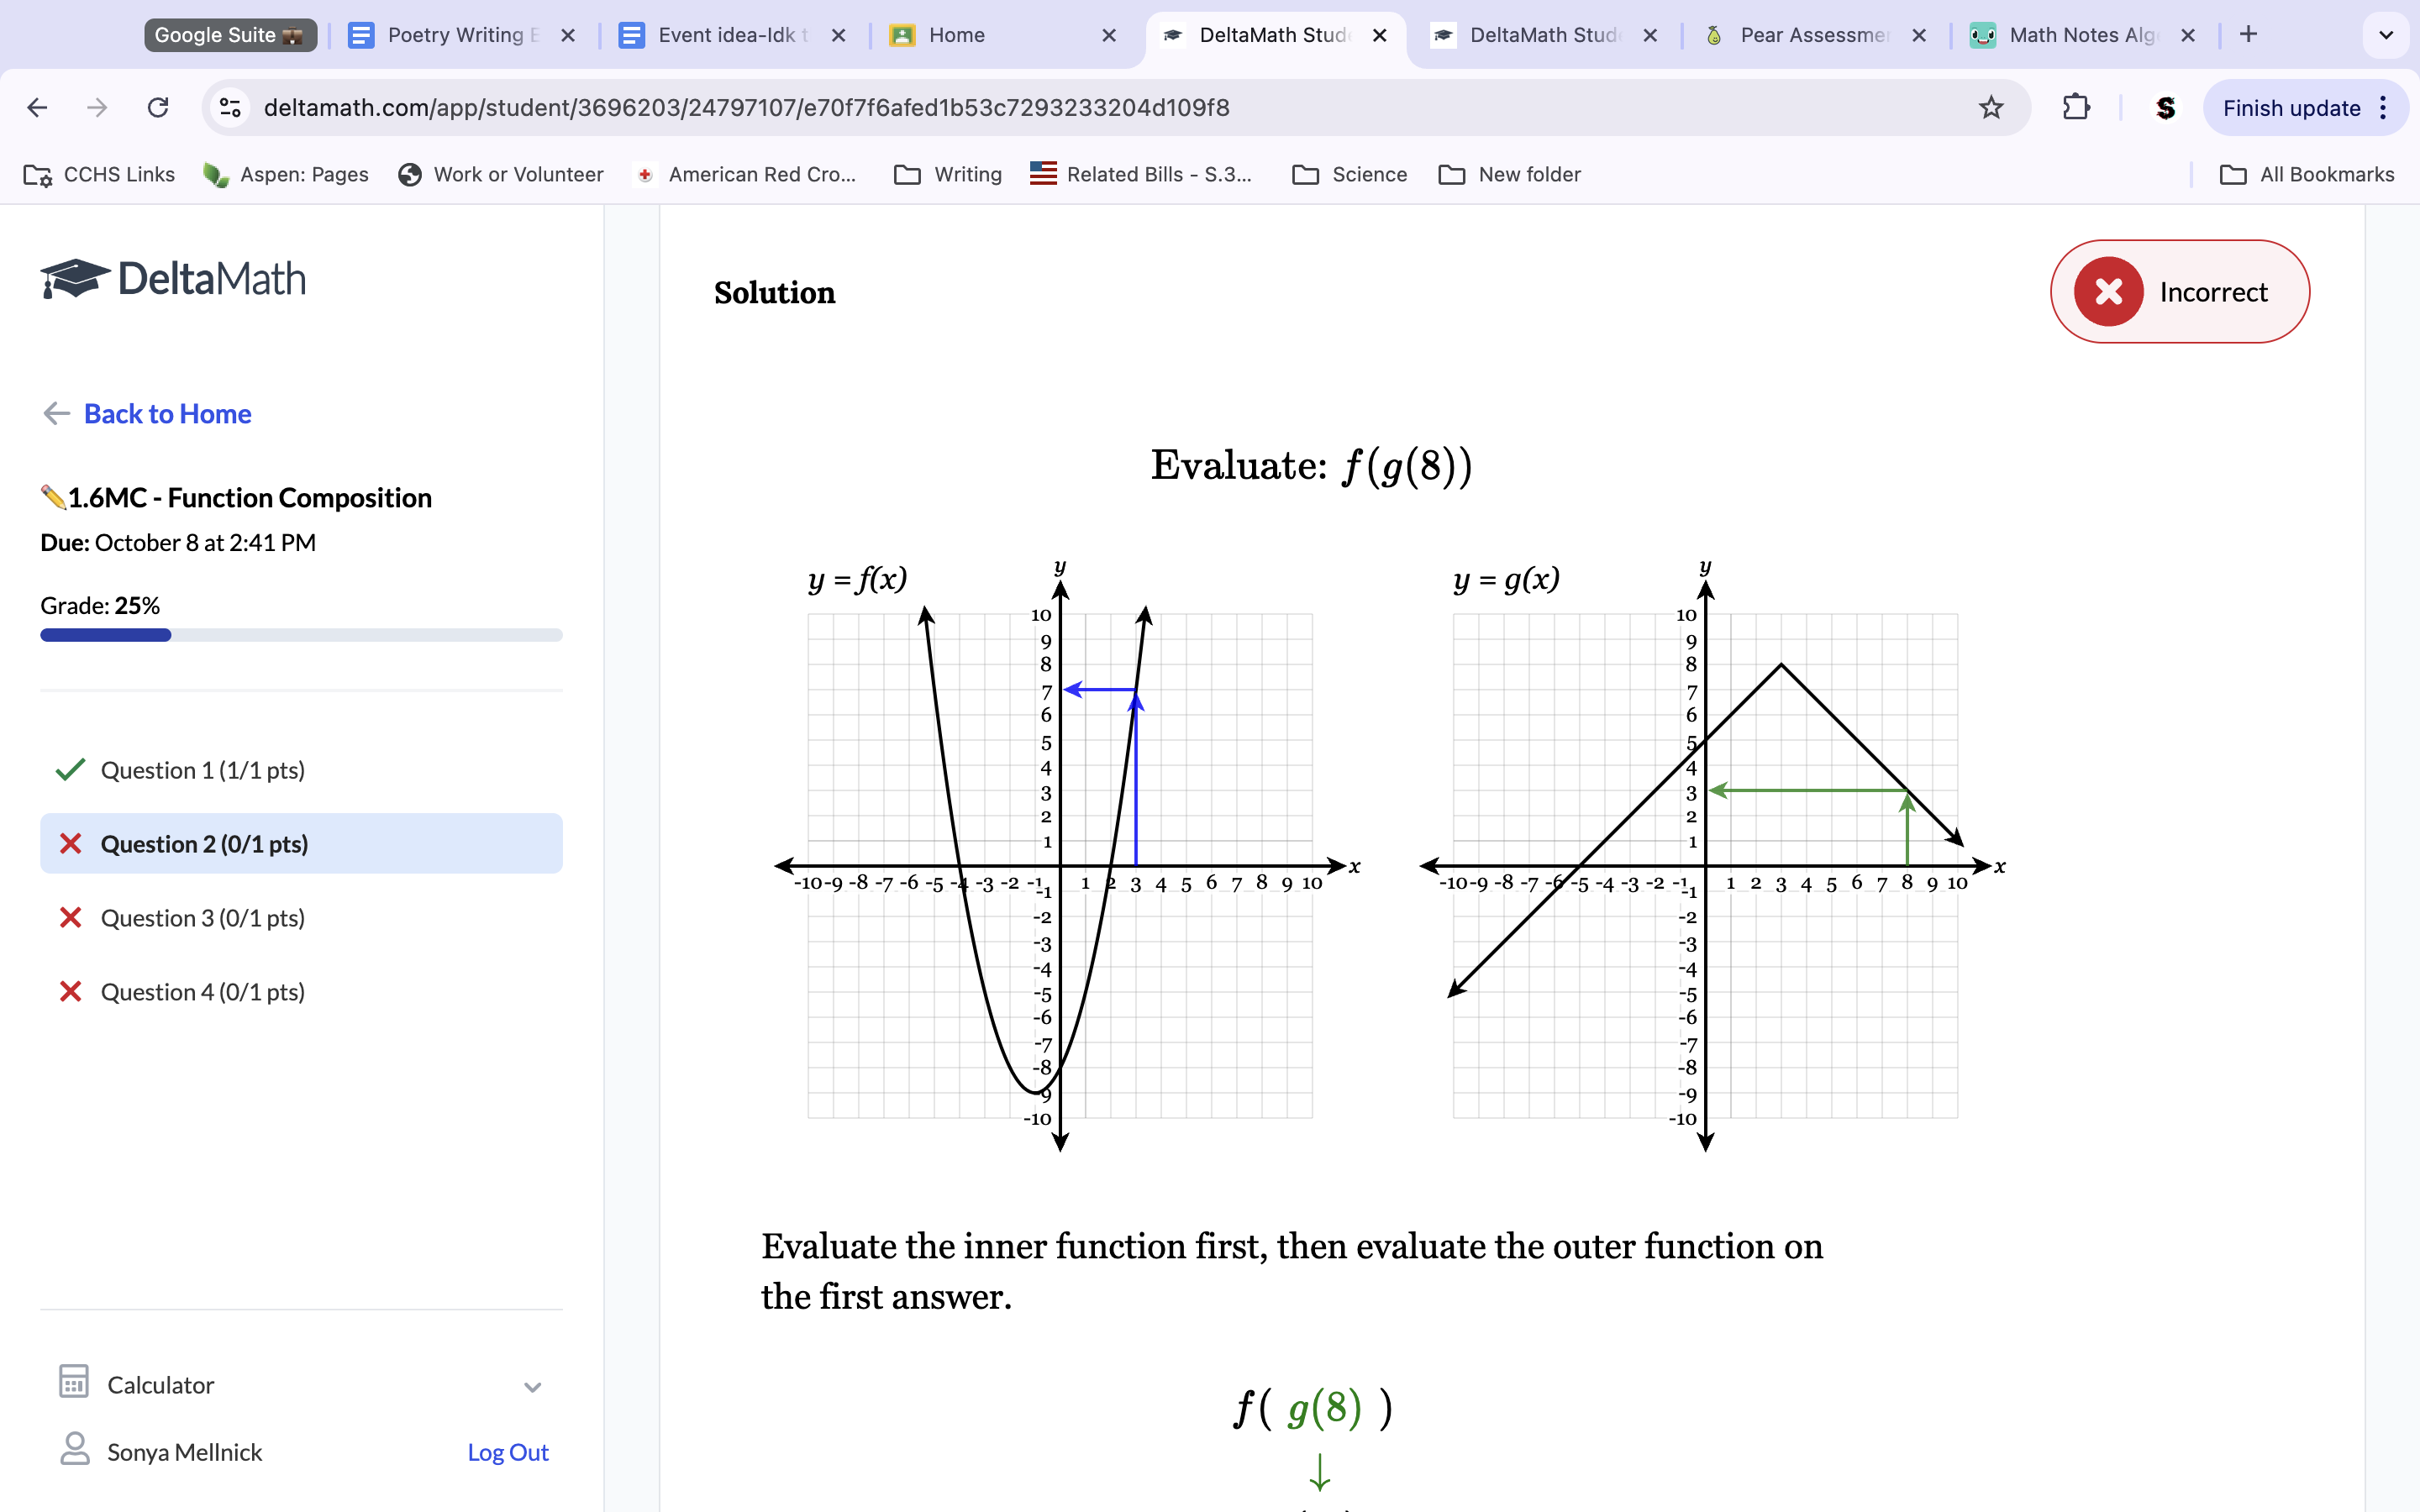
Question 2: Find the y value.
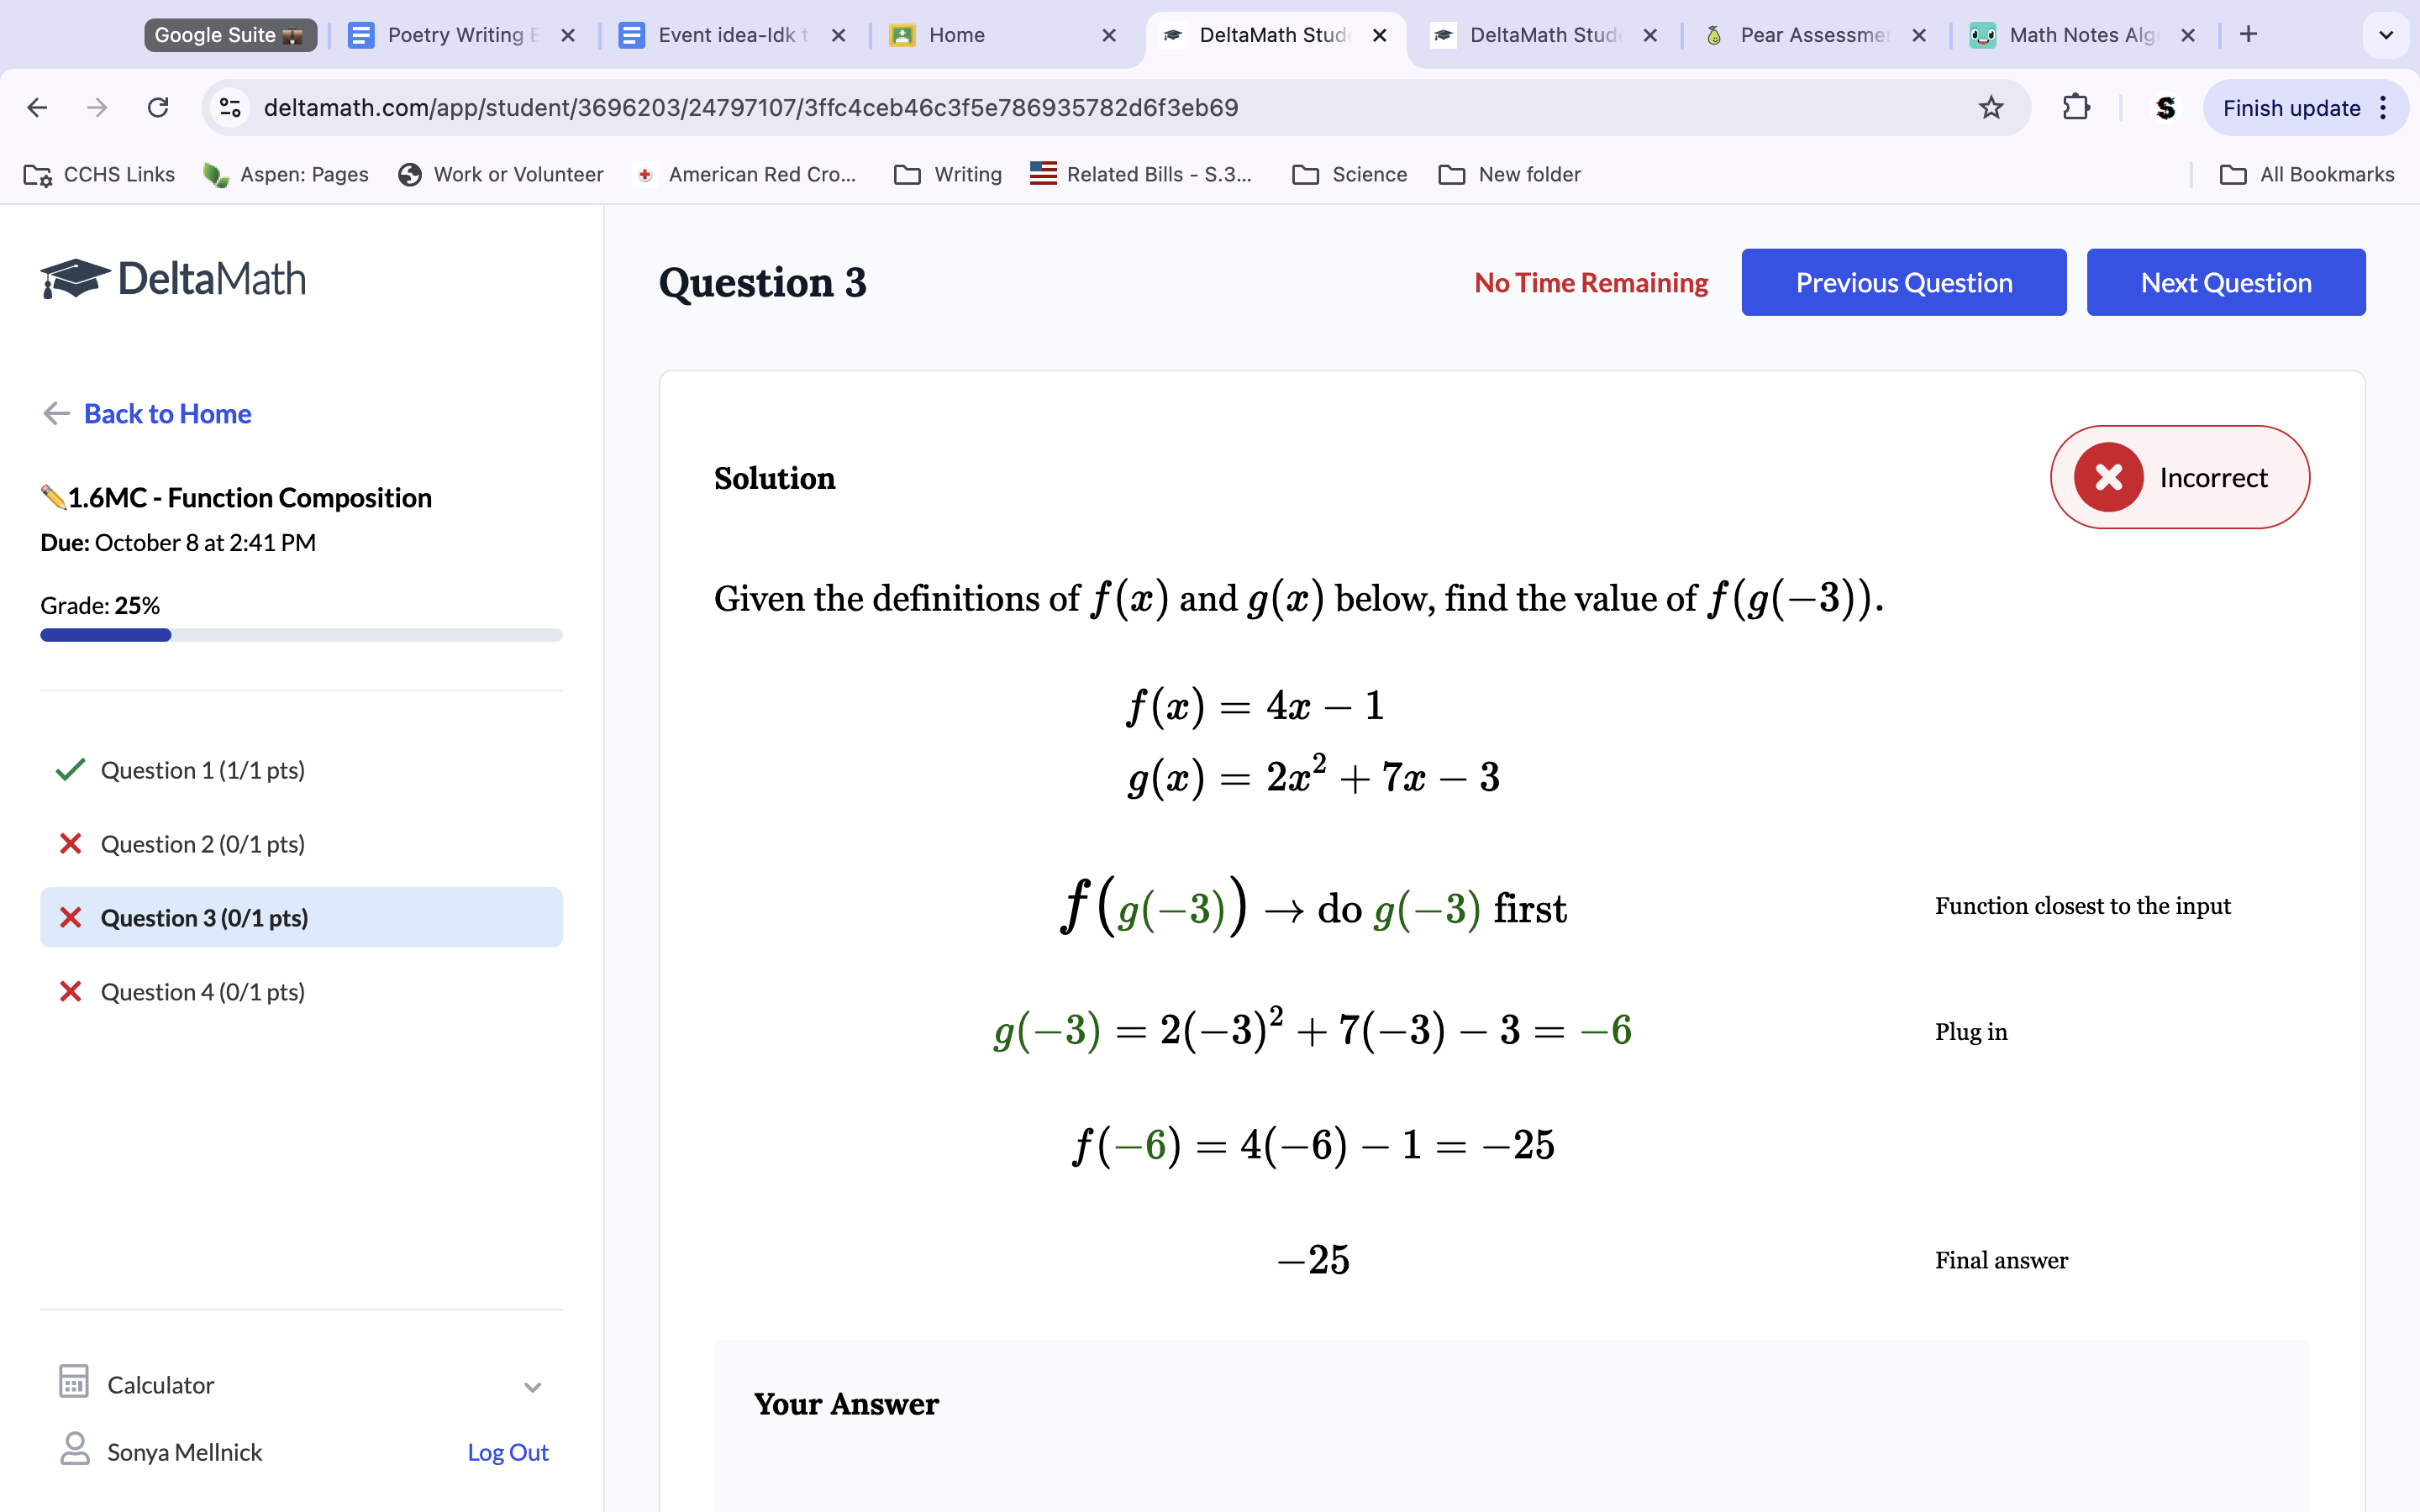
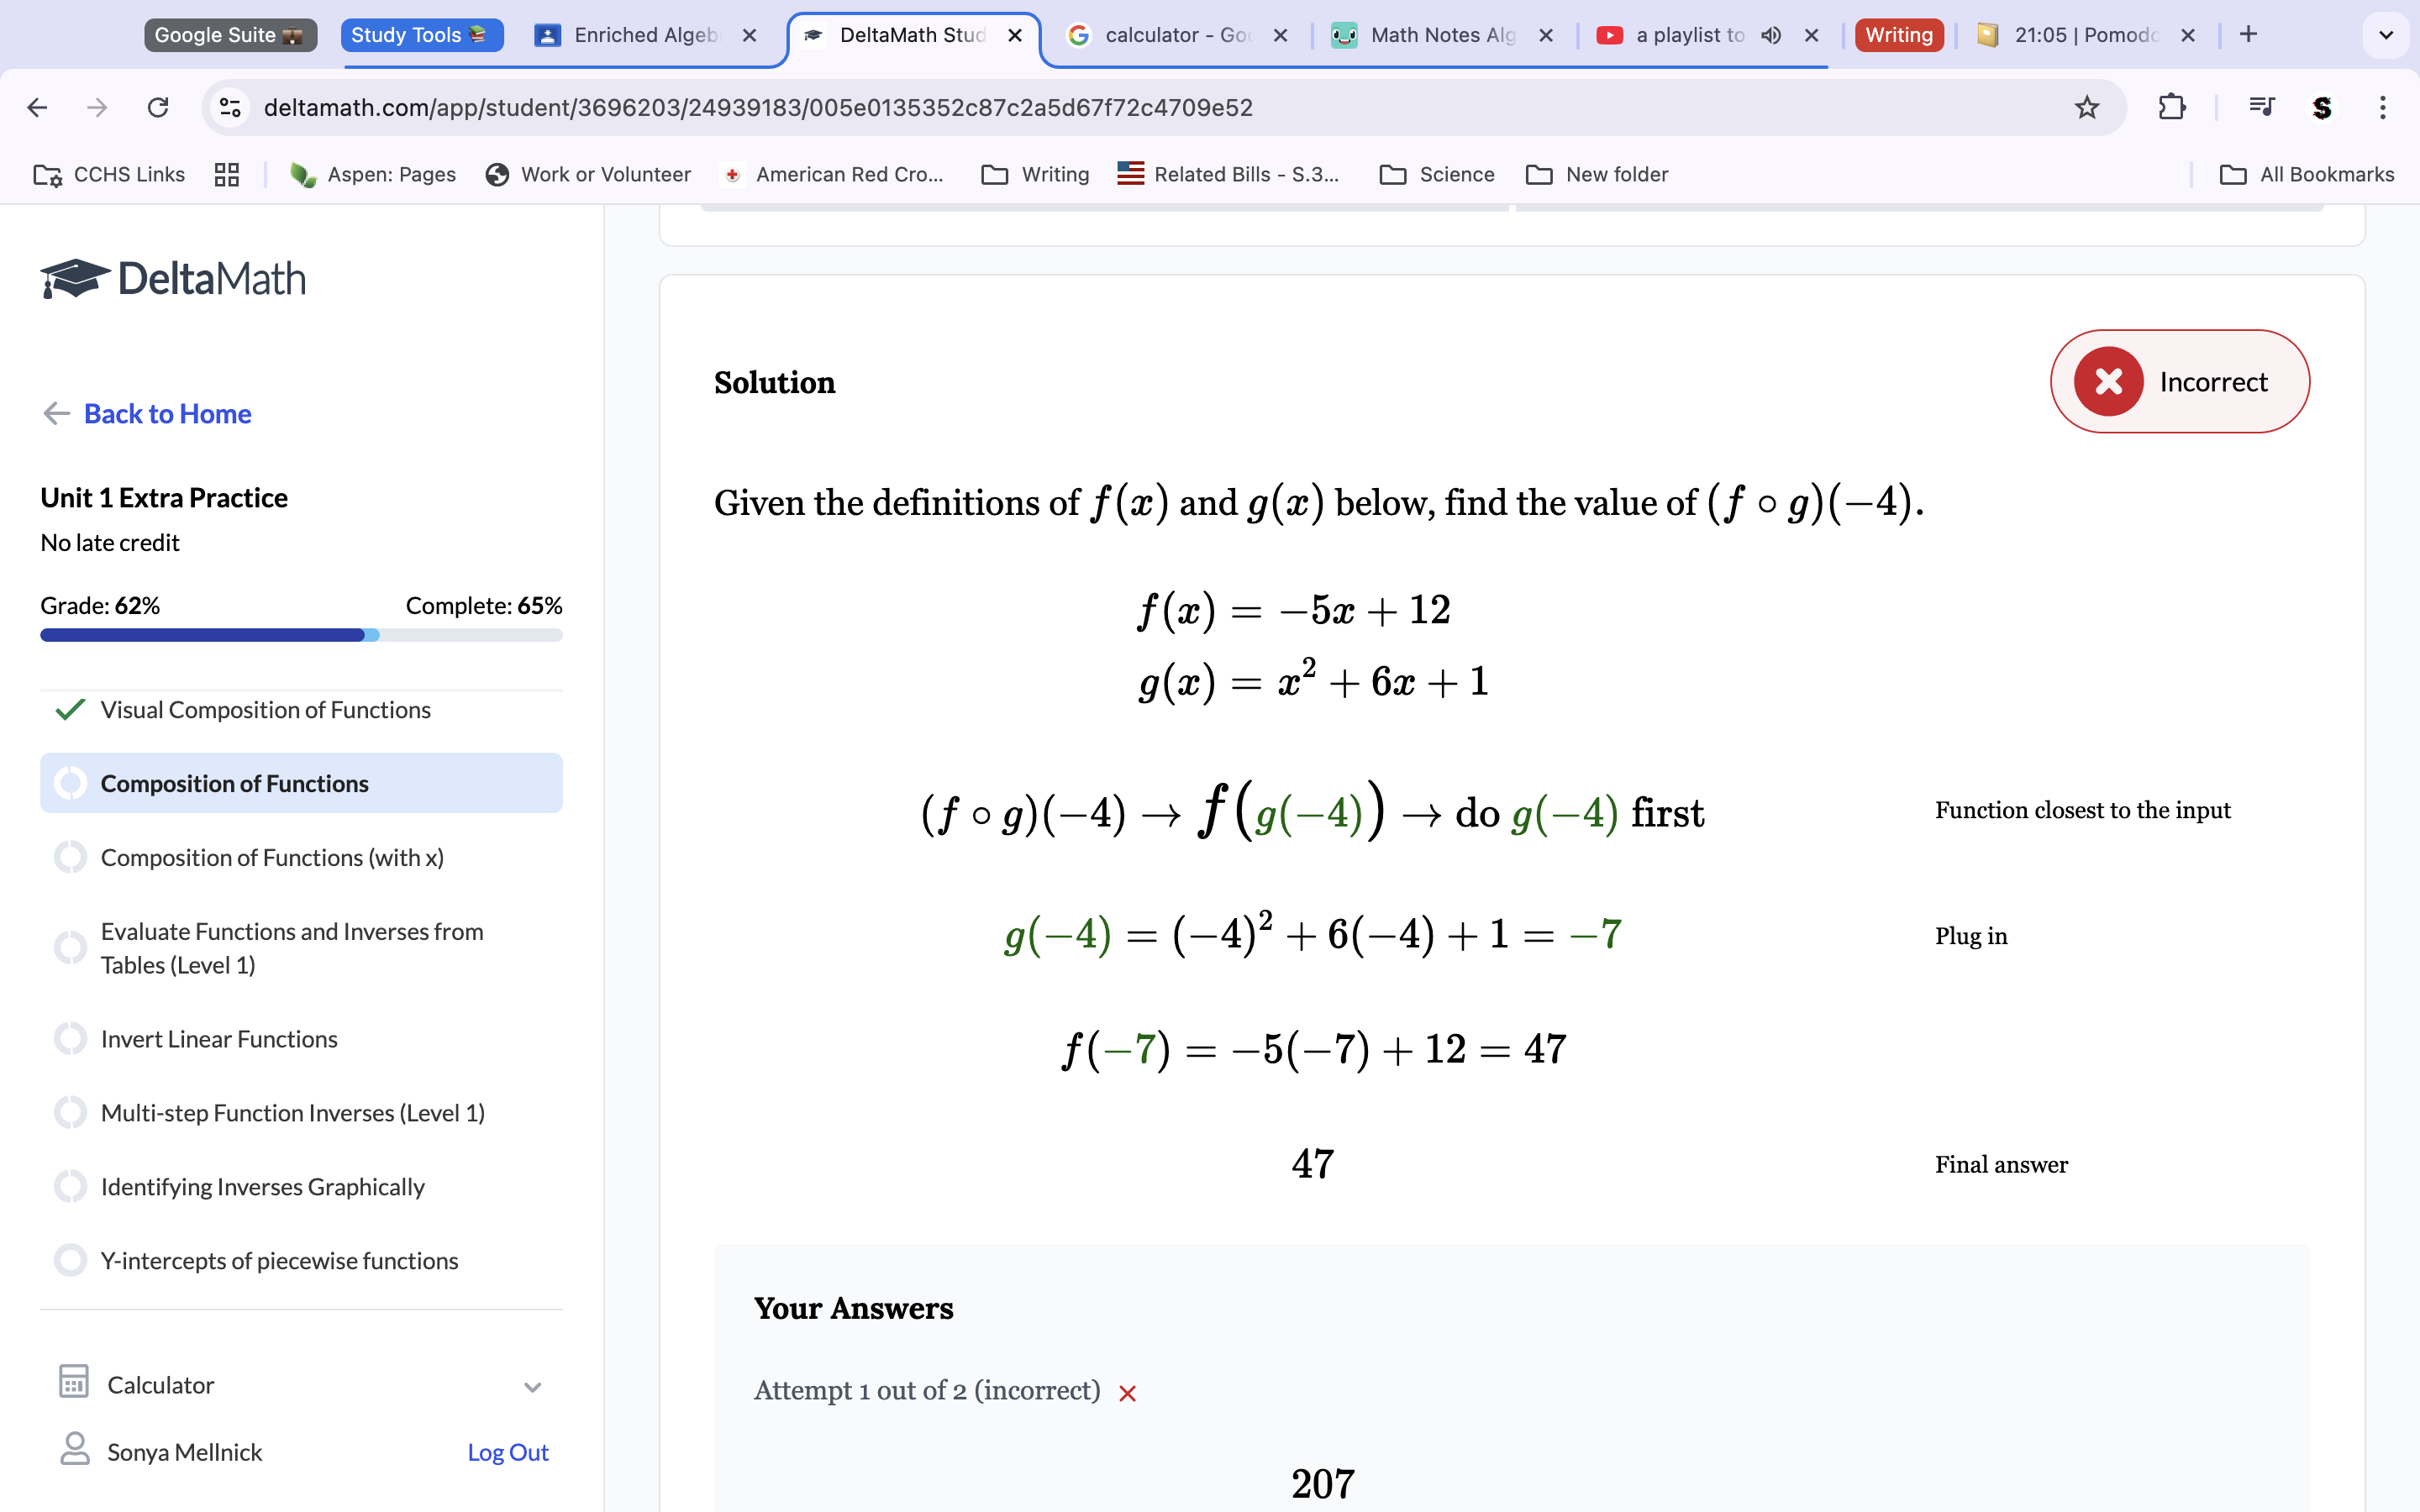
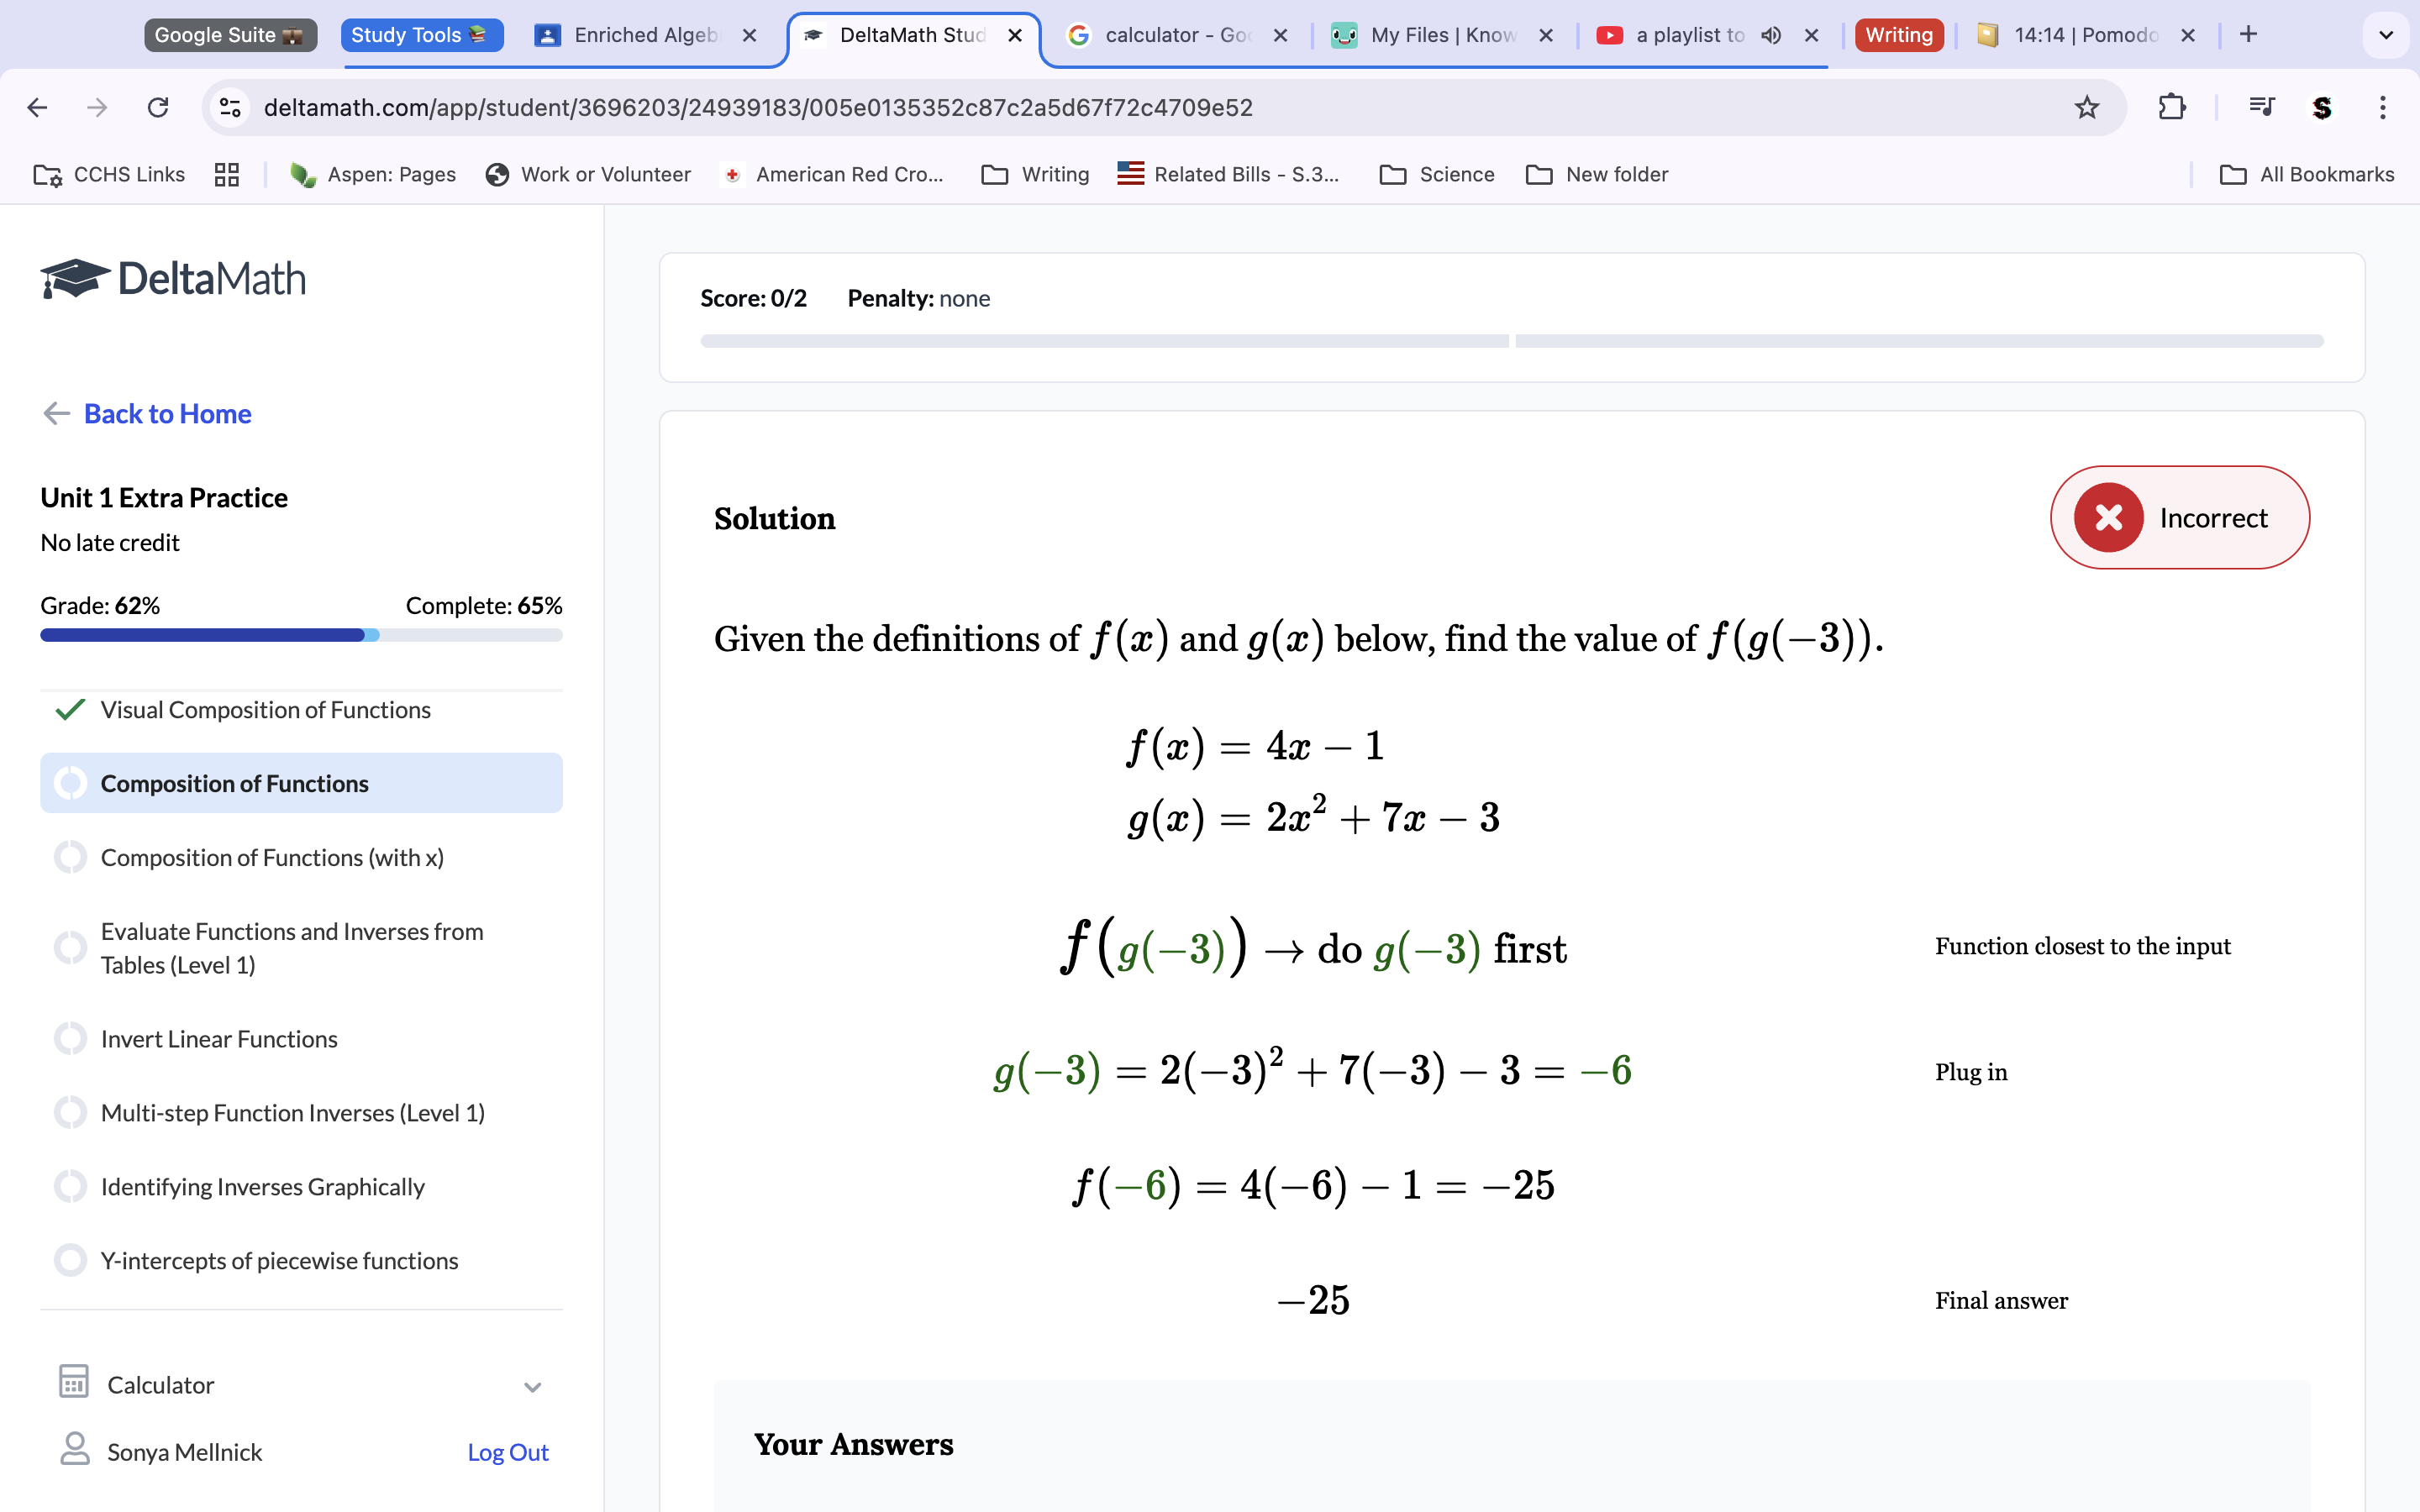
Question 3: Plug -3 into the g function. This gets 2(-3)2+7(-3)-3. Combine and multiply. Rememember to do the square on the parentheses number and multiply by it’s counterpart. This equation equals -6. This makes f(g(-3)=f(-6) since g(-3)=-6 and you work inside out. Plug f(-6) into the f equation. 4(-6)-1 (Final answer; -25).
-1.7 Mastery Check Retake-
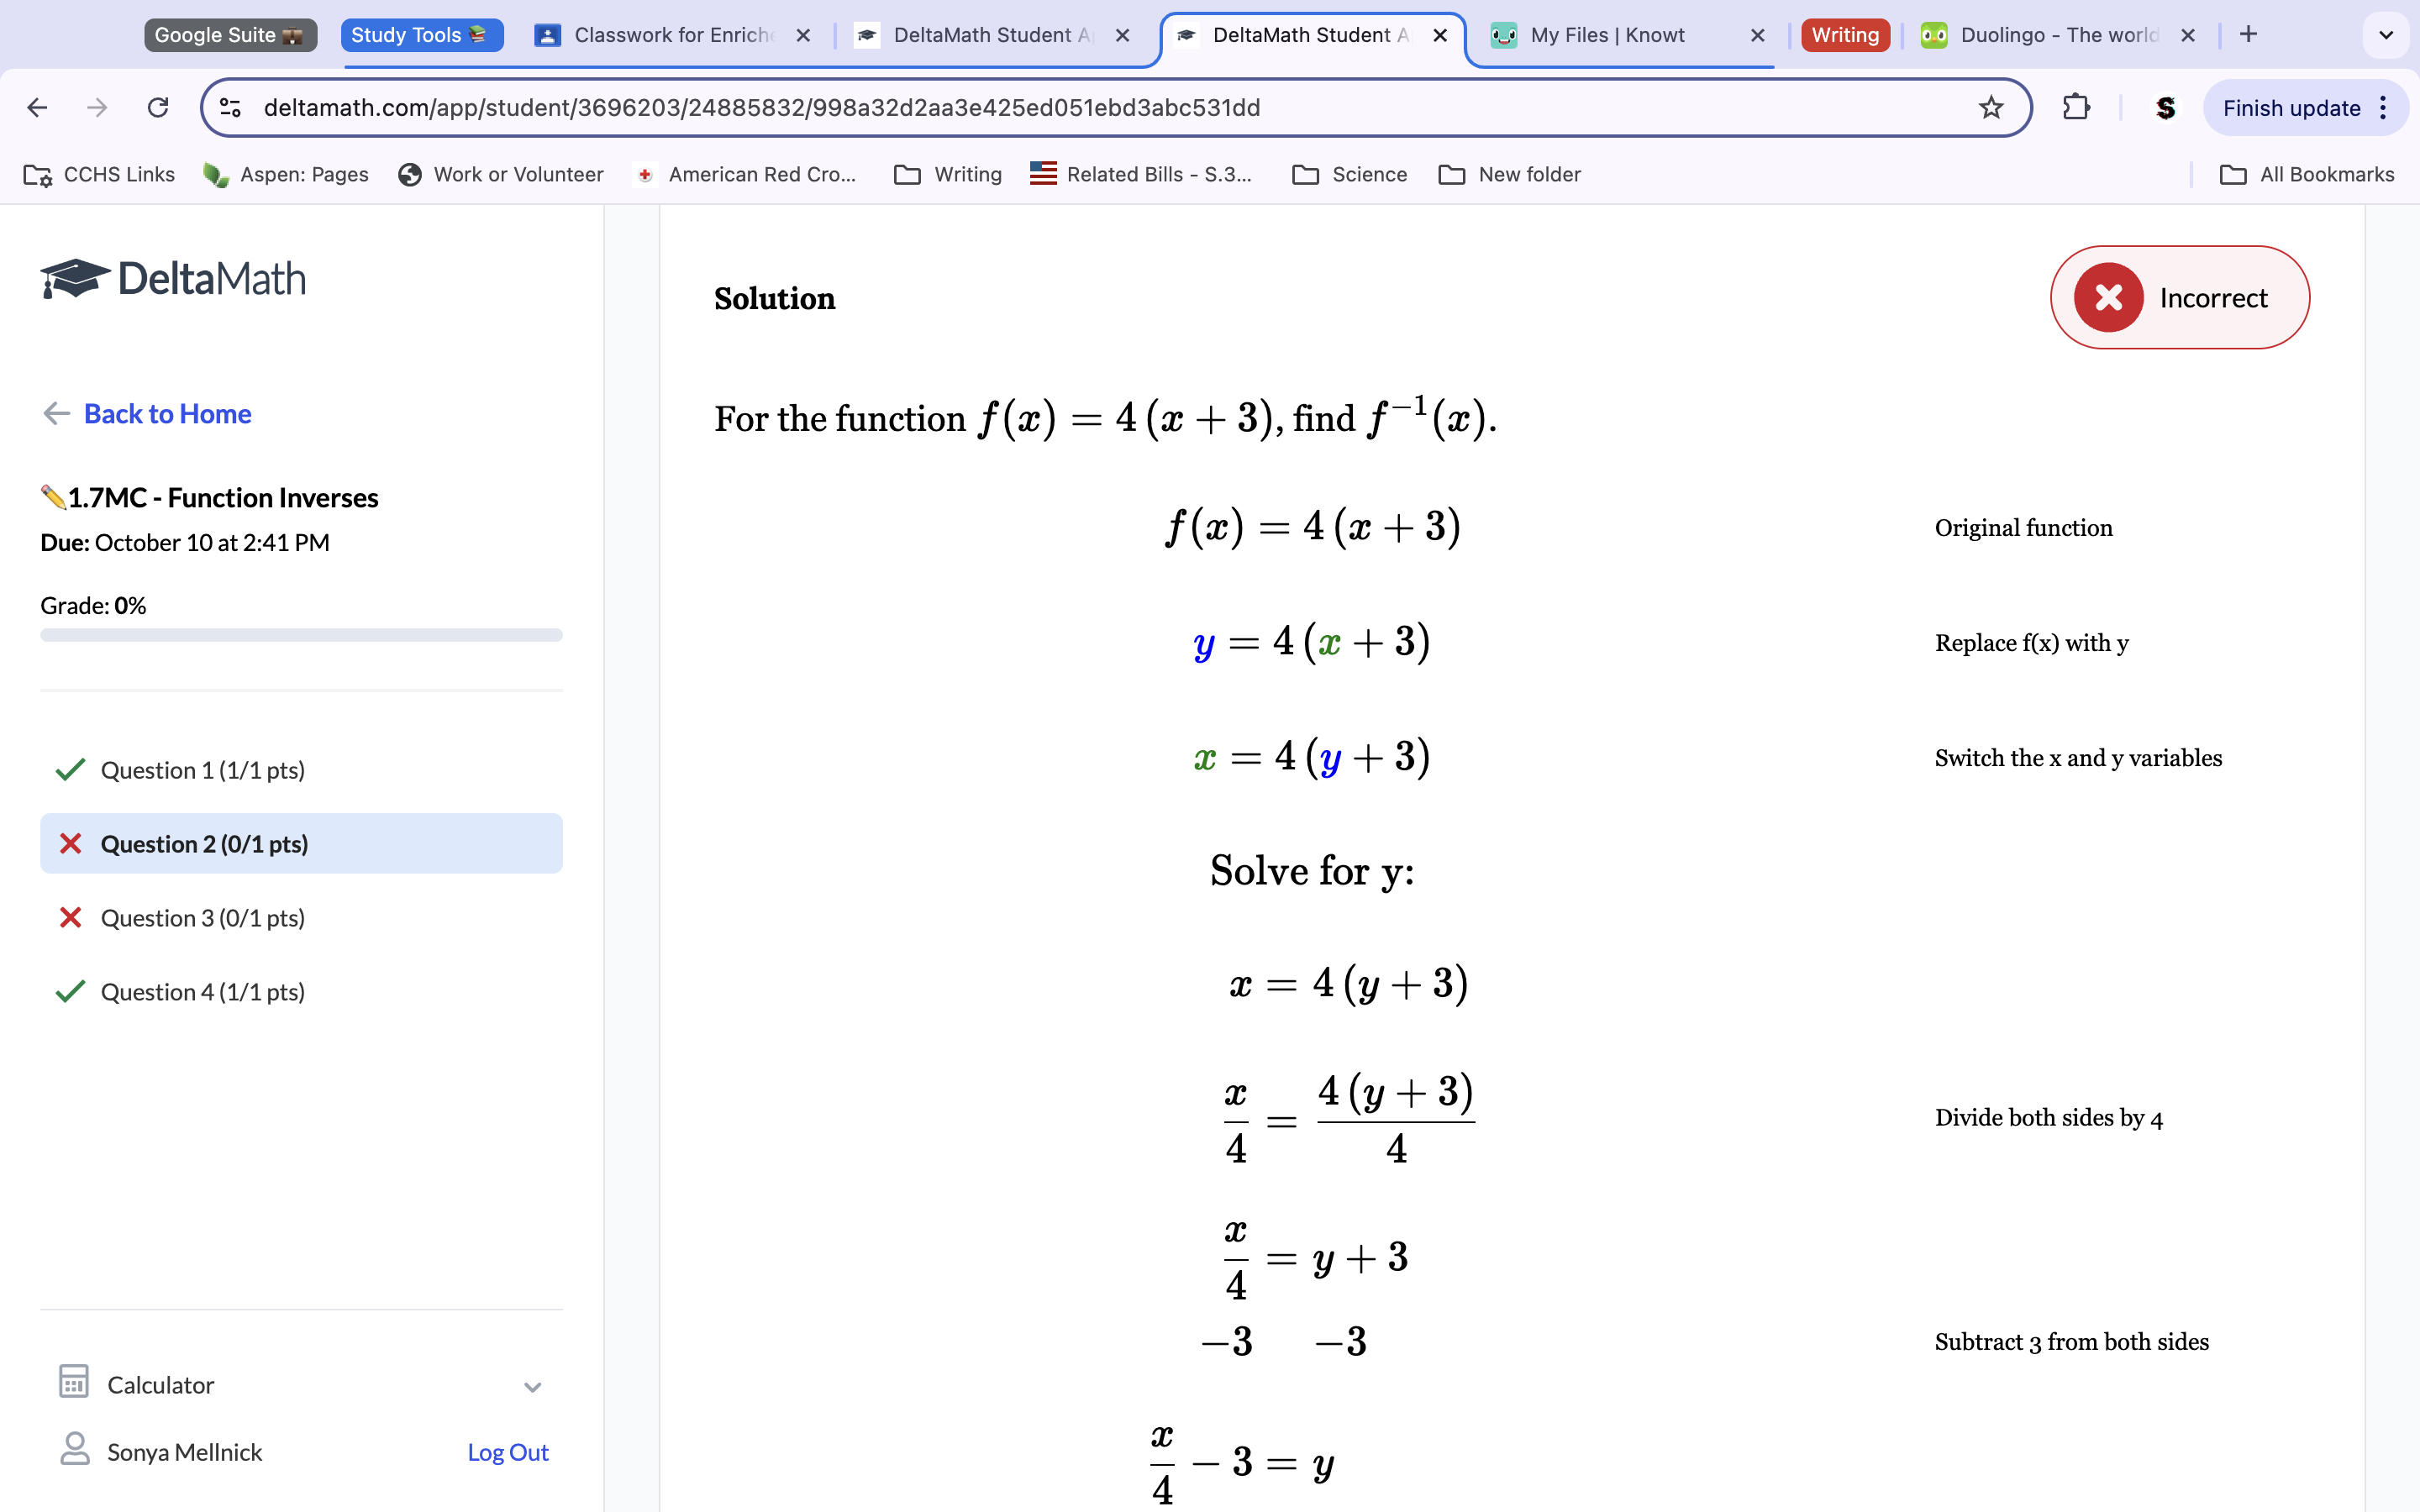
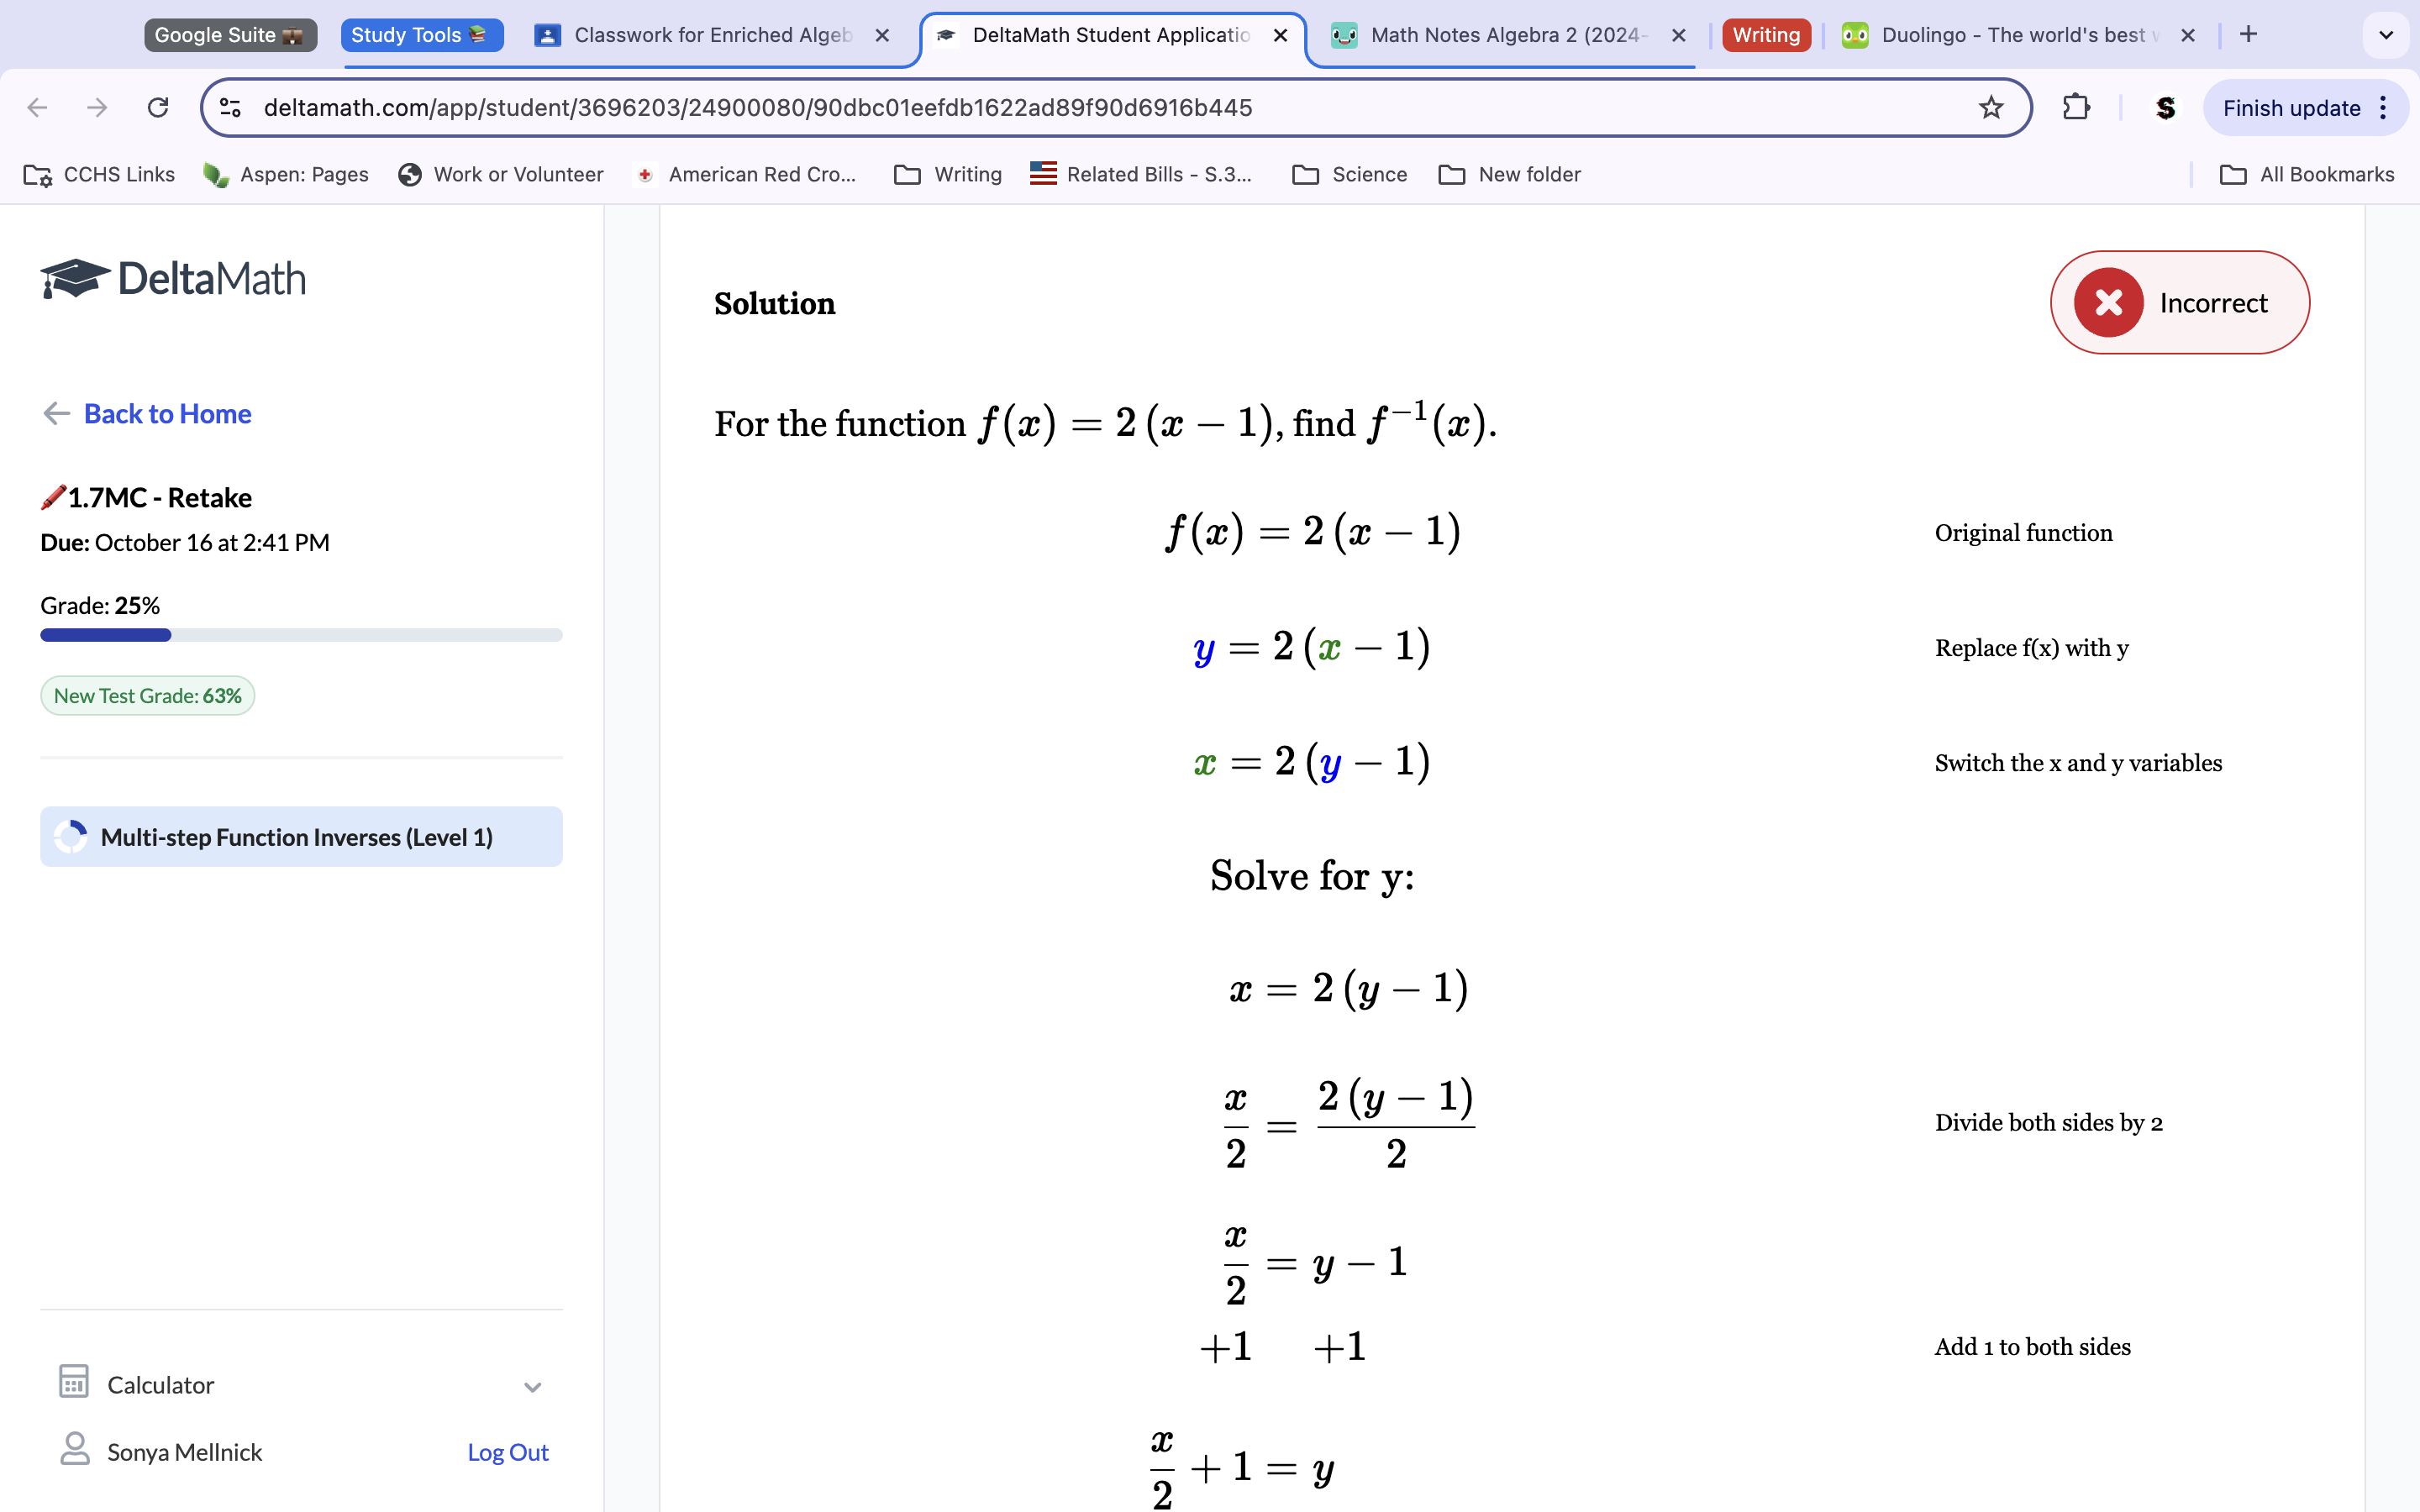
Question 2: Solution: f-1(x)=x/4-3
Swap the X and Y values and then get the Y alone to get the inverse function. Swapped values makes the function X=4(y+3). Use algebra to get the Y alone x/4=y+3. x/4-3=y (f-1(x))
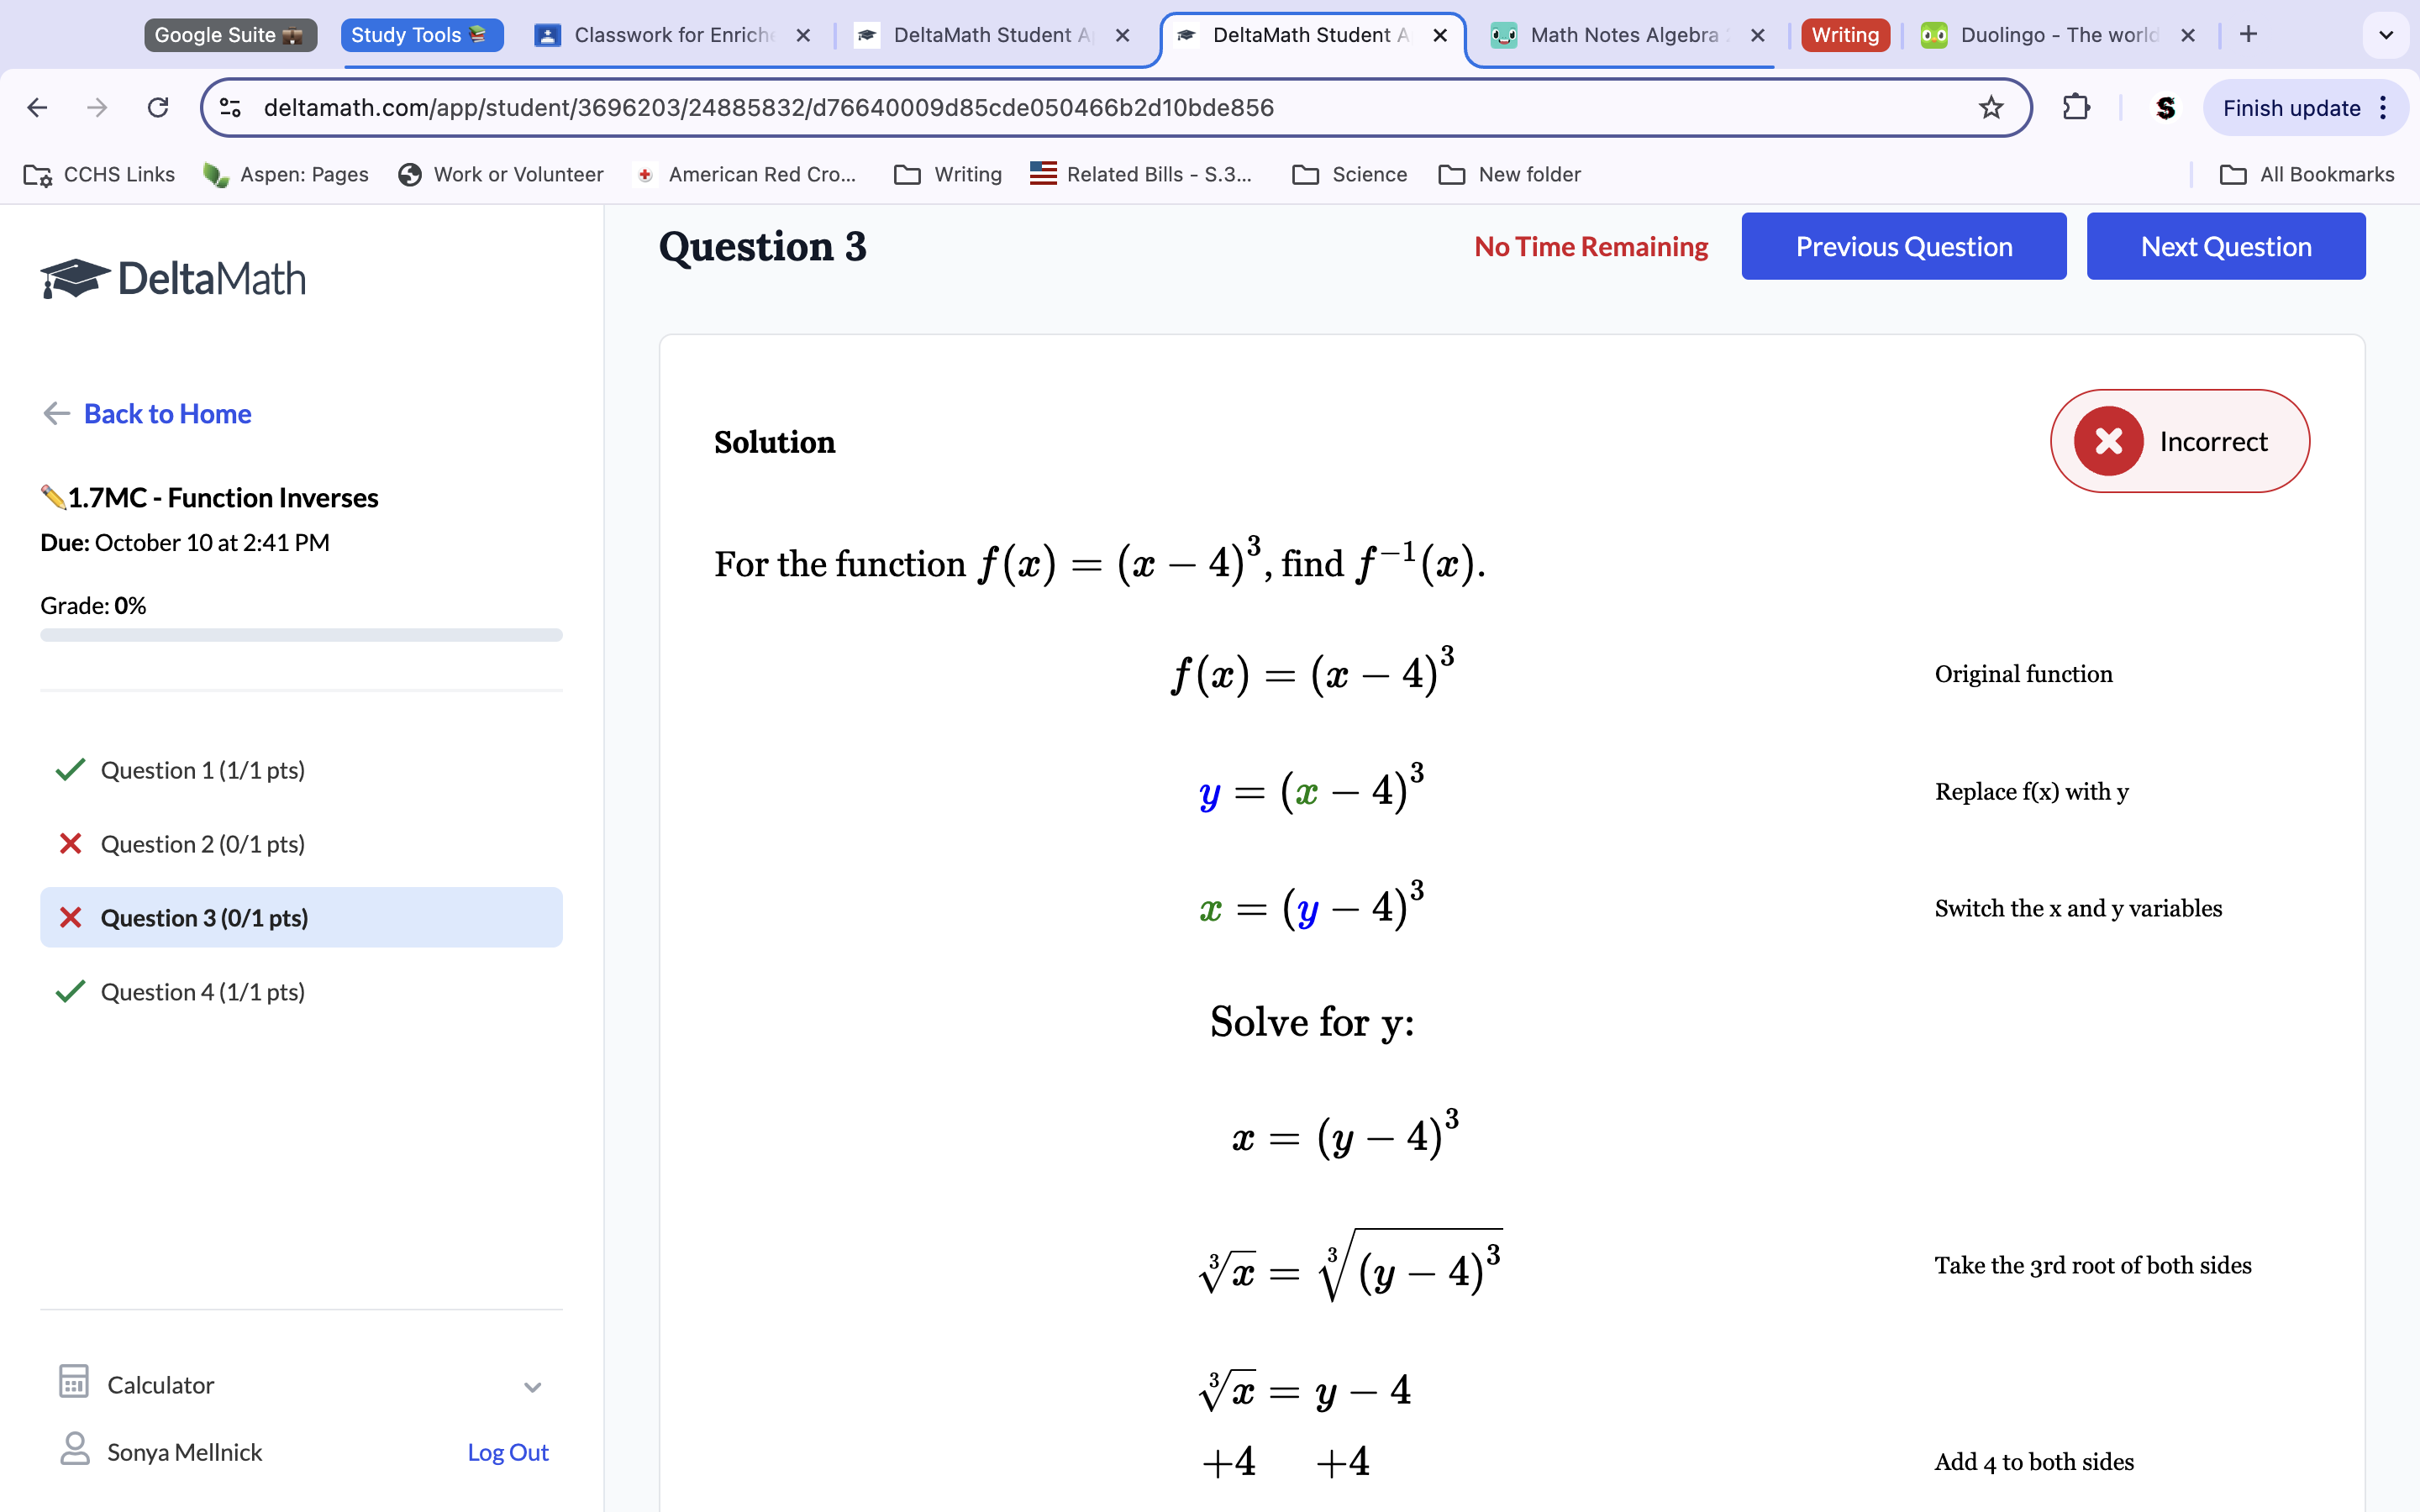
Question 3: Solution: f-1(x)=3√x+4
Swap the X and Y values and get the y alone to have the inverse function. x=(y-4)3. 3√x=y-4. 3√x+4=y.
Question 2a (retake) Solution: f-1(x)=2/x + 1
Swap the X and Y values and get the Y alone to get the inverse function. X=2(y-1). x/2=y-1. x/2+1=y.
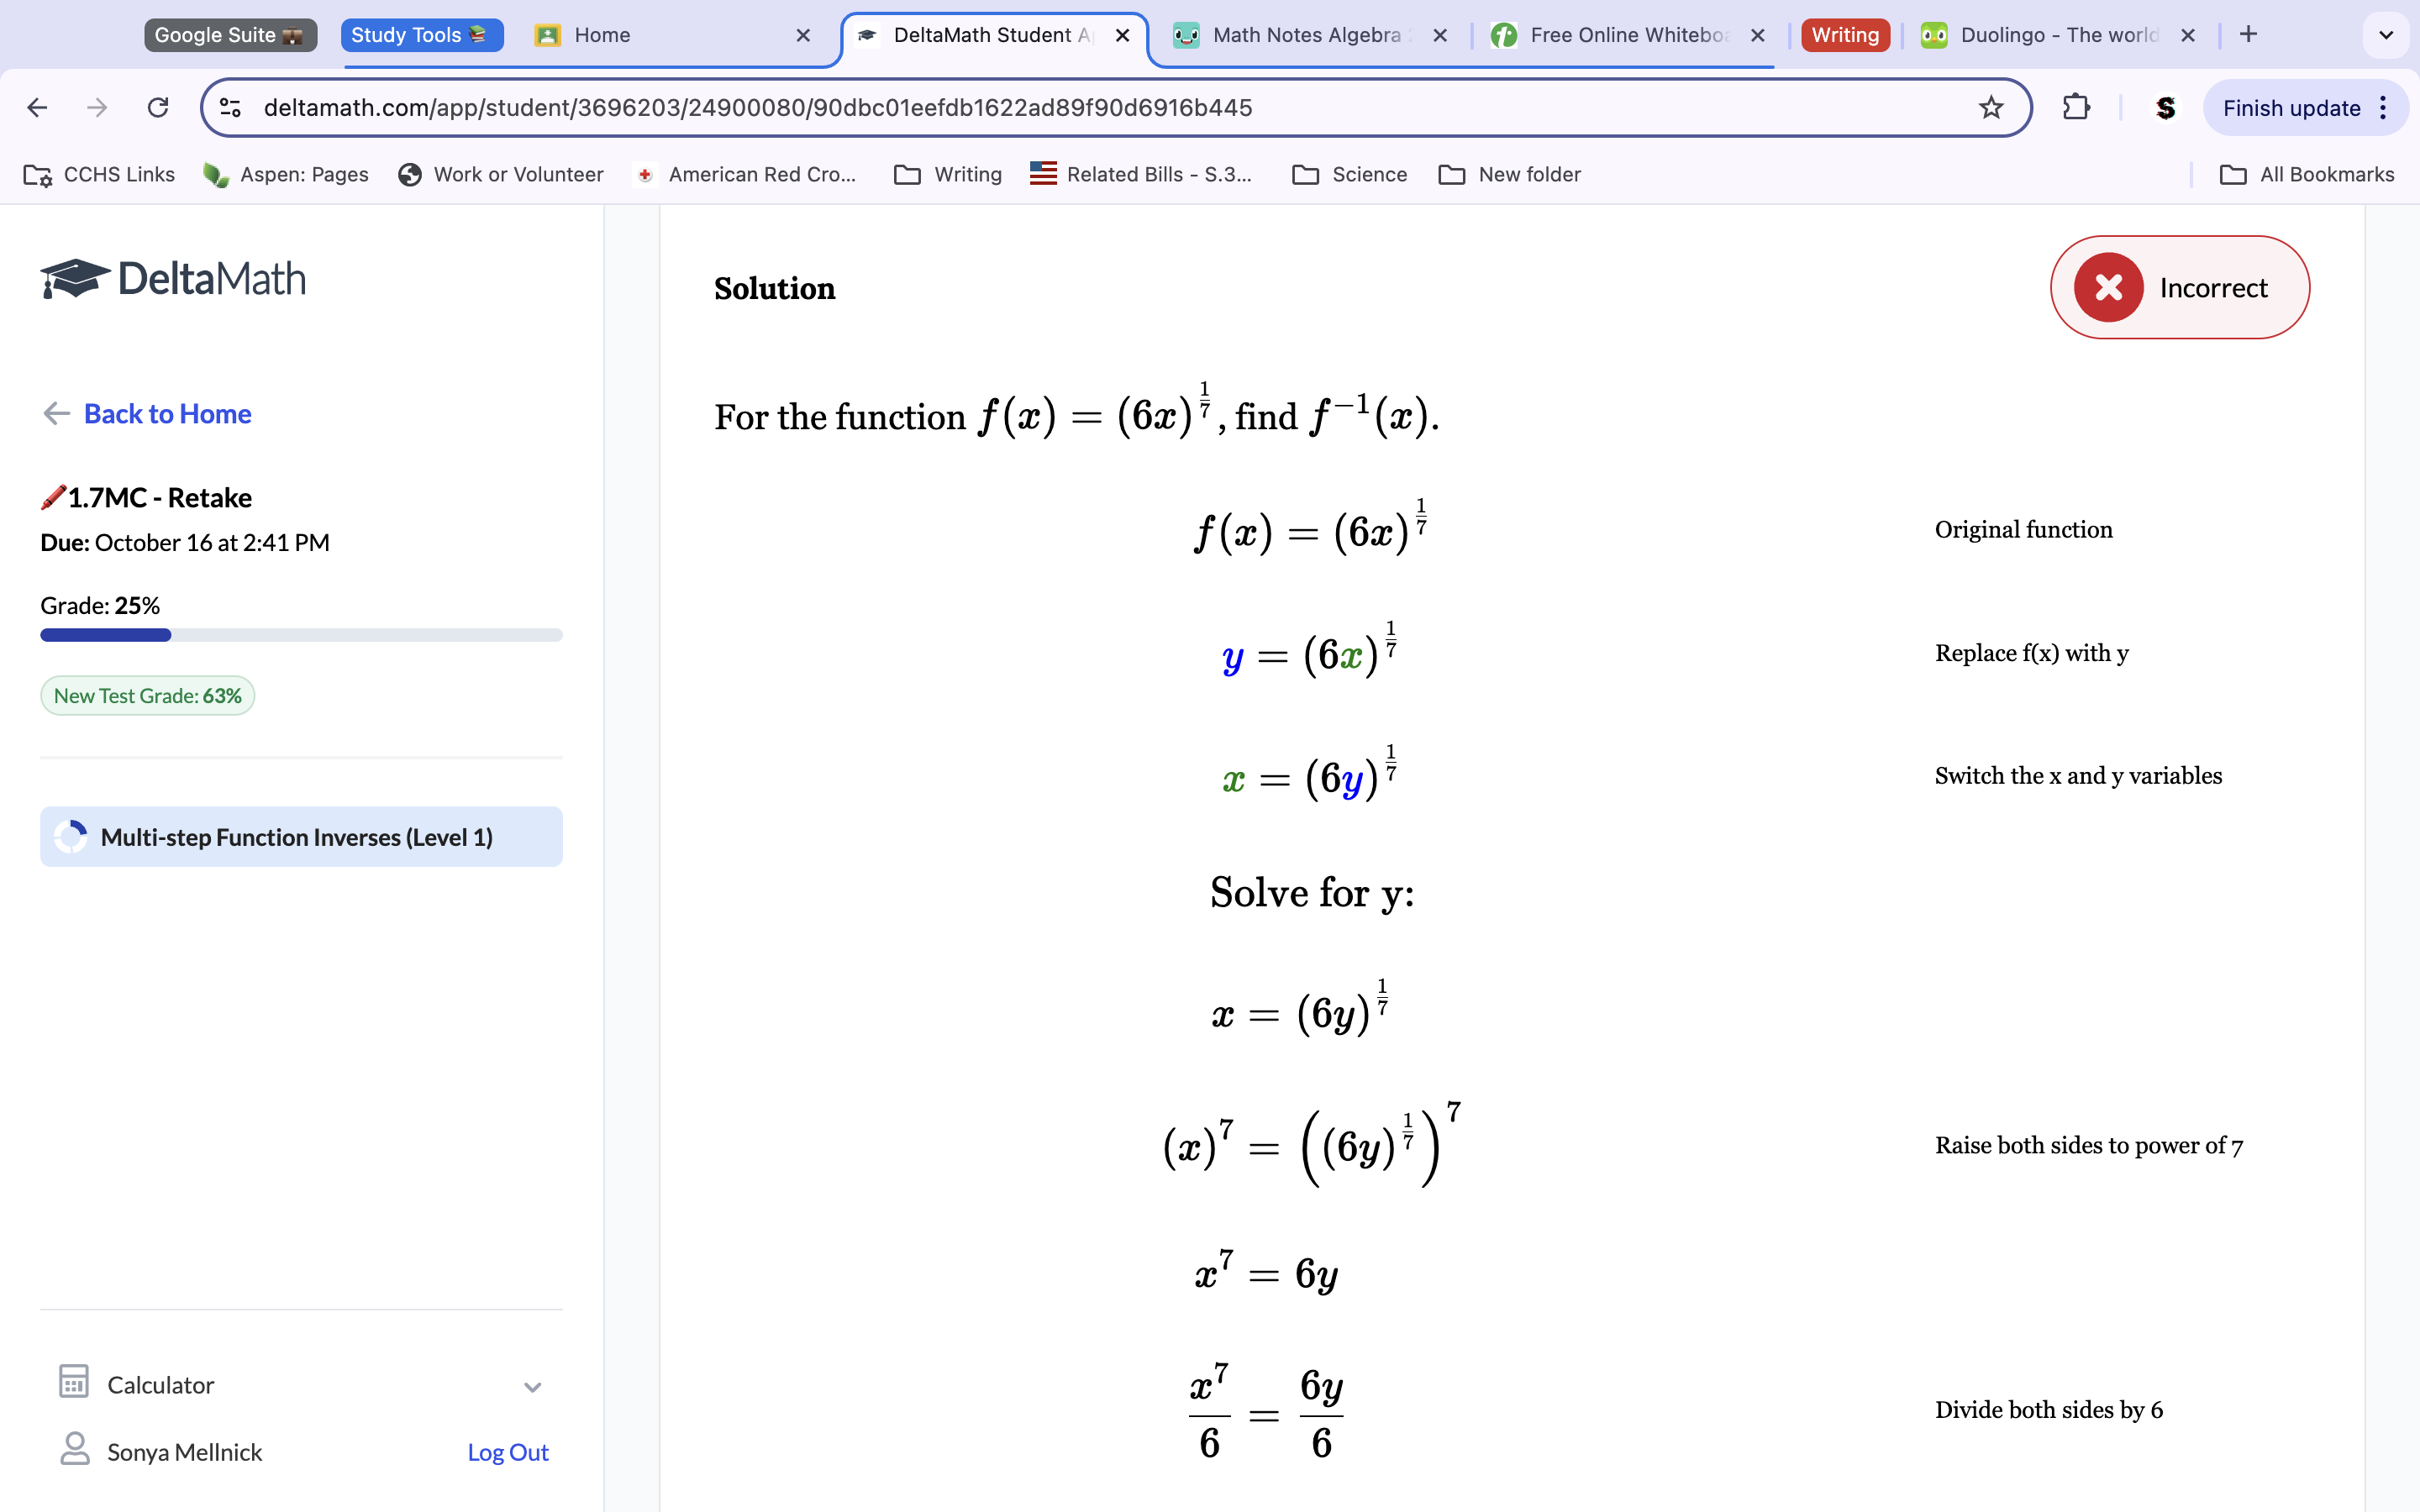
Question 2b(retake) Solution: f-1(x)=x7/6
Swap the X and Y values and get Y alone to find inverse function. X=6y1/7 X7=6y—> X7/6=y
-1.7 More Practice-
8.If g(7)=-3 and g-1(4)=2, find 1/3g(2)+5/3g-1(-3)
Because g(7)=-3 and g-1(4)=2, we can plug in the g(2) and the g(-3) for 4 and 7. This gets 1/3(4)+5/3(7). Use fraction multiplication to get 4/3+35/3=39/3. Simplify to get 13 as our final answer.
Study plan: Unit 1.1-1.2 Questions Friday, Unit 1.3-1.5 Saturday, Unit 1.6-1.7 Sunday Monday practice exams.
-1.7 CYU-
The Graph of function y=g(x) is shown below. The value of g-1(2) is:
Because it is an inverse function, we start at ‘2’ at the y-value instead of the x, and look to see what x value it corresponds with. It corresponds with -1.
-Unit 1 practice test-
Remember that functions need to have no repeating inputs, not outputs,
Remember that f(x)=10 means the equation is equal to 10, not X.
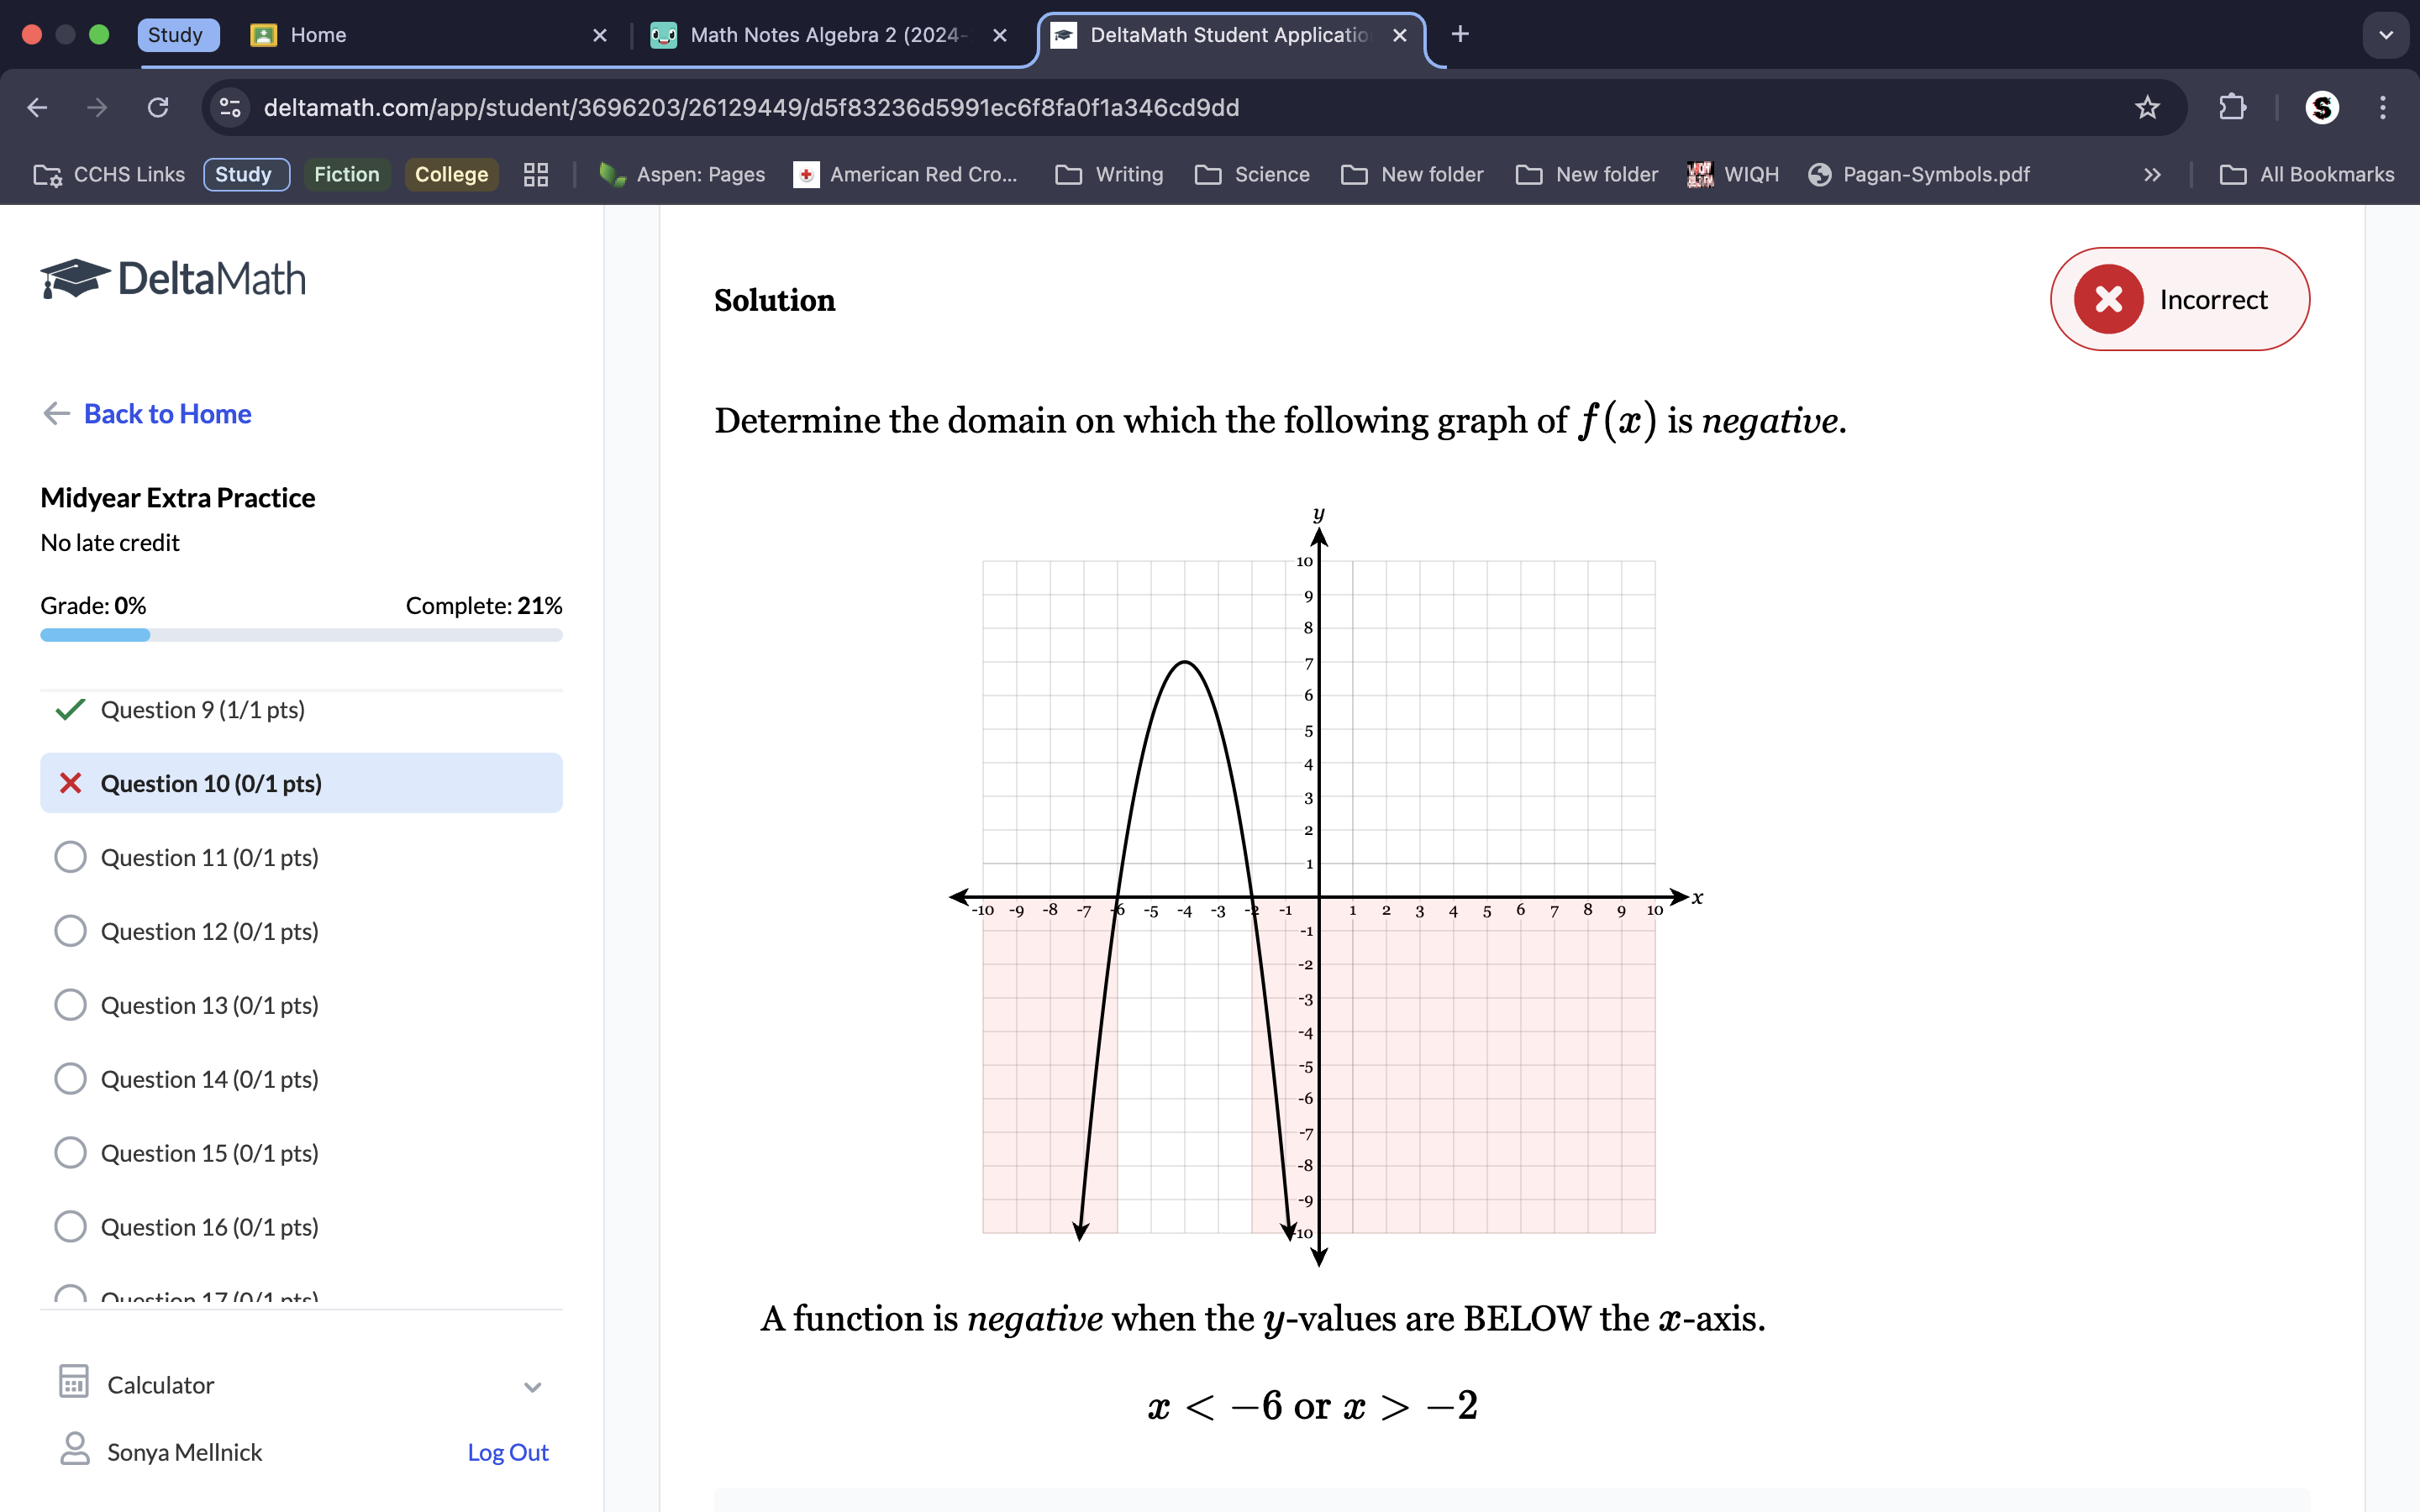
f(x)>0 means that it’s asking for the positive part of the line.
Remember to add the 2 first and then divide by 4. Add, then divide.
The Graph of a function and the Graph of it’s inverse will always be symmetrical to the Y=X line.
Put Y=2x-9 into point slope form with the point listed and solve by getting the y alone.
Because the distance is miles over the hour, we put miles/hour/minute, since distance/time.
20b. f(x)=5 is essentially asking y=5, so just look at how many times the line crosses the y point at 5.
21abc. Remember slope is y/x. Remember that to get the inverse function, you NEED to swap the x and y values and get the y alone. Only way that works.
Slope always starts from the lefternmost side. Count correctly.
24b. Remember to add/subtract first and then divide/multiply. To the opposite function to the other side to get answer.
Remember that slope is y/x.
29bc. Remember that you need to subtract the 922 from the 28m to get the number of cars. Remember that because it says after 25 minutes, you need to add 25 minutes to that 7 you got.
-Delta Extra Practice-
Solution: -1
~~UNIT 2.1~~
-2.1 Quick Check-
Which parent function(s) demonstrate a constant rate of change?
Absolute Value Functions and Linear Functions always have a constant rate of change because both are always going in a straight line, so the rate of change will remain the same throughout.
Identify the parent function in each of the following equations:
Rational: 1/x
Cubic: y=x3
Absolute Value: y=|x|
Exponential: y=x2
Square Root: y=√x
3a. Determine if the relationship is linear, quadratic, or neither.
Table a is a quadratic function. We know this because each of the y values goes down by a constant factor of -2. The first, 20-2=18, then, 18-4(which is -2-2)=14. Finally 14-6=8 and 8-8=0. All the values go down by a downwards shift of 2 added on each time.
~~UNIT 2.2-2.3~~
-2.2 Extra Practice-
5) Identify the solid parent function, then describe the transformation necessary to transform the Graph of f(x) into that of g(x). Write the equation of the graphed line.
The parent function in graph 5 is an absolute value function, so the equation for it will be y=|x|. On the dotted line, we see the line has been moved right 3 and up 1, so those are our transformations. To put those transformations into equation form, we plug the 3 into the ‘x’ part of the equation and put the 1 on the outside, because it represents the Y. X equations are swapped from left and right, so 3 becomes -3. Plug in. This should get you an equation of g(x)=|x-3|+1.
6) Identify the solid parent function, then describe the transformation necessary to transform the Graph of f(x) into that of g(x). Write the equation of the graphed line.
The parent function of graph #6 is a cubic function. This means it’s equation for it will be y=x3. The dotted line shows that the function was moved up 3 and right 1. Despite looking reflected, you need to count the points from the original to the new function to make sure. We see in this one it actually isn’t reflected. Plug the Transformations into he equation in their correct formats (x value reflected and put in the inside function, y on the outside). This gets us an equation of g(x)= (x-1)3+3.
19) Sketch the Graph of Each Function. g(x)=x3-3
The function in the equation is cubic so we will put a cubic parent function on the Graph. After doing so, we will move the Graph’s points down 3, because that is what is shown on the equation.
20) Sketch the Graph of Each Function. g(x)=1/x-2
The function shown here is a rational function, so we place a rational parent function on the Graph. Shift the function down 2 because that is what is shown on the outer side of the equation.
27) y=4x+2
28) y=2x+1
29) y=2x+1-2
30) y=2x+2+1
-Quizziz 2.2-2.3-


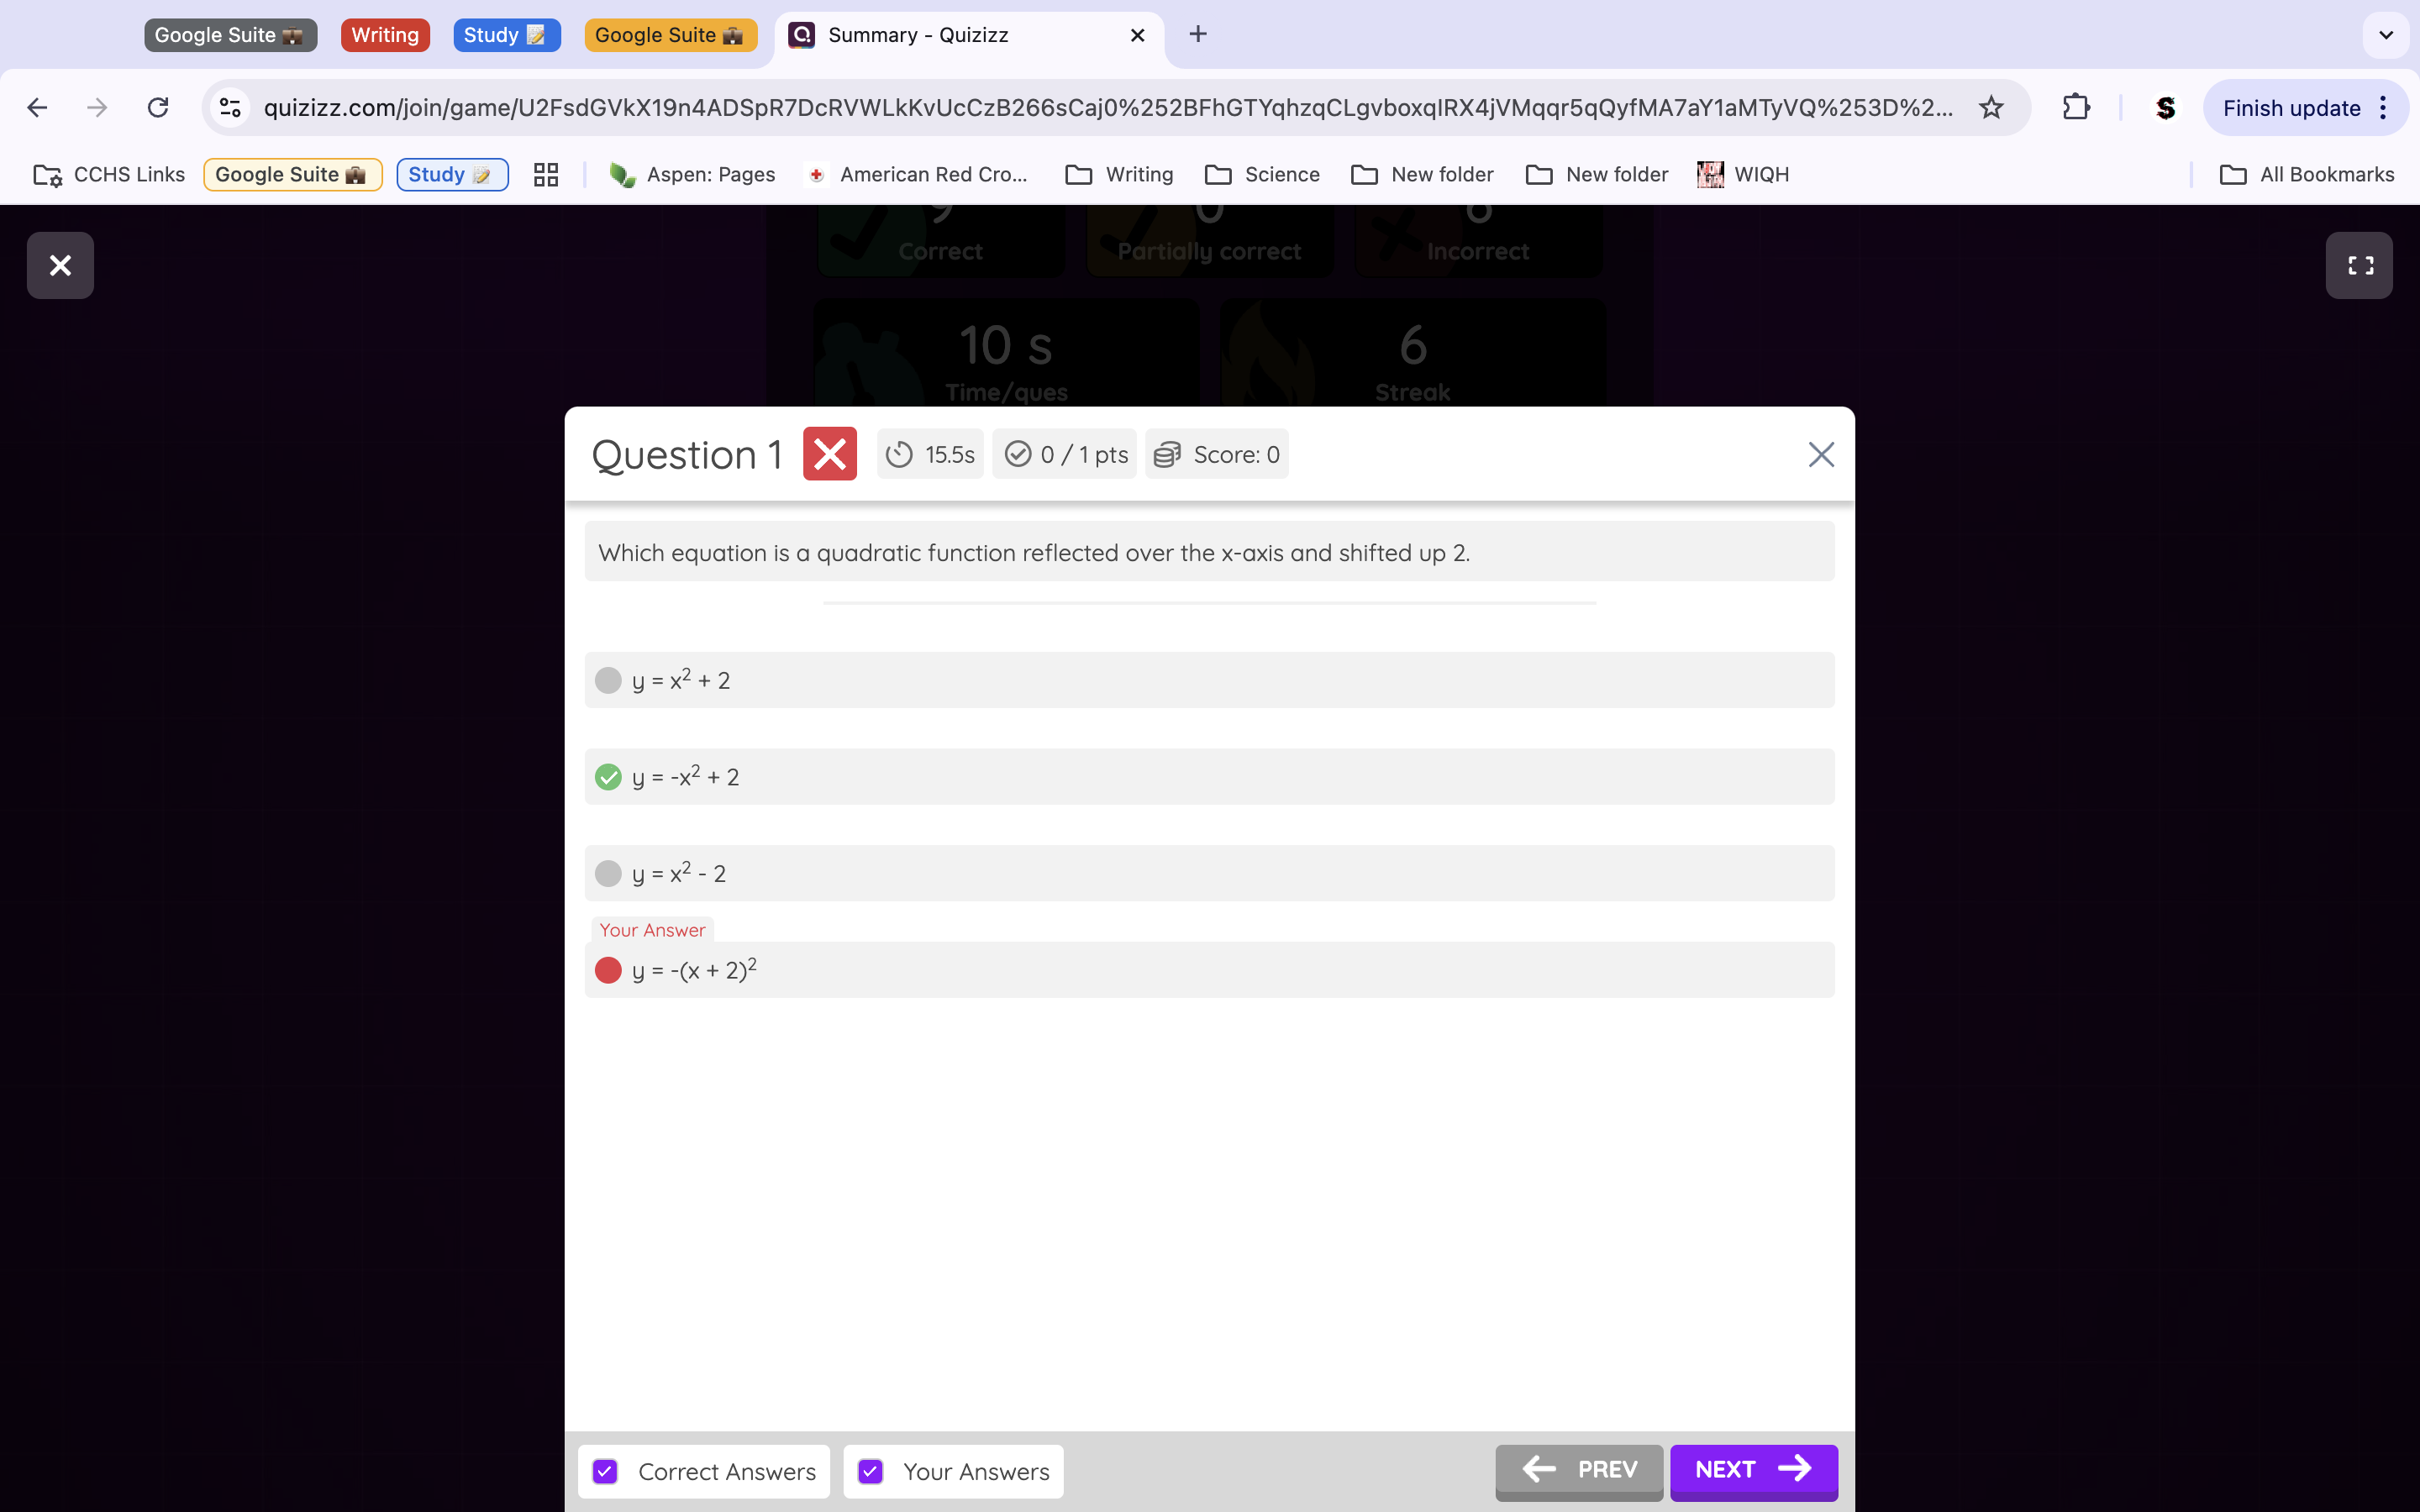
Question 1: The correct answer is B, because in order to reflect it over the x-axis, we put the negative symbol within the x function, and to shift it up 2, we put a +2 outside the function because up/down are in reference to the y-values.
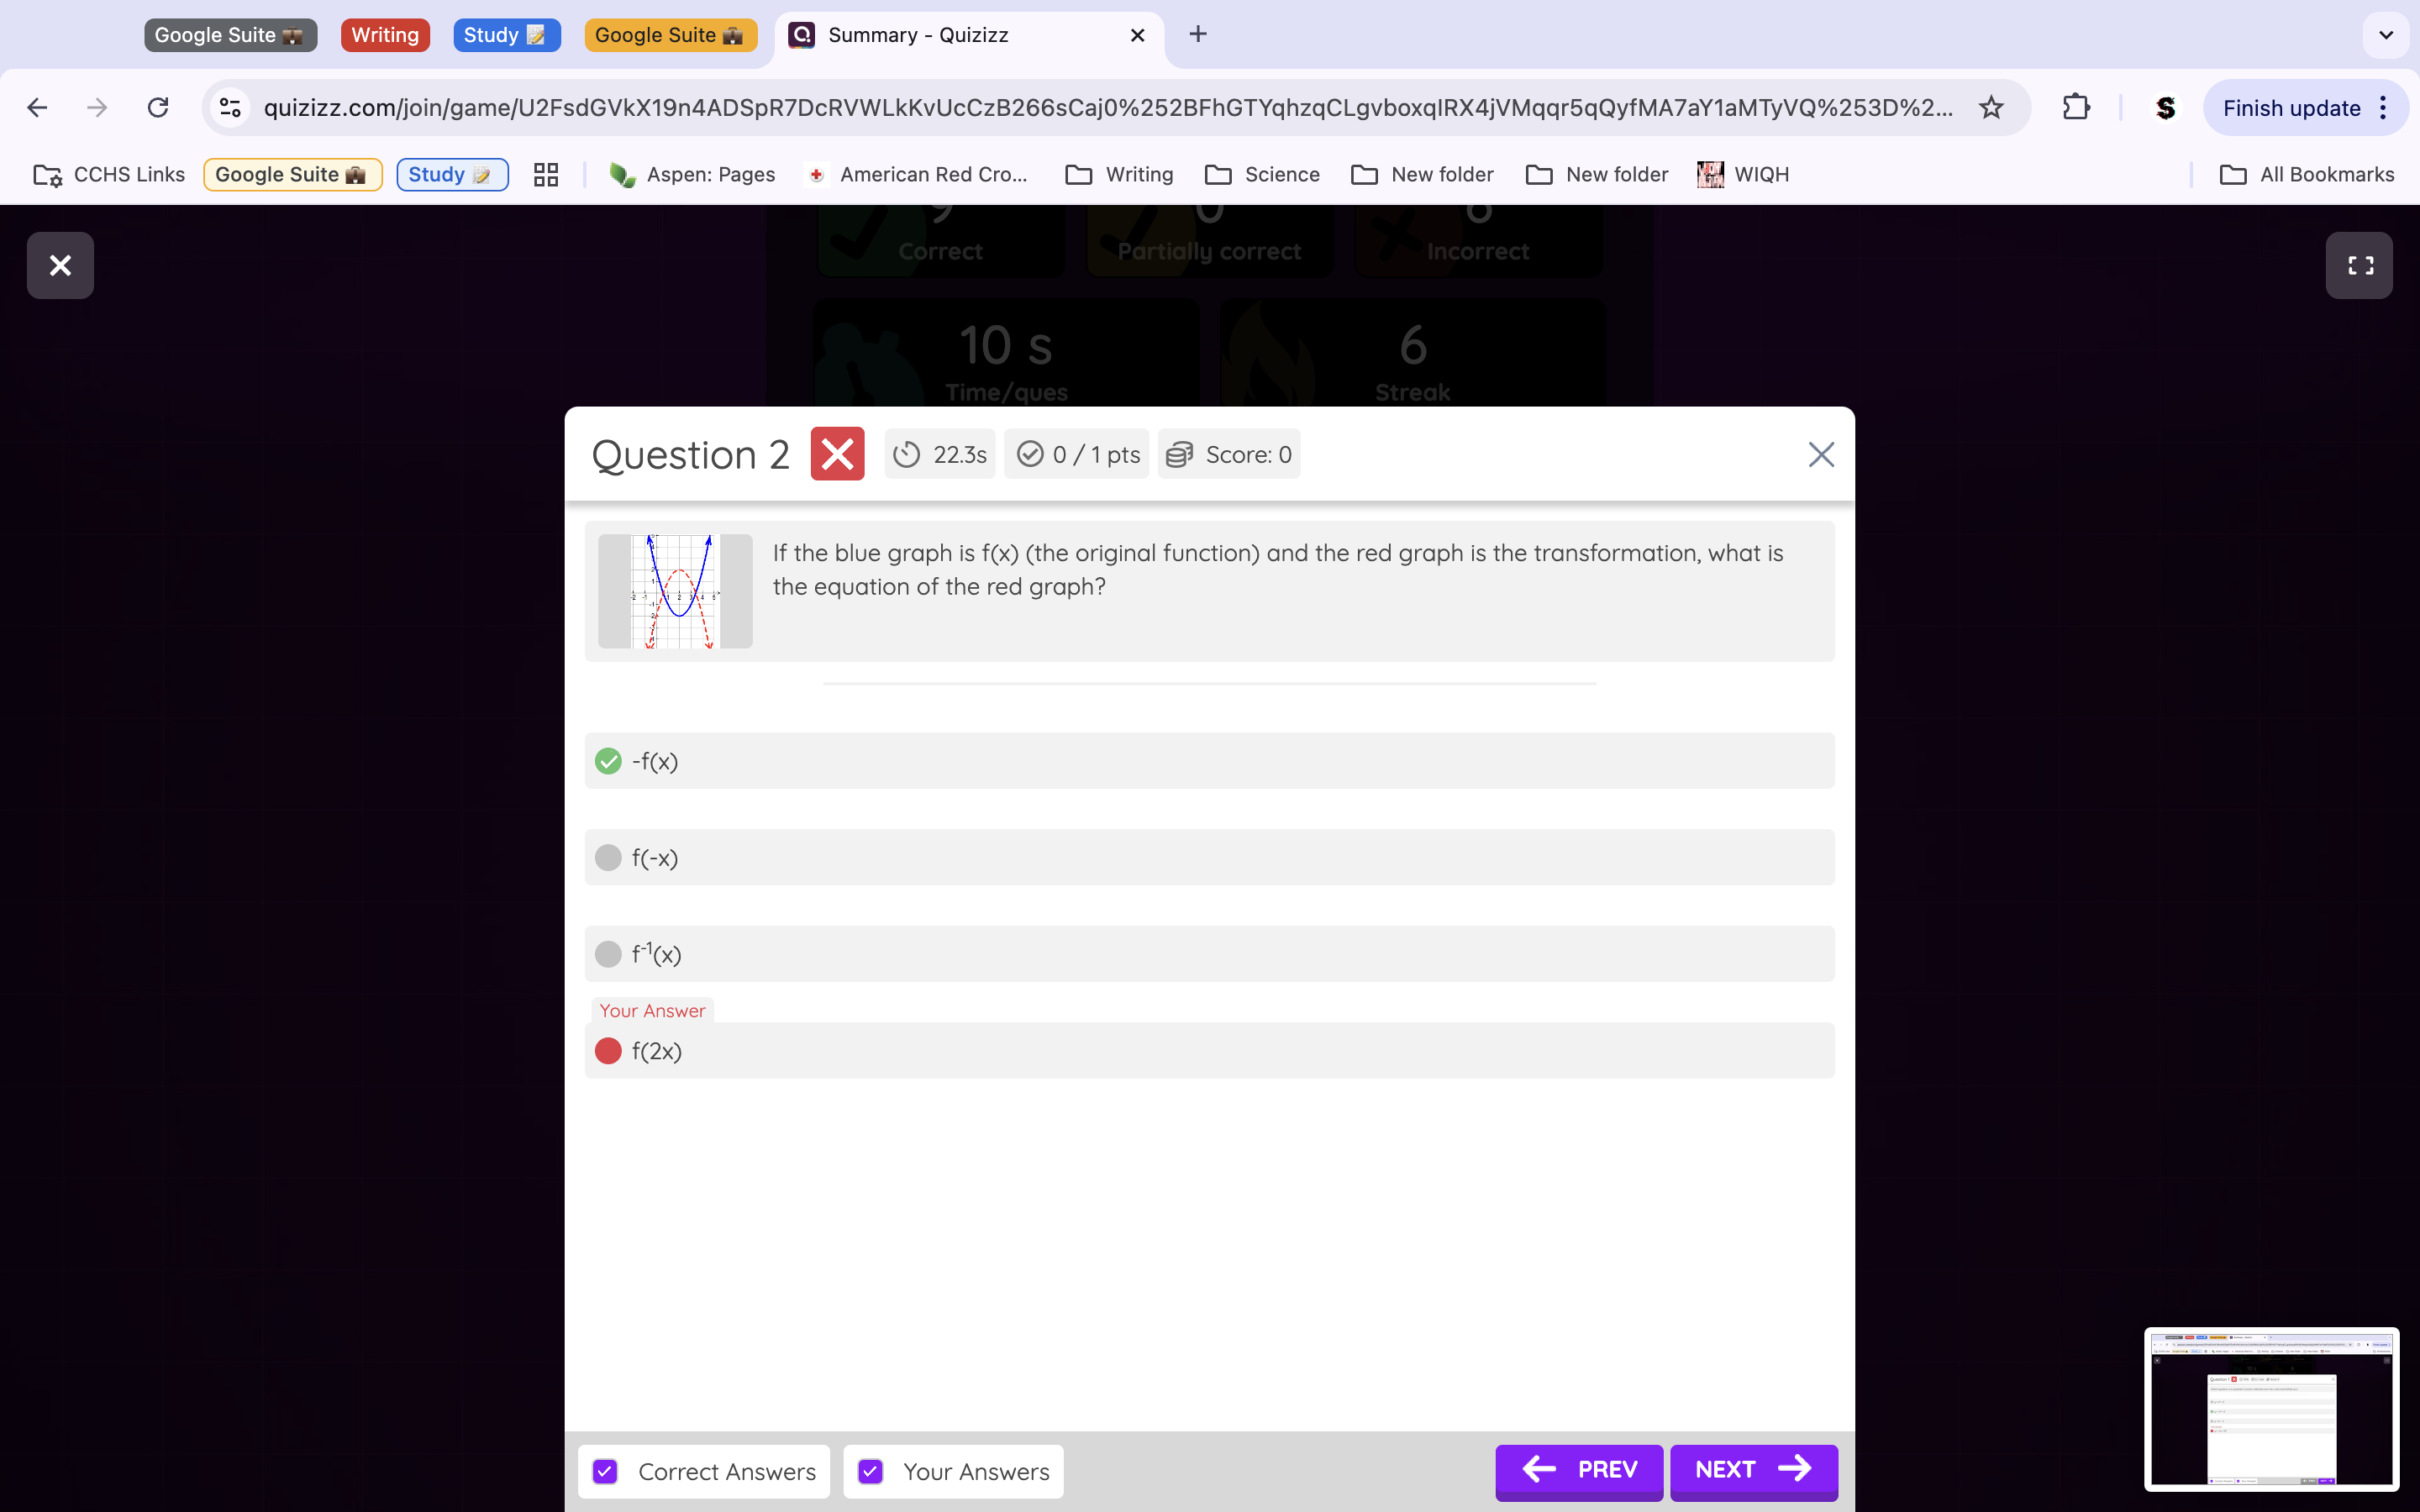
Question 2: The correct answer is A, because we are reflecting the function over the X axis, so a negative sign goes outside the function (outside because it’s reflected, and the opposite of where x and y values usually are).
Question 11: The Graph shown is a quadratic function, so the correct answer would be the quadratic equation (y=x2), C.
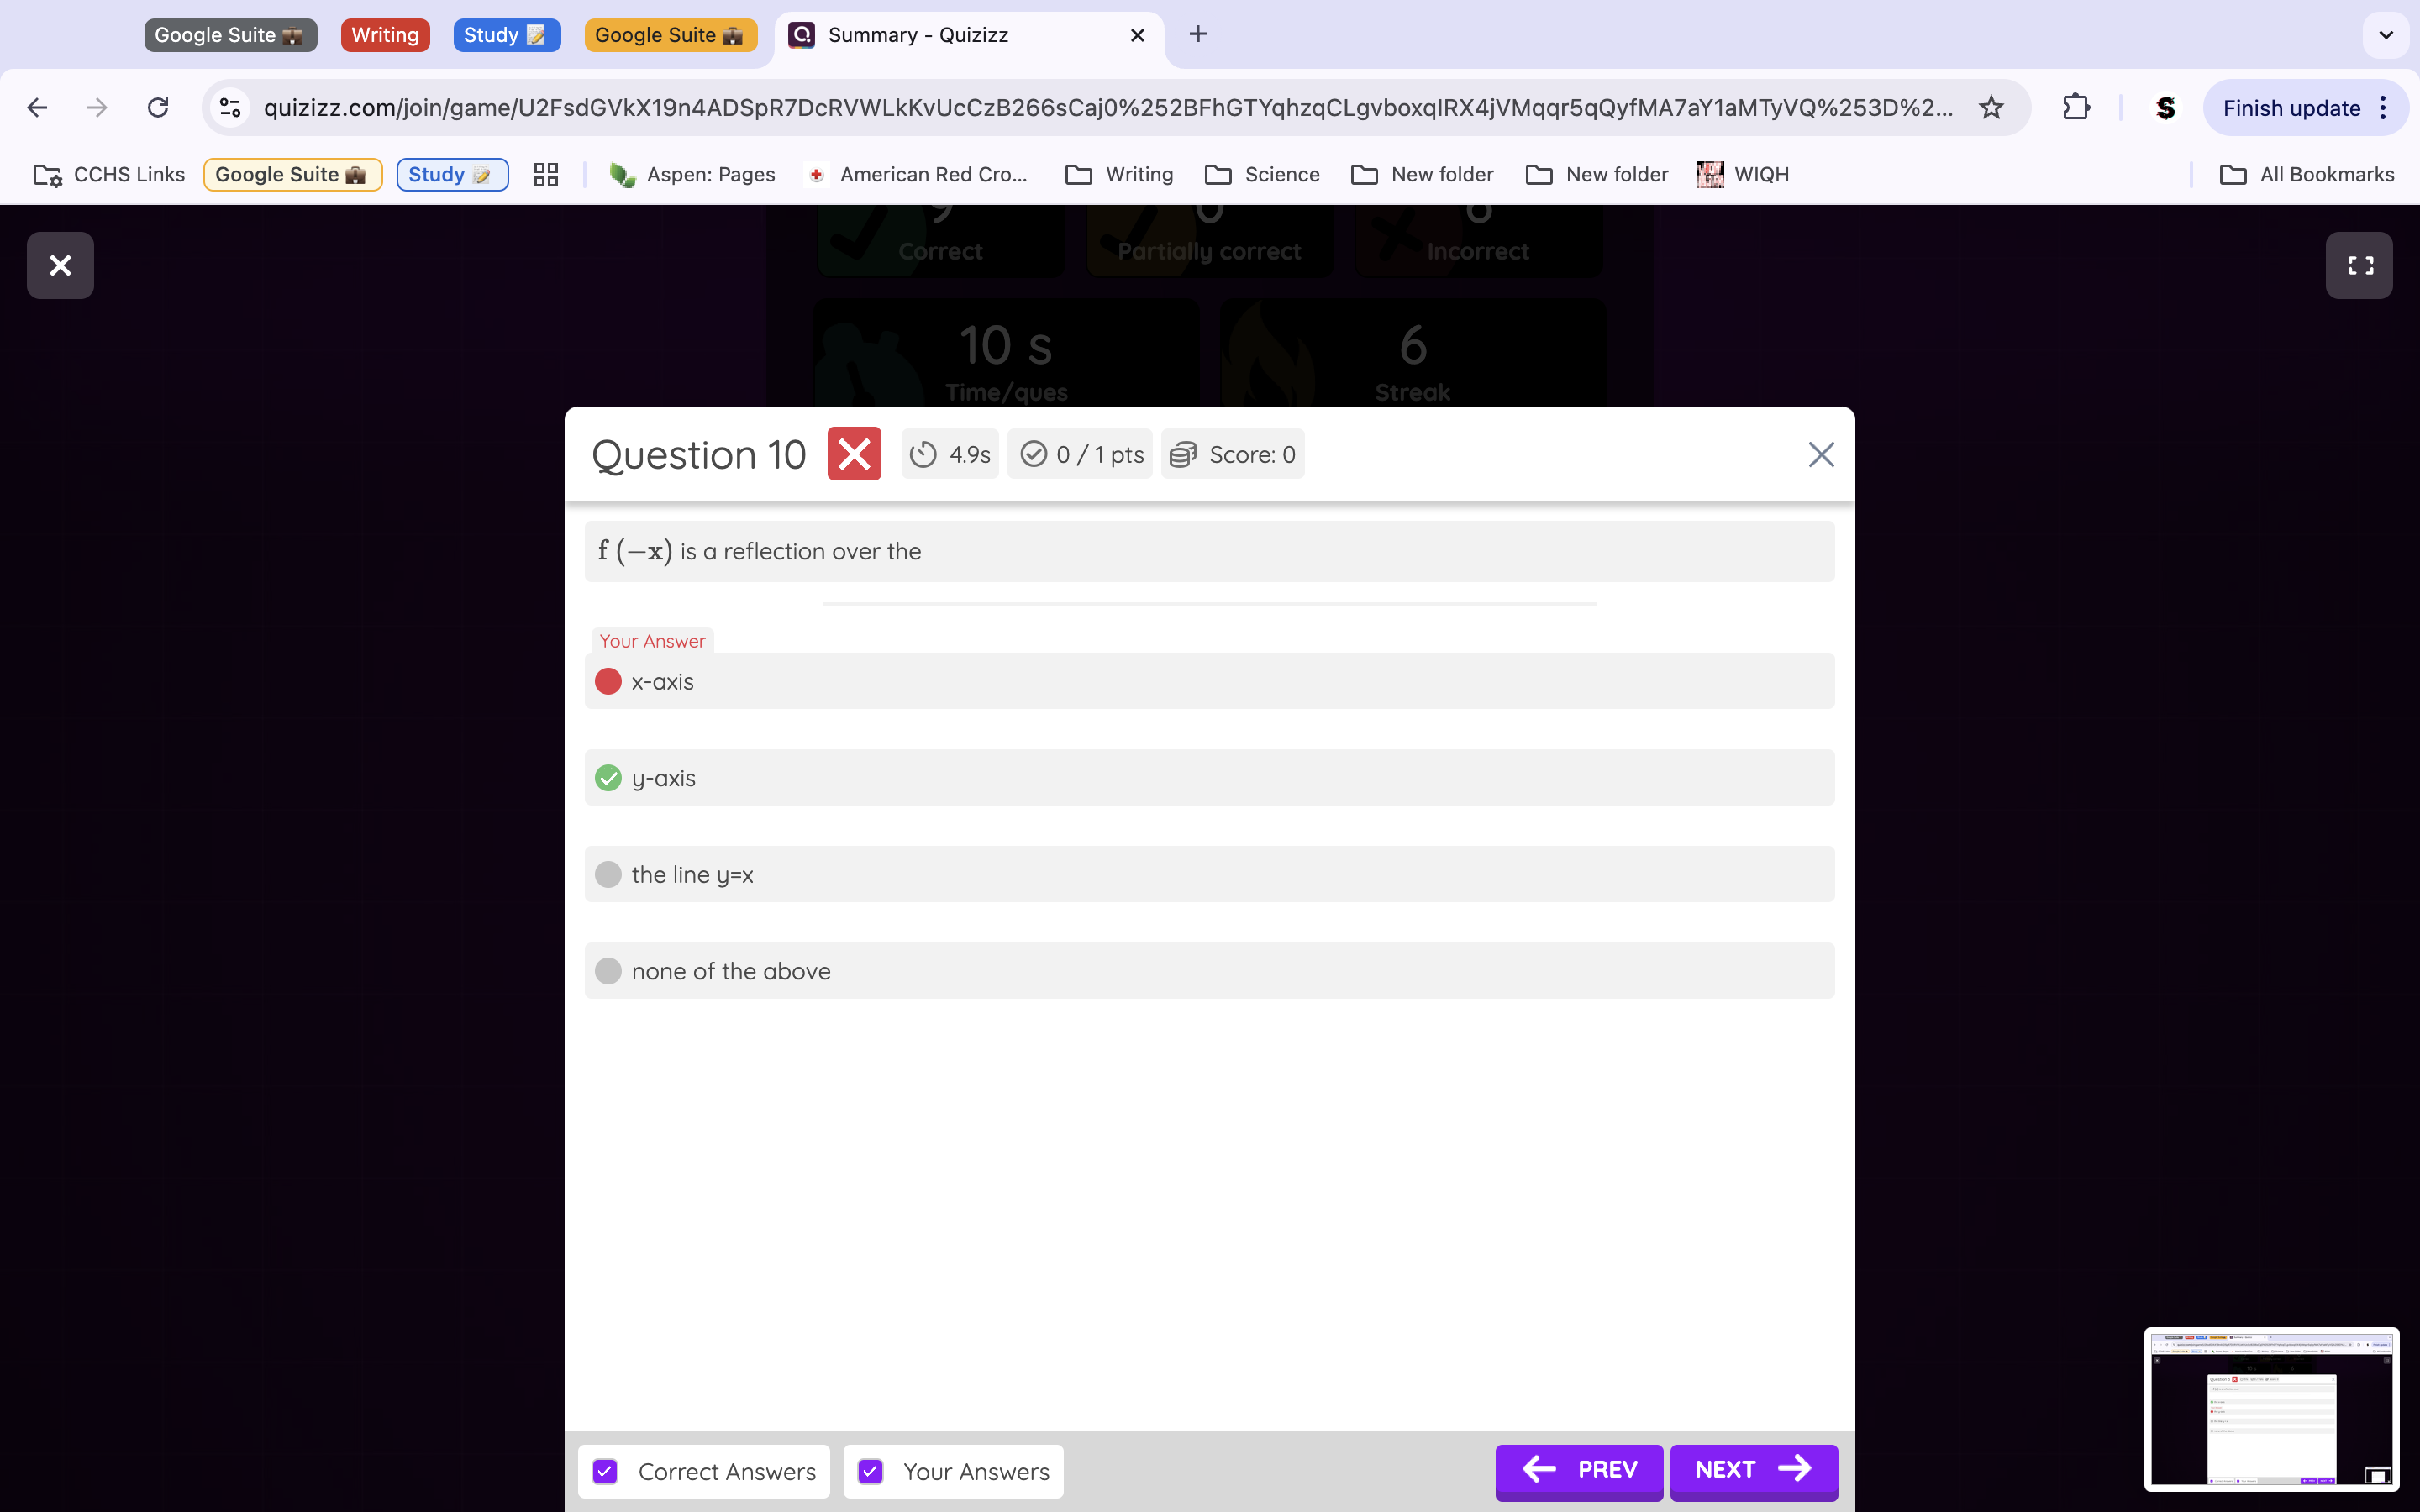
Question 10: A reflection over the y axis is f(x)=(-x) because when using a reflection, we swap where our negative signs usually are for our valued because it’s reflecting, it’s opposite. Thus, B is the correct answer.
Question 12: The transformation is left 3 (C) because it is an x transformation (because it is inside the function), so it must be either left or right. Because it is added 3, we know it’s left because the x transformations are swapped when we plug them into the equation format.
Question 3: The correct answer is A (over the x axis). This is because f-(x) has the negative sign outside the function, correlating it with a x-axis reflection (because the traditional places of x and y transformations are swapped because of the reflection).
-2.2-2.3 Mastery Check-
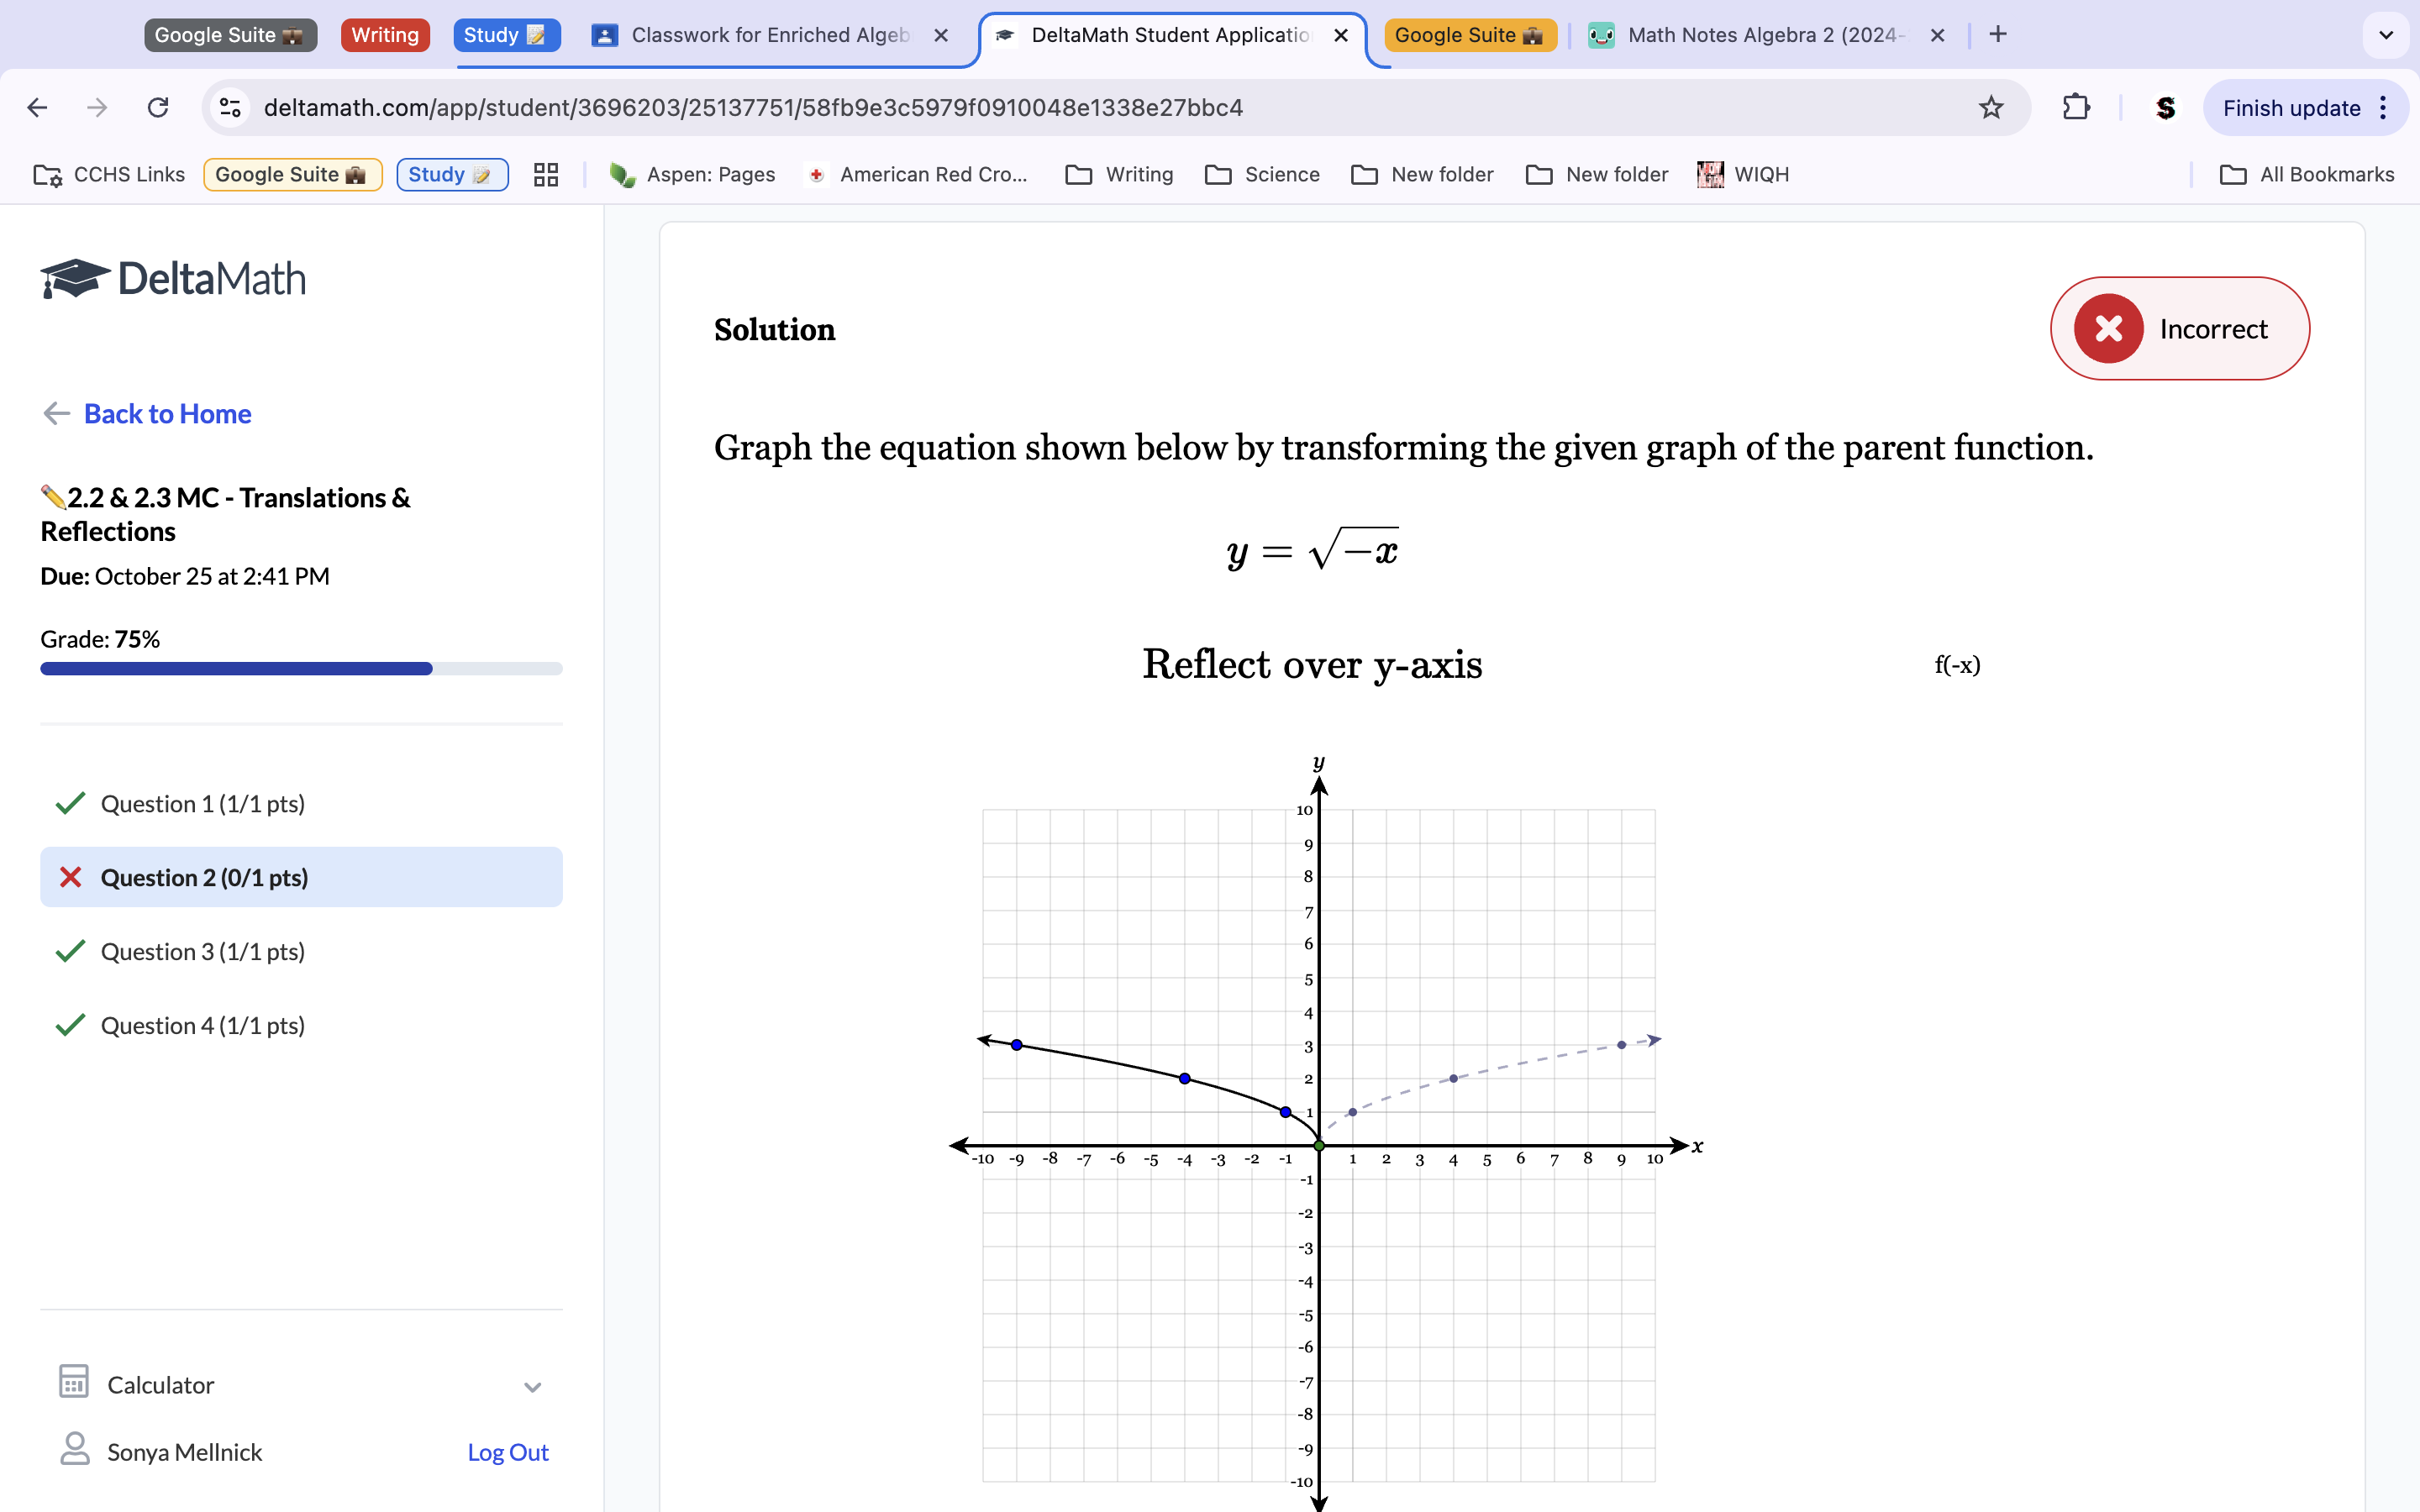
Question 2: The shown dotted line is the correct transformation because the equation √-x has the negative sign within the x function, so the translated function will be reflected over the y-axis.
-2.3 CYU-
After a reflection on the x-axis, the parabola y=x-4 would have the equation:
The correct answer is 3 (y=4-x2 ) because to reflect over the x axis we need to put the negative sign outside the function, turning it into y=-(x2-4), we can then multiply the negative by the inner function to get -x2+4, or 4-x2.
Which of the following equations shows the Graph shown below?
The correct answer is 3 (y=-(x-3)2+4). This is because the Graph pictured shows a reflection over the x-axis, with a shift of 3 right (so we use negative sign since x-transformations are swapped) and an upwards shift of 4.
If (h)x represents a parabola whose turning point is (-3,7) and the function f is defined by f(x)=-h(x+2), what are the coordinates of the turning point f?
There is a reflection on the inner function, because the negative sign is placed with the h. This reflects the y values, making the y-value 7 turn to -7. Because the function has a shift of +2 inside the function, we know we have to subtract 2 from the x-value of the turning point. There are no transformations outside the function, so the y-value remains the same, making the new turning point (-5, -7)
-2.3 Extra Practice-
Identify the solid parent function and write the equation of the dashed line.
The order in which you graph equations is always reflection, X-transformation, and Y-transformation. The parent function is rational (g(x)=1/x). So in this equation, we see the function was first reflected over the x-axis (g(x)=-1/x), then shifted 2 to the left (g(x)=-1/x+2) and finally shifted again down 3 (g(x)=-1/x+2 -3)
Describe the transformation. f(x)=√x/g(x)=-(x+3)3
Because there is a negative sign on the outside of the function, we know the function was reflected over the x-axis. We also see a +3 within the function, so we know the function shifted left by a factor of 3.
Describe the transformation. g(x)=-|x|-1
We see a negative sign on the outside of the function,
so we know that the function will have a reflection over the x-axis. We also see a -1 outside the function, so we know there will be a shift down 1.
Sketch the Graph. g(x)=√x-3+2
We know the Graph is a square root parent function because the function has a base of √x. Draw a basic square root function. It also has an inner X shift of -3 and an outside y-shift of +2. Thus, we sketched the Graph by taking the parent function we had just drawn and moving it to the right 3 and up 2 to get the correct Graph.
-2.4 CYU-
The quadratic function f(x) has a turning point at (-3, 6). The quadratic y=2/3 f(x)+3 would have a turning point of:
The function has no numbers or reflections, so the x value stays the same. Because there is a 2/3 dilation outside the function, we must multiply the y value by 2/3 (6—> 4). We also see that the function shifts by a factor of 3, so add 3 to our y-value to get our final answer of (-3, 7).
The Graph of y-h(x) is shown below. Specify the transformations and the order in which they occurred.
We are told the new equation is f(x)=-1/2h(x)+3. We see a negative sign on the outside, as well as a ½ dilation on the outside as well. The order we go is always, dilations, reflections, shifts. This means the first 2 transformations will be a x-axis reflection, and a dilation of the y values by 1/2. We also see a shift up 3, so the third transformation will be a shift up by a factor of 3.
A parabola is shown graphed to the right as a transformation of y=x2. Based on your answer, write an equation for the parabola.
We are told the parent function is a quadratic function. Draw it on the Graph. We see now that the new function is drawn 7 spaces down, and the x values are multiplied by 2. Thus there is a dilation of the x values by 2, and a shift of 7 spaces down. Thus this makes the equation f(x)=2×2 -7.
The function h(x) is defined by the equation h(x)=4f(x)-12. Write h(x) in its factored form.
In this question, we are told to determine two sets of transformations. The first, we know is a dilation of 4 because the 4 is placed multiplying the function. Then, we can put h(x) into it’s factored form to find the second. H(x) means that there is a horizontal shift, so since the y-dilations usually are, we know another transformation could be a shift down 4, since there will be a shift based on the function in the equation.
-2.4 Extra Practice-
1) f(x)=√x—>g(x)=1/2√x
Because the function has a fraction as the multiplying factor, the function is being compressed. Thus the transformation is a compression of 1/2.
4) f(x)=1/x—→g(x)=-3/x-2
The multiplying factor (3) is not a function, so we know the function is being stretched by a factor of 3. We also see a negative sign along the outside of the function, so we know the function is reflected over the X-axis. Lastly, the function shows a -2 within the X, which shows a rightward shift of 2.
7) Sketch the Graph of each function. g(x)=1/3*|x|
Because the function is on the outside, only the y-values are being compressed, the X-values stay the same. Thus, to graph, mutiply all the y-values of the points shown by 1/3 and place those new points to the Graph for your new and correct function.
8) g(x)=2×2
Because the multiplying factor is 2, we know that we dilate the x-values by 2, but only the y-values (as the 2 is on the inside of the function, thus only relating it to the y-values). Thus the correct Graph multiplies the y-values of the parent function (which we can tell by the equation is quadratic) by 2 and keeps the x-values the same.
12) g(x)=2/x+2
We see that the function has a multiplying factor of 2 outside it, so we know that the function has a verticle shift of the y-values by a factor of 2. We also see that within the function there is a +2, so we know the function also shifts left 2.
-2.5 CYU-
Sketch the Graph of the function. g(x)=√3x
When we have the multiplying factor within the function, we do the opposite of what’s listed to the x-values, thus, because the shown factor is 3, we divide the x values by 3 instead of multiply them, and keep the y-values the same. The Graph sketched will have the parent function’s (which we know from the equation is square root) x-values divided by 3 and put into a new line.
g(x)=√1/3(x-3)
We see that there is a multiplying factor of 1/3 outside the function, so we multiply the y-values on the Graph by one third and draw in those points (while keeping the x-values the same) on the Graph. We also see a -3 within the function, so after drawing in that new line, we shift it 3 to the right to get our correct Graph.
g(x)=-(1/2x)3
We see a compression within the function as 1/2, but because it is within the function, we do the opposite to the x-values, so instead we multiply the x-value points of the parent function (cubic) by 2. We also see a negative sign on the outside of the function, so we know that the function is also reflected over the x-axis. Plug the transformations into your Graph for your new and correct function.
Transform the given function f(x) as described and write the resulting function as an equation. Expand horizontally by a factor of 2.
The given function is f(x)=x2. We are told to expand it horizontally by 2. This means we need to put a factor of 2 within the function because horizontally expanding and verticle compressions make the function wider and are inside, while verticle stretches and horizontal compressions make the function narrower and are thus put on the outside. But, because we are using the x-values (since it is horizontal), we must do the opposite of the intended transformation. Thus, the correct answer would be f(x)= (1/2x)2.
f(x)=|x| compress vertically by a factor of 3 reflect across the x-axis.
We are told to compress the function vertically, so we place the 3 inside the function. The compression is verticle, so no changes to the number will be made. We also know we need to reflect it across the x-axis, so we place a negative symbol outside the function. This results in a final answer of f(x)=-|3x|.
-All Transformations-
Describe the transformation(s) of f(x)=x2 and sketch a graph of the transformed function. c(x)=-(1/2x)2-1
b. (ask how do we know when the function is referring to the x values or y values when the numbers/reflections are on the outside?) b(x)=g(2(x+1))
c. c(x)=-|x-2|+3
b. b(x)=-h(x+3)
c. c(x)=√-1/2(x-3)
-Practice Test-
The quadratic function f(x) has a turning point of (5, -8). If g(x)=f(x+7)-3, then at which of the following does g(x) have a turning point?
Remember to subtract the 7 from the 5, because the 7 is within the function, so it’s function is reversed.
Where does the absolute value function y=1/2|x-8|+3 have a turning point?
The order of operations does the dilation first, then the value translations. Also know that the turning point is always (0,0) when not given, so use those points when using your given transformations on them. 8+0=8, 0+3=3. (8,3).
4) Given that the function y=x2+6x-27 has x-intercepts at x=-9 and x=3, where does the function y=(3x)2+6(3x)-27 have x-intercepts?
We know the function is 3x because it is the only number with an x and inside the parentheses. The other numbers on the equation don’t matter, because we are only told to find the x-intercepts, which is that 3 inside the function. Do the shown function in the equation for the x-intercepts on the intercepts to get the x-intercepts of the new function.
6) If the point (-3, 7) lies on the Graph of f(x), then which of the following points must lie on the Graph of y=5f(x)-20?
Remember that the dilations outside the function only occur on the y-values, while the x-values remain the same. Do the shown y-value transformations on the listed points to get the new equation’s points.
7) The range of the function f(x) is -4≤y≤10. If g(x)=-f(x)+3, then which of the following is the range for g(x)?
Remember that you do reflections first and then shifts after in this series of the equation.
8)
The coordinates of the center are reflected in the equation. You can tell whether a point lies on the circle by plugging both into the equation and seeing if it comes out to the shown sum.
9)
Inside the function=Horizontal, X-values; Outside the Function=Verticle, Y-Values.
10)
Remember that numbers outside the function relate to the y-values, so they transform the y-value son the Graph and also have no reflections/opposite functions, like how the x dilations do.
11)
Remember that outside numbers relate to the y, and inside numbers relate to the x. Because the inner number is on the bottom part of that function, it is being divided in the function, so it actually multiplies the x-values.
14)
Remember that outside numbers are only for the y-values, and the inside numbers are only for x-values, so only do those distinct, separated transformations for each one. Also know, that if the range/domain only has 1 number, the other number is infinity.
-2.6 Mastery Check-
Graph the circle: 4×2+(y+5)2=4
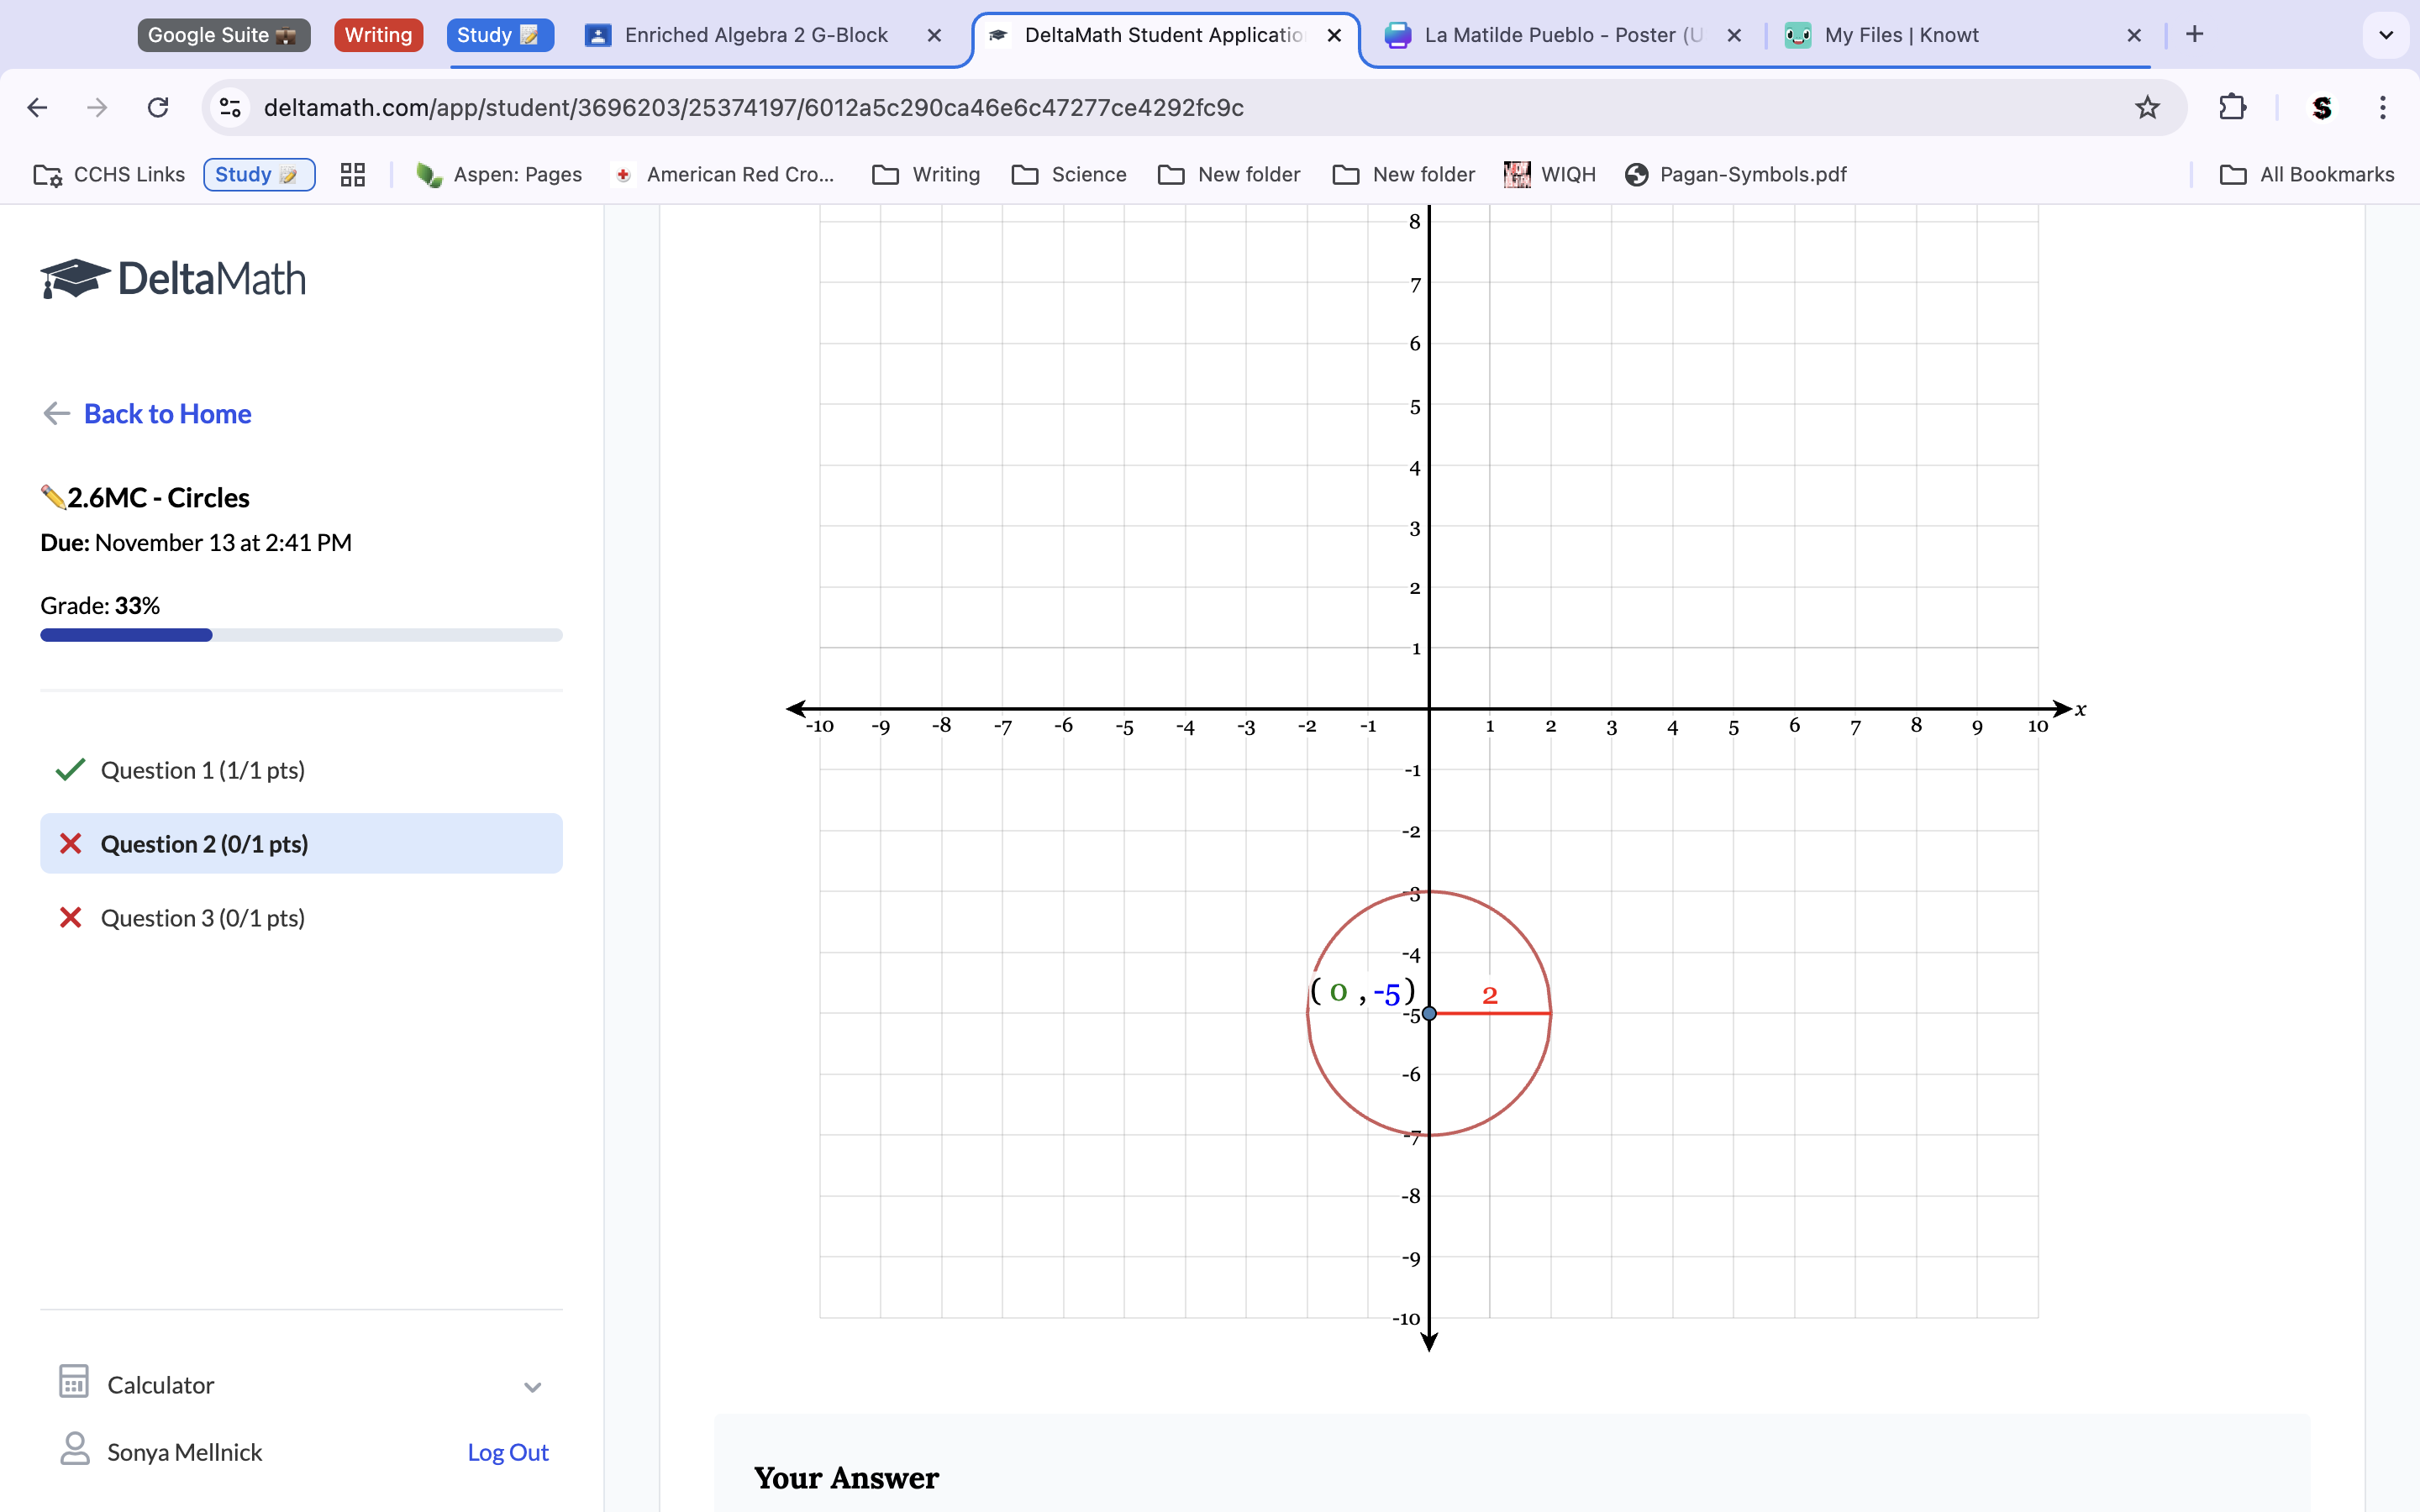
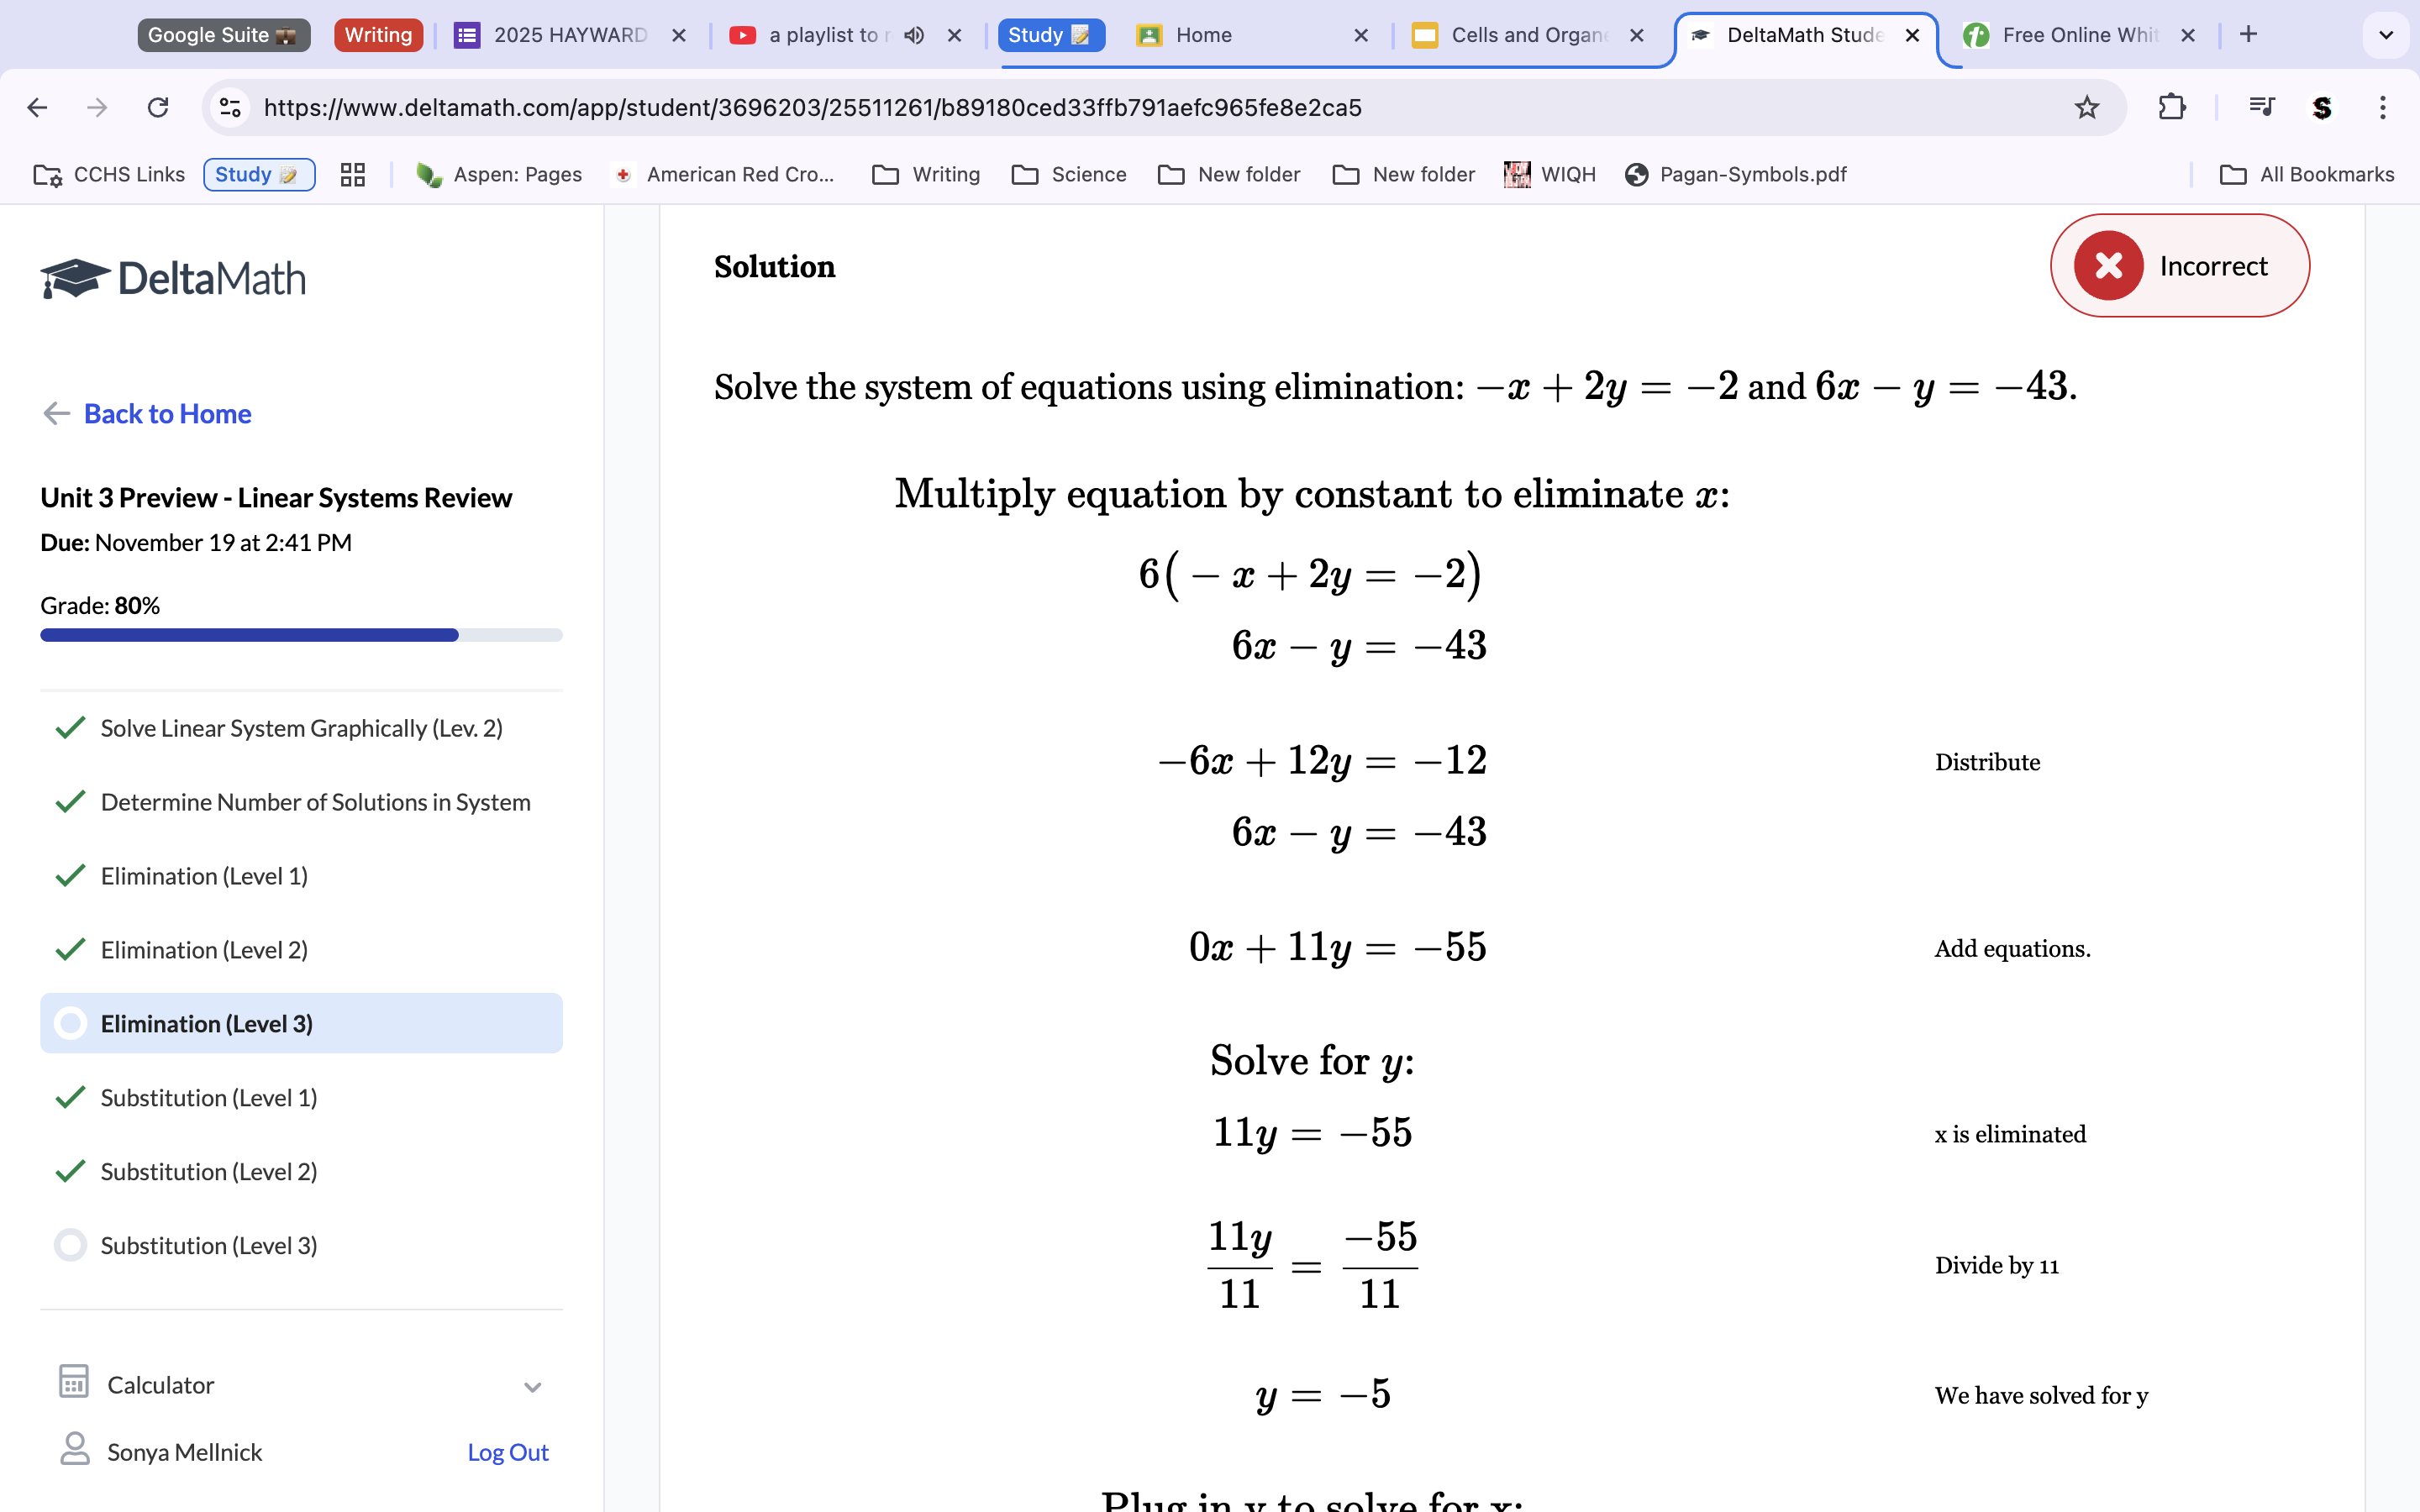
To solve this problem, we will use elimination. Multiply the top equation by 6, to turn the x variable into the opposite number of the x variable on the bottom equation. Because they are opposites, we can add them to eachother to get 0, and thus eliminate the x variable. Add the rest of the equations variables together, including the products, to get a new equation of 11y=-55. Distribute to solve for y. y=-5. Now that we know what y equals, we can plug that value back into the equation to solve for x. -x+2(-5)=-2. Distribute for x. X=-8. Check your variables in both solutions to make sure each comes away with a true statement.
~~UNIT 3.1-3.3~~
-3.1 CYU-
Solve the equation for m. 8+6(m-7)=4(m-7)+20.
Distribute the equations by multiplying the parentheses by the number next to it (which means it multiplies each of the variables seperatly). This gets an equation of 8+6m-42=4m-28+20. Add the numbers without variables together to get 6m-34=4m-8 Distribute and solve for m=13.
Solve 14|x-2|+1=29 for x.
To solve for a variable, we use reverse PEMDAS. Because x-2 is within the absolute value lines, we subtract 1 first from 29 and then divide it(28) by 14 because we are reversing the order and operations of PEMDAS to get the answer. This comes out with a new equation of |x-2|=2. Distribute to get a solution of 4. Because the equation is an absolute value equation, it will have 2 solutions, so make the 2 from the last equation (|x-2|=2) into -2 to get the second solution. Distribute to get a second solution of 0.
Solve the equation for x. 19=2√x-4 +1.
Subtract 1 from 19 to get 18=2√x-4. Divide by 2 to get 9=√x-4. Square the 9 to get 81=x-4. Add the 4 to get 85=x.
Gretchen and Eliza are both attempting to solve the equation |x+2|=-4 Who is correct? Explain.
No absolute value equation can come out with a negative output because there can be no negative amount from 0. Thus there are no solutions, and Eliza is correct.
Consider the equations y=|x-3| and y=2. Use your graph to solve: 2=|x-3|.
The equation has 2 solutions because it has an absolute value function coming from the 3 x-point, and the y goes across the 2 y poiny, so there are 2 intersections and thus 2 solutions. To solve thr equation, find both the x-values on the 2 intersections and put them together for a final solution of (1,5).
10a. 7/4x+3=-2
Because 4x+3 is what is being divided, carry it over to the other side to be multiplied. This gets a new equation of 7=-8x-6. Add 6 to the 7 on the other side to get 13=-8x. Divide 13 by -8 to get x=-13/8.
-DeltaMath Mastery Check 3.1-

Because the equation is an absolute value equation, we know there must be 2 solutions. So, we split the equation into 2 different ones 10=|b/5| and -10=|b/5| Multiply both products by 5 to get b=50 and b=-50 as our solutions.
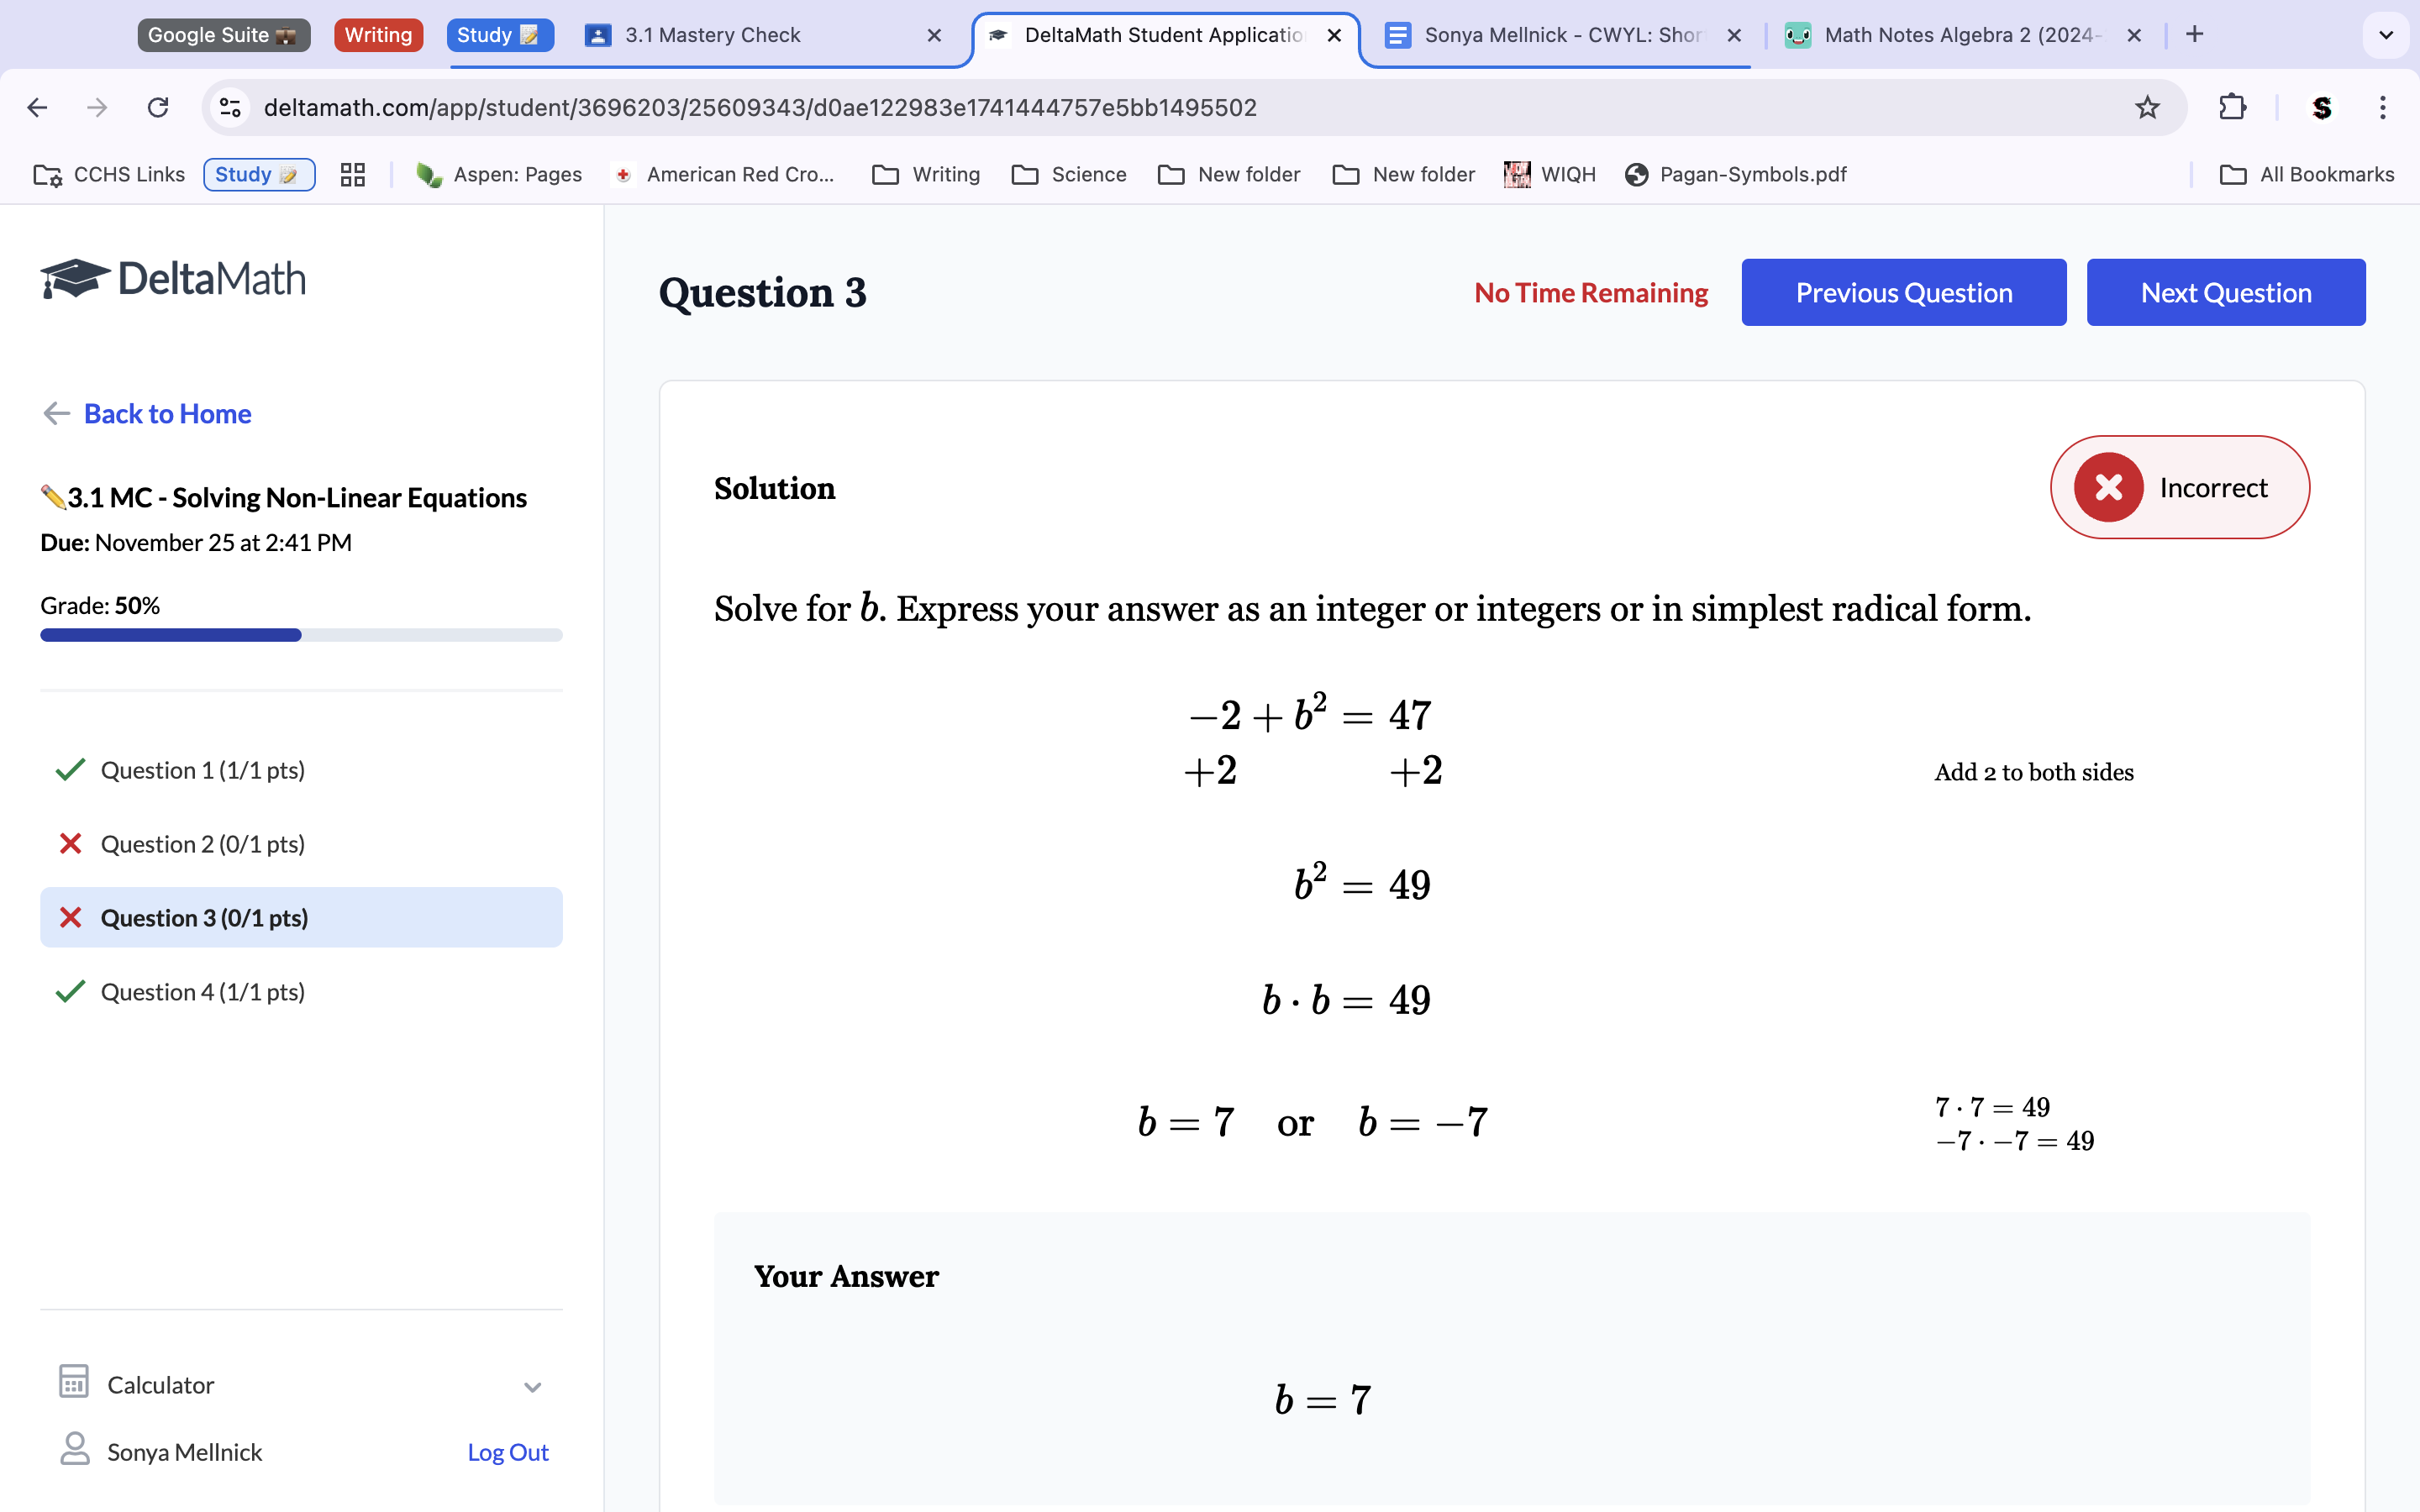
Because the equation is quadratic, we need 2 solutions. Add the 2 onto the product side to get a new equation of b2=49. Split this into two distinct equations, b2=49 and b2=-49. Sqaure each side to get the two solutions of b=7 and b=-7.
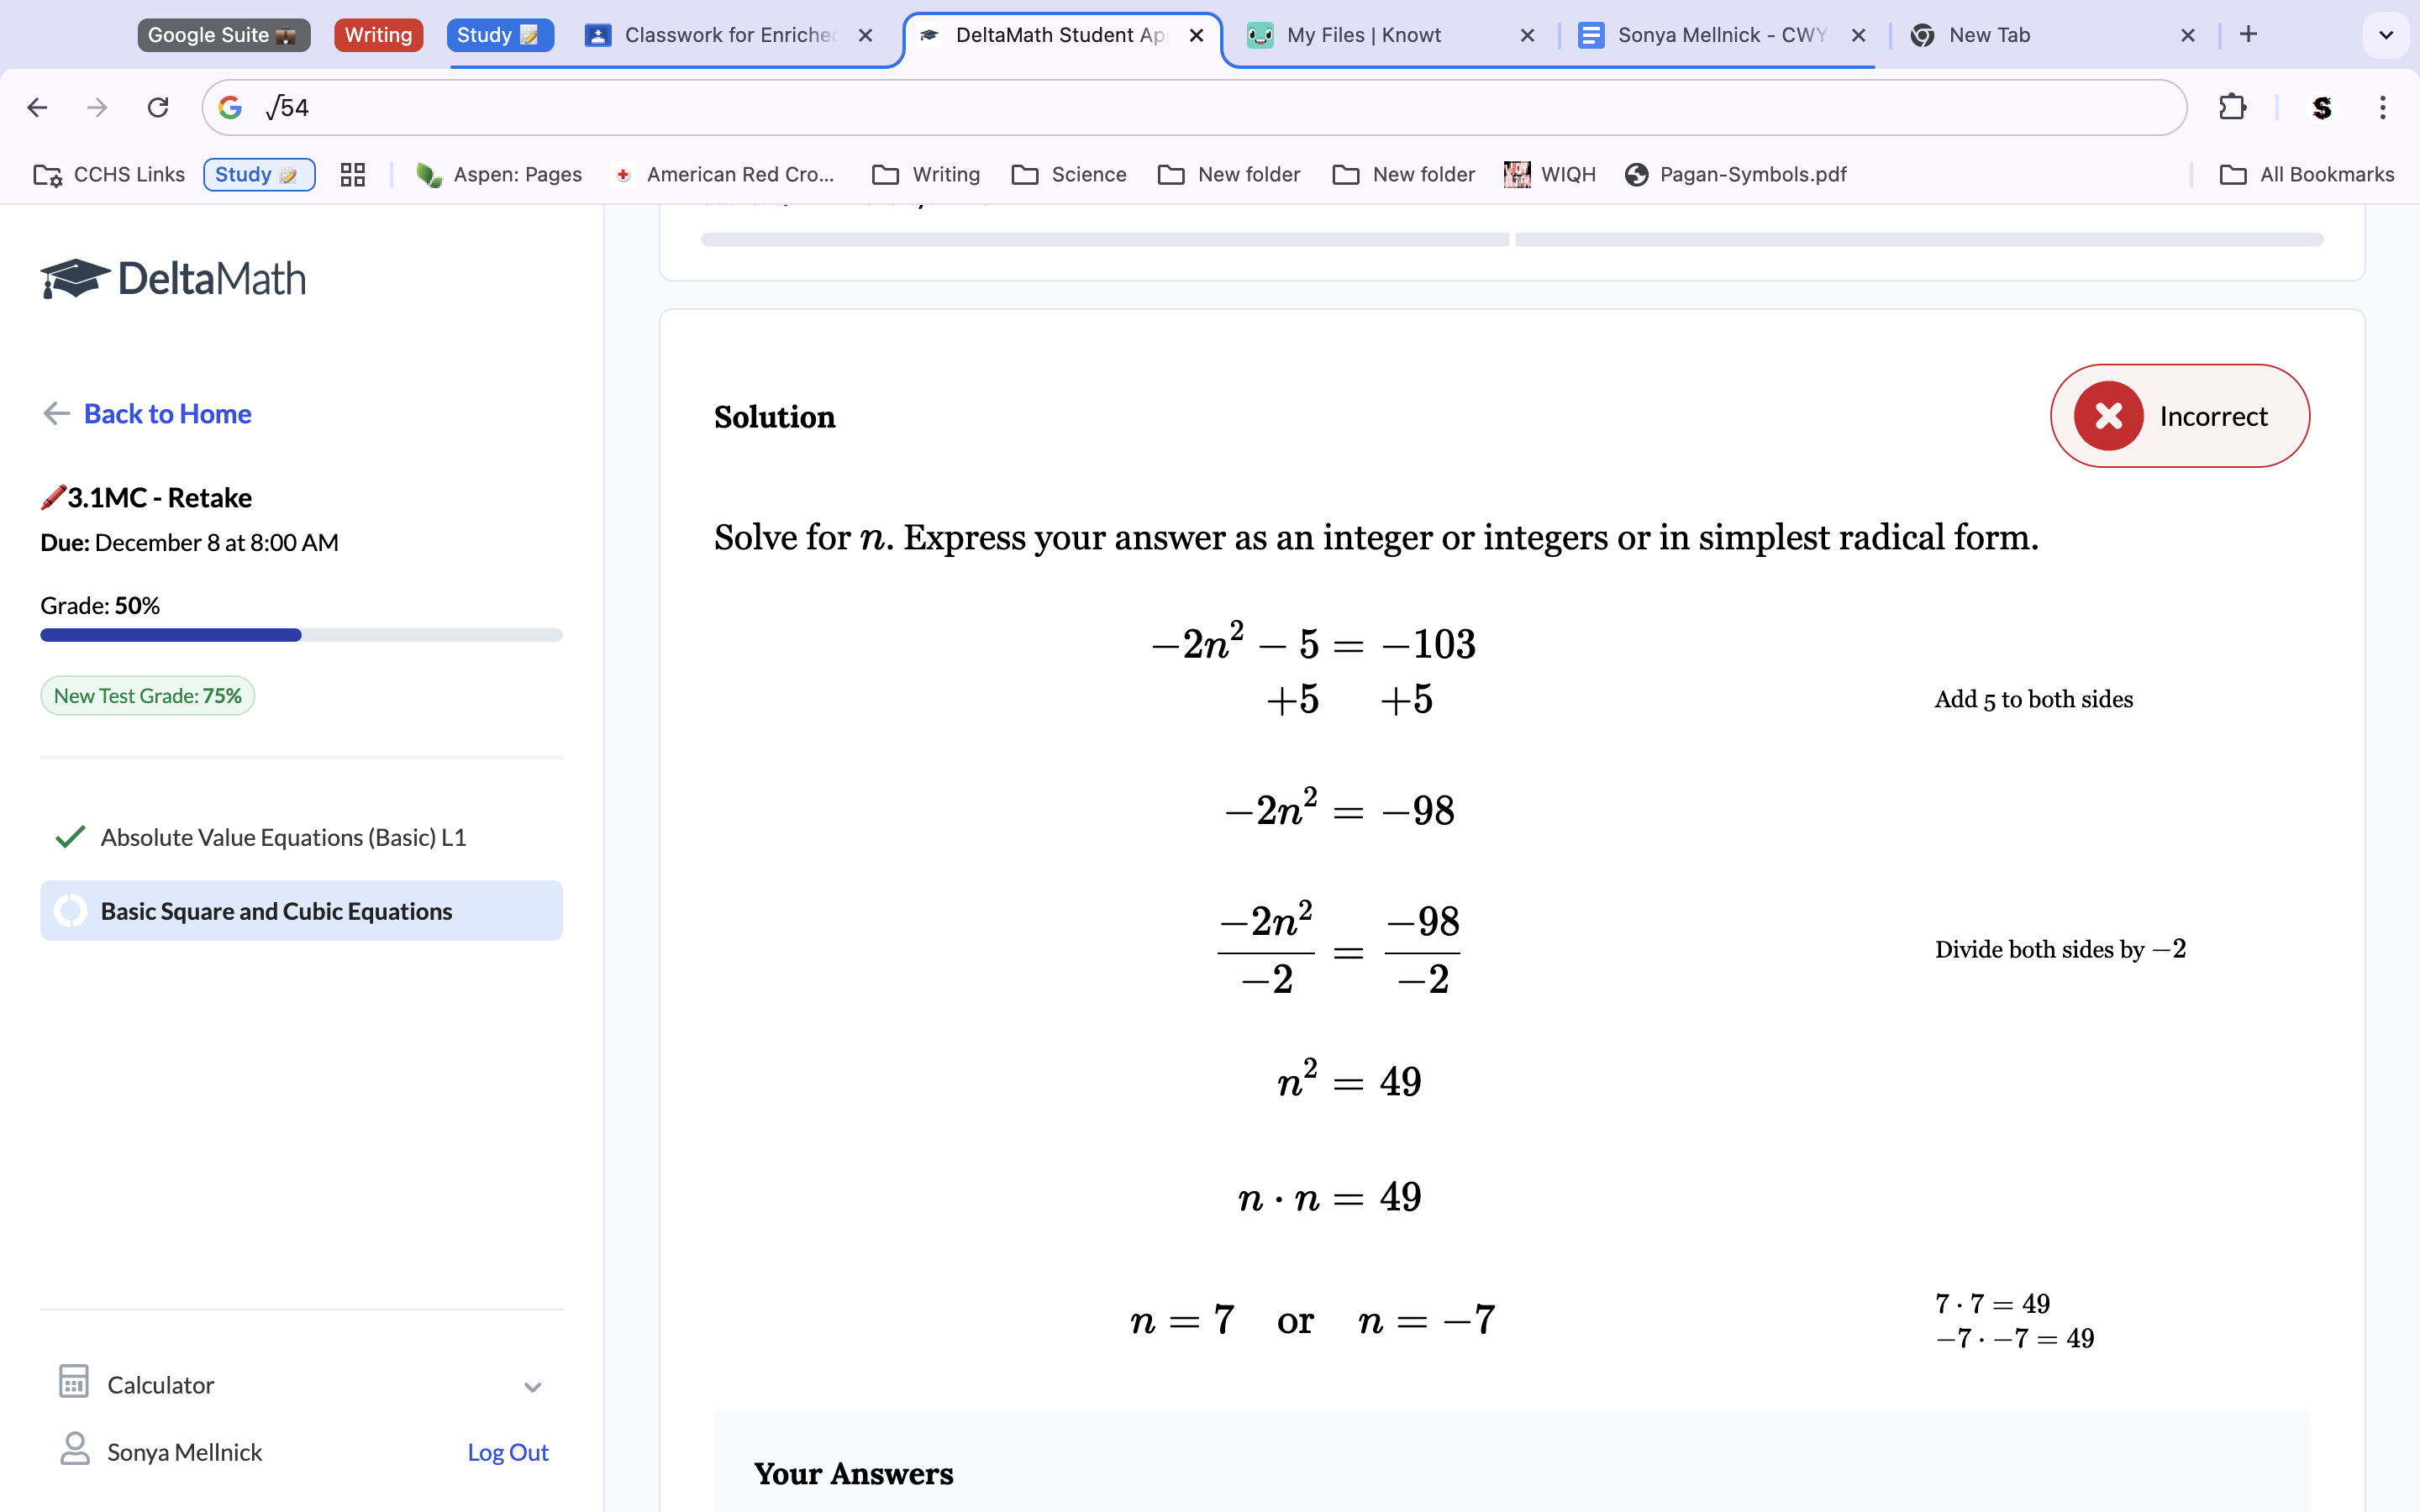
Add 5 to the product side to get a new equation of -2n2=-98. Divide -98 by 2 to get a new equation of n2=49. Because the equation is quadratic, we need to have 2 solutions. Split the equation into 2, n2=49 and n2=-49. Square both to get the solutions n=7 and n=-7.
-DeltaMath Mastery Check 3.2-
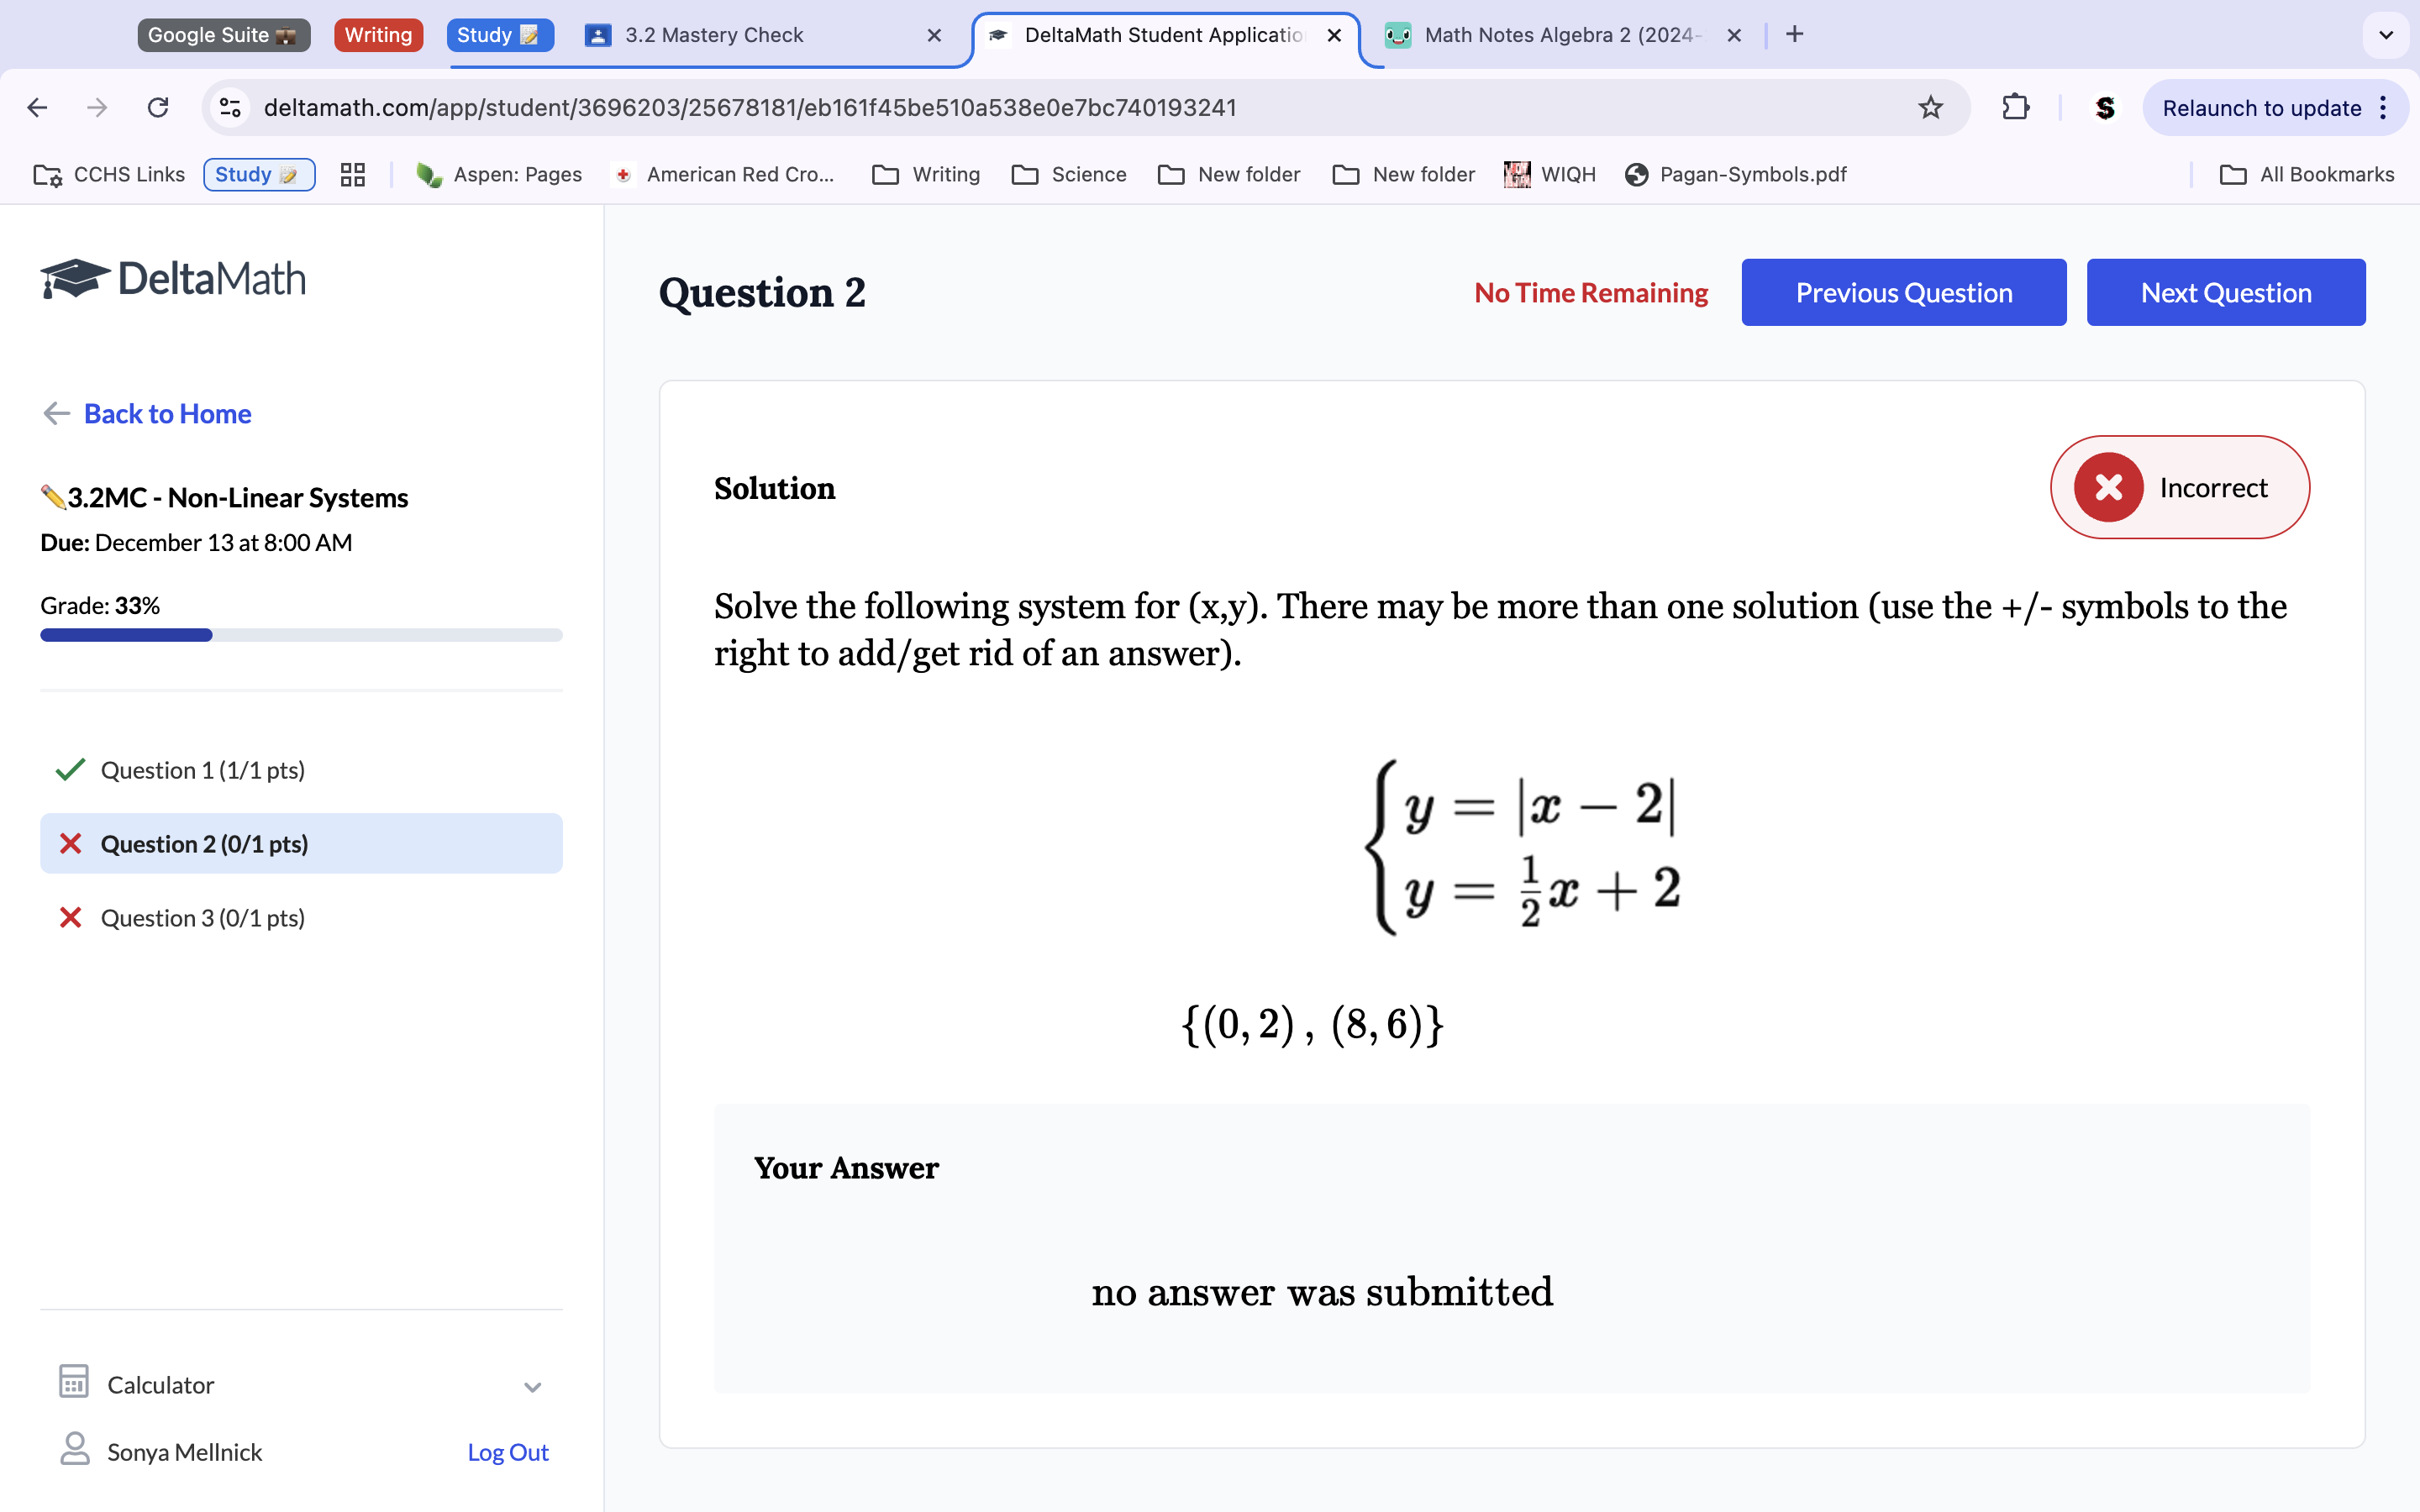
Because both equations equal y, we know that both equations equal each other. Thus, we make it ½ x+2=|x-2|. Then, because this set of equations involves absolute value, it has 2 different tradejectories for 2 different solutions. The first, add 2 to the left side and subtract ½ X from the right to get 4=|-1/2X|. Multiply 4 by 2 to get 8=x. Plug the x into one of the original system equations to get y, 6. This makes the first solution (8, 6). The second solution is found by doing the opposite operations. Subtract 2 from the left side and add ½ X to the right to get 0=|1/2 X|. Multiply by 2 to get x=0. Plug in to one of the original equations to get y=2 for the second solution of (0,2). Put them together to get {(0,2),(8,6)}.
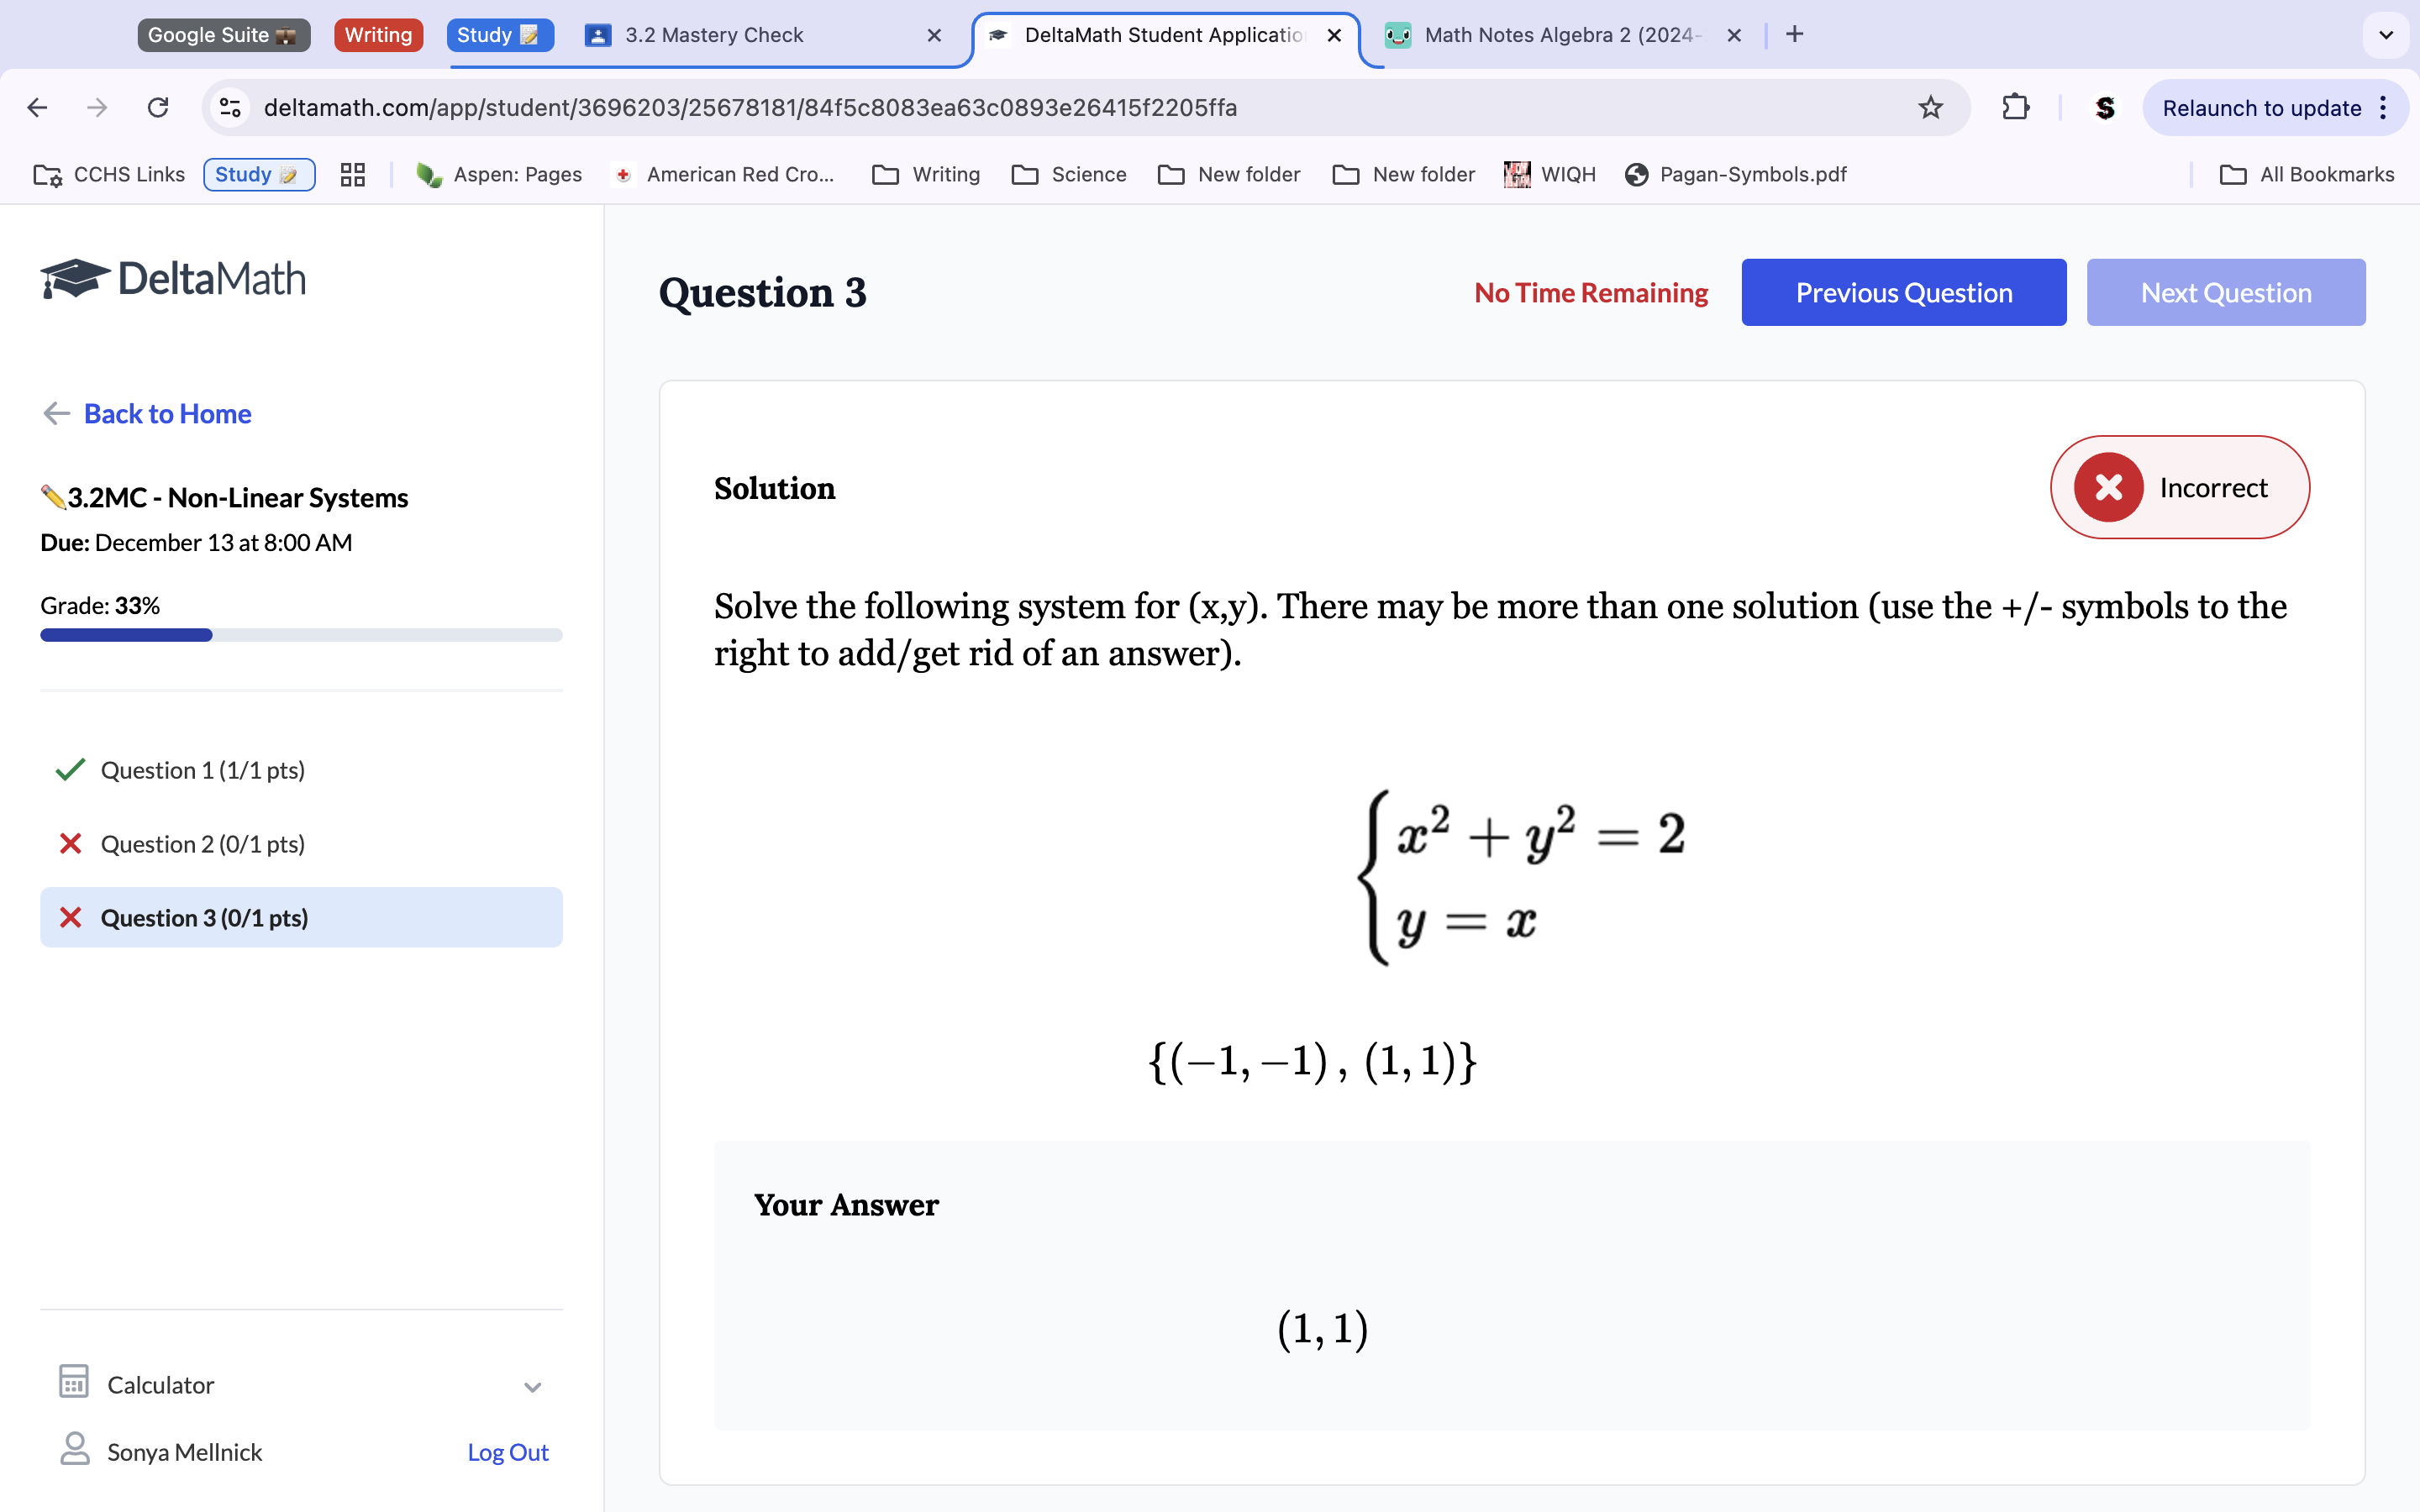
Because y=x, we can plug x into the y spot on the top equation. This gets us x2+x2=2. Because the equation is quadratic, there will be 2 solutions. Make the equation we just created into x2+x2=-2. Square twice on both equations to get x values of 1 and -1. Plug x into the bottom equation to get y, which will also be 1 and -1. Thus are two solutions are {(1,1) and (-1, -1)}.
-3.2 CYU-
y=x-3
(x-3)2+y2=8
Because y=x-3, and there is the equation (x-3) within the top equation, we can substitute it for y, making the equation y2+y2=8. Combine to get 2y2=8. Divide by 2 to get y2=4. The equation is quadratic, so split it to get 2 different solutions. y2=4, as well as y2=-4. Square each equation to get each y-value of -2, 2. Plug each y value in the original equation seperatley to get each x values, which are 5, 1. Check the values by putting them each into both equations to check for a true statement. Put together to get the final solutions as (5,2) and (1,-2).
y=-(x+5)2+14
y=(x+5)2-4
Because The X+5 equation are direct opposites of each other, we can add the equations together to eliminate it. This gets an equation of 2y=10. Divide by 2 to get Y=5. Plug in Y to one of the original equations (in this case we use the bottom). This gets 5=(x+5)2-4. Distribute to get 3=x+5. Because it is a quadratic it will have 2 solutions, so make the first 3=x+5 and the second -3=x+5. Solve each for x, getting -2, and 8. Plug the values in both original equations seperatly to check your answer and check for a true statement. Put the points respectively together to get a final answer of (-2, 5) and (-8, 5).
11a-f. Solve each of the following systems of equations by graphing.
a. Because the equation is y=-5+√-x, we reflect the x over the y-axis because it is on the inside. Then, we move it down 5 because the -5 is on the outside. To find the second line, place a line on the y-axis and take a slope of 2/1 from the -2 axis. Find their intersection.
b. Add 2 to the other side of the x equation (the bottom equation). Move the point up 2 and 1 right to have a point at (-1, 2). Draw a line with a slope of ¼ from the point. For the top equation, move the absolute value function right 3 and draw a line from it at a slope of 1/2. Find the intersection/solution.
c. Bottom equation: Subtract 2 from the equation and then divide it by 4 to get y=2+1/2X. Draw a line from (0,2) with a slope of 1/2.
Top equation: Reflect the quadratic parent function over the x-axis and move left 2. There is no intersection and thus no solution.
d. Top equation: Move the absolute value function down 1 and left 2. Because there is a multiplication of the absolute value equation, multiply the ‘rise’ part of the slope by 2, changing the absolute value slope from 1/1 to 2/1.
Bottom equation: Make a line with a slope of -2/1 from the -5 y-intercept. Because some of the lines over-lap with eachother, but not all, the solution is anything above the point where the lines begin to overlap. Thus the solution is x≤-2 and y≥-1.
e. Top equation: Place a line with a slope of -1/4 from the point (0,3). Find the intersection/solution.
Bottom equation: Parent square root
f. Top equation: Move quadratic parent function down 3.
Bottom equation: Reflect absolute value function over x-axis and move right 3 up 6. Find intersection/solution.
Top equation:
-3.3 CYU-
How many tokens are needed to get a coloring book?
We know from the second equation that, after distributing, s=2. Thus, we can plug 2 in for s, which gets us 2+b+2c=26 and 3b+c=22. We will solve through elimination, so multiply the bottom equation by 2 and then add both equations together to get 2-5b=-18. Subtract 2 from -18 to get -5b=-20. Divide by 5 too get b=4. Plug in for b in the original equation to get 3(4)+C=22. Distribute and solve to get C=10.
8a. How much does 1 cup of coffee cost?
If one cup of coffee is 0.75 more than a donut, that can be translated into c=0.75+d. Because 2 cups of coffee and 12 donuts equal $19, that is translated into 2c+12d=19. Now we have our 2 equations. Because c=the top equation, we can substitute that in for c to get 2(0.75+d)+12d=19. Distribute to get 12d+1.5+2d=19. Add like terms and distribute to get 14d=17.75. Divide by 14. d=1.25. Plug into the original equation to get c and check values. This gets c=2, thus one cup of coffee is $2.
8b. How much does 1 muffin cost?
Because 2 muffins and 6 donuts equal 12.50, the equation can be made into 2m+6d=12.50. We know from the last question d=1.25, so plug to get 6(1.25)+2m=12.50. Distribute and solve for m to get 2m=5. Divide by 2 to get m=2.5, thus a muffin costs $2.50
-3.3 Mastery Check-
x=−8 y=−1 z=4
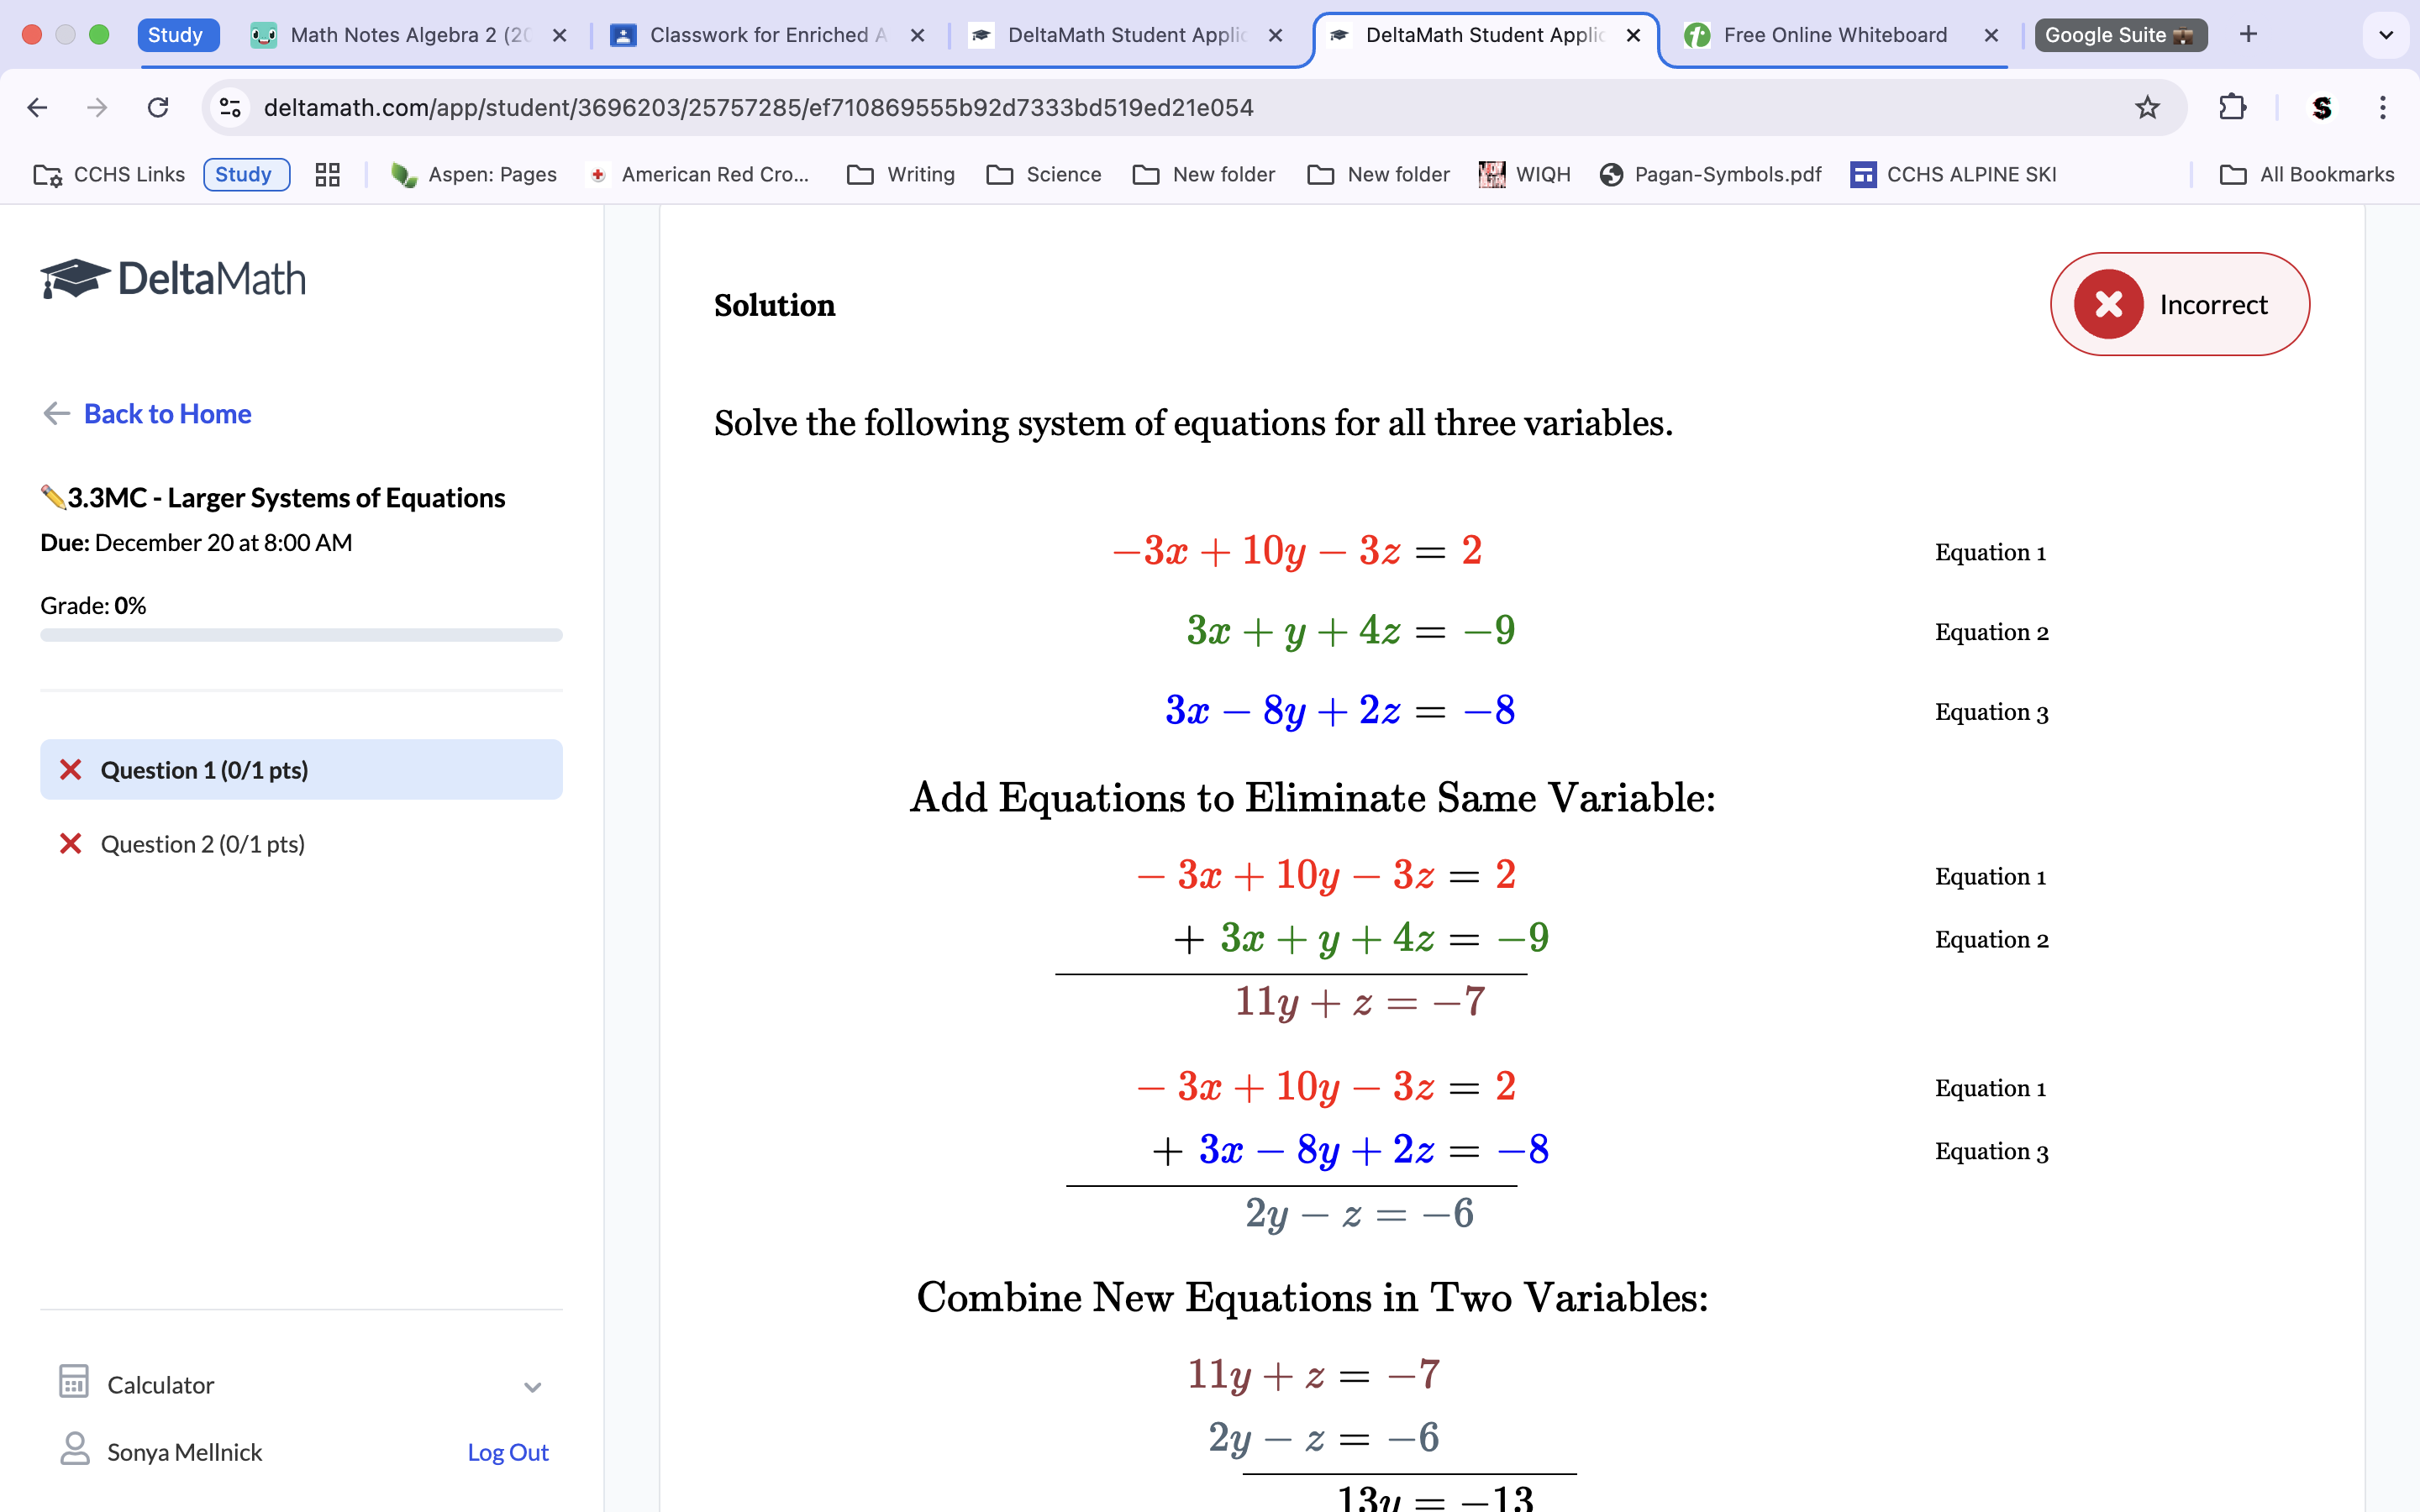
To solve for all 3 variables, we must add the top 2 equations together and subtract the 2 bottom equations together to create 2 equations in our mini-system. Doing this on our problem gets us a mini-system of 11y+z=-7 and 2y-z=-6. Combine both those equations to get a new equation of 13y=-13. Divide by 13 to get y=-1. Plug into the mini-system equation to solve for z. 11(-1)+z=7. -11+z=7. Add 11 to get z=4. Finally, plug both values into the original equation to get x. -3x+10(-1)-3(4)=2. -3x-10-12=2. Add. -3x=24. Divide by -3 to get x=-8. Check by plugging in the values, making sure each equation comes out with a true statement. Final solution of z=4, x=-8, and y=-1.
Practice Exam:
Remember that the x values are swapped when graphing, so the -1 will actually go to the right.
6a. Remember that absolute value equations have 2 solutions.
6b. Remember that quadratics have 2 solutions. Start splitting the equation at the 2nd step/
7abc. To graph, take the equations defined parent function on one side and shift it according to the other operations on the equation. Then draw a line over the shown, y-intercept, which is the number on the other side of the equation.
The bottom line stays linear. Remember that the x-value operations are swapped so the +1 moves left.
Remember that quadratics have 2 solutions
Because the two equations are opposites, we can use elimination to get our answer, by eliminating the entire () equation. Remember that because the y’s equal eachother the two y-values in the two solutions must be the same.
Stopped here
Change x+y=7 over so that the x is on one side. Then we can substitute the sum for the x-value in the bottom equation, and use elimination in the mini-system from there. Remember to multiply by -2
Combine the 1st and 2nd equations as well as the 1st and 3rd equations to get the mini-system. Solve.
-3.4 Mastery Check-
3.1-3.3 Quiz
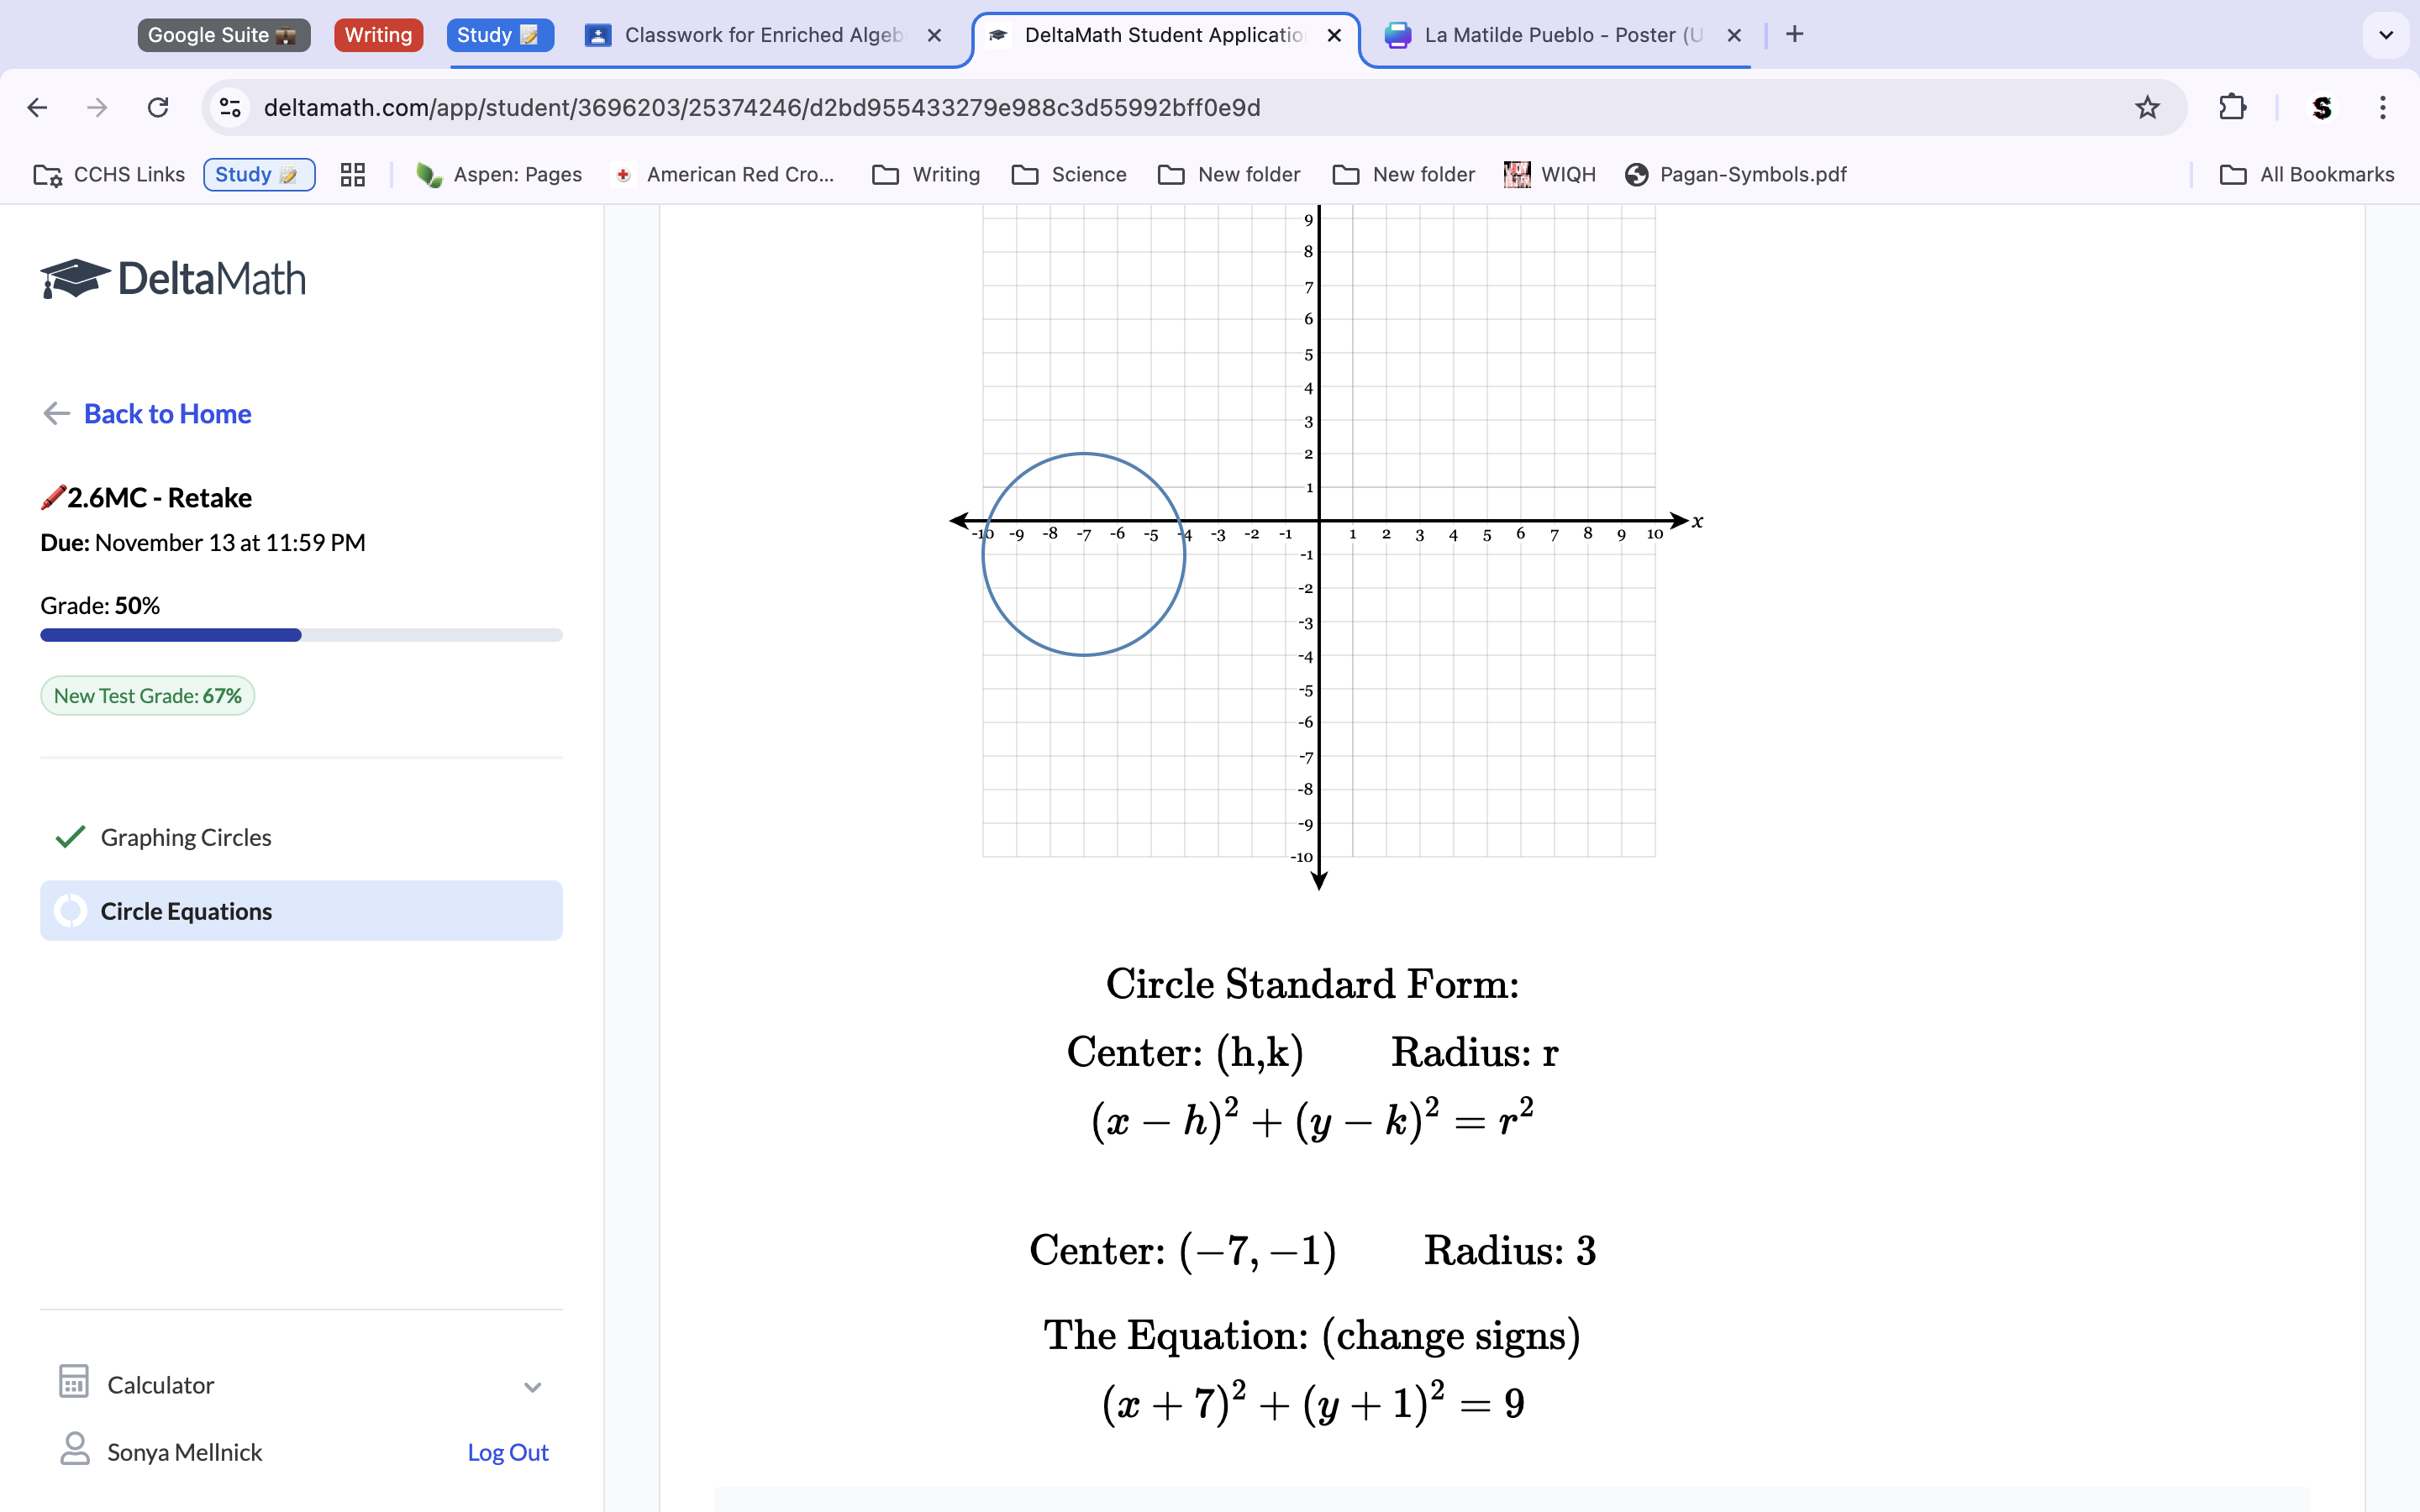
2) Consider the system of equations and answer the questions below: Graph the system, and solve the system of equations for (x,y).
The top equation is the circle formula for the circle center, (x-h)2+(y-k)2=r2. Because we know that the h and k points are the x and y values of the center, we can plug those points in the equation onto the graph (which are -2, -1-keeping in mind that whilst graphing the x values are swapped, so the points would actually be graphed on (2, 1)). Then, because we also have the sum (r2) of 9, we know the radius is 9 squared, thus the radius is 9. Since we know both the center and the radius of the circle, we can now graph it. For graphing the bottom equation, it is linear, so we just make a line with a slope of 1 from the 2 y-intercept. The places where the circle and the line intersect is the solutions, which are (2, 4) and (-1, 1).
5) Algebraically solve the system of equations below for the solutions (x,y).
We are given that y=19, so we already know the y-value, which is 19. Because we know y=19, we can plug that into the y-value on the top equation to get x. This gets an equation of 19=(x-7)2-81. Add 81 to both sides → 100=(x-7)2. Square both sides. 10=x-7. Because the equation is quadratic we need two solutions, which we will get by making one equation have a sum of 10, while the other has a sum of -10. Add 7 to both equations to get the two X-values of -3 and 17. Thus, the solutions are X=17, -3 and Y=19. Y doesn’t have a second solution because it is already given to us what y is.
-Practice Exam-
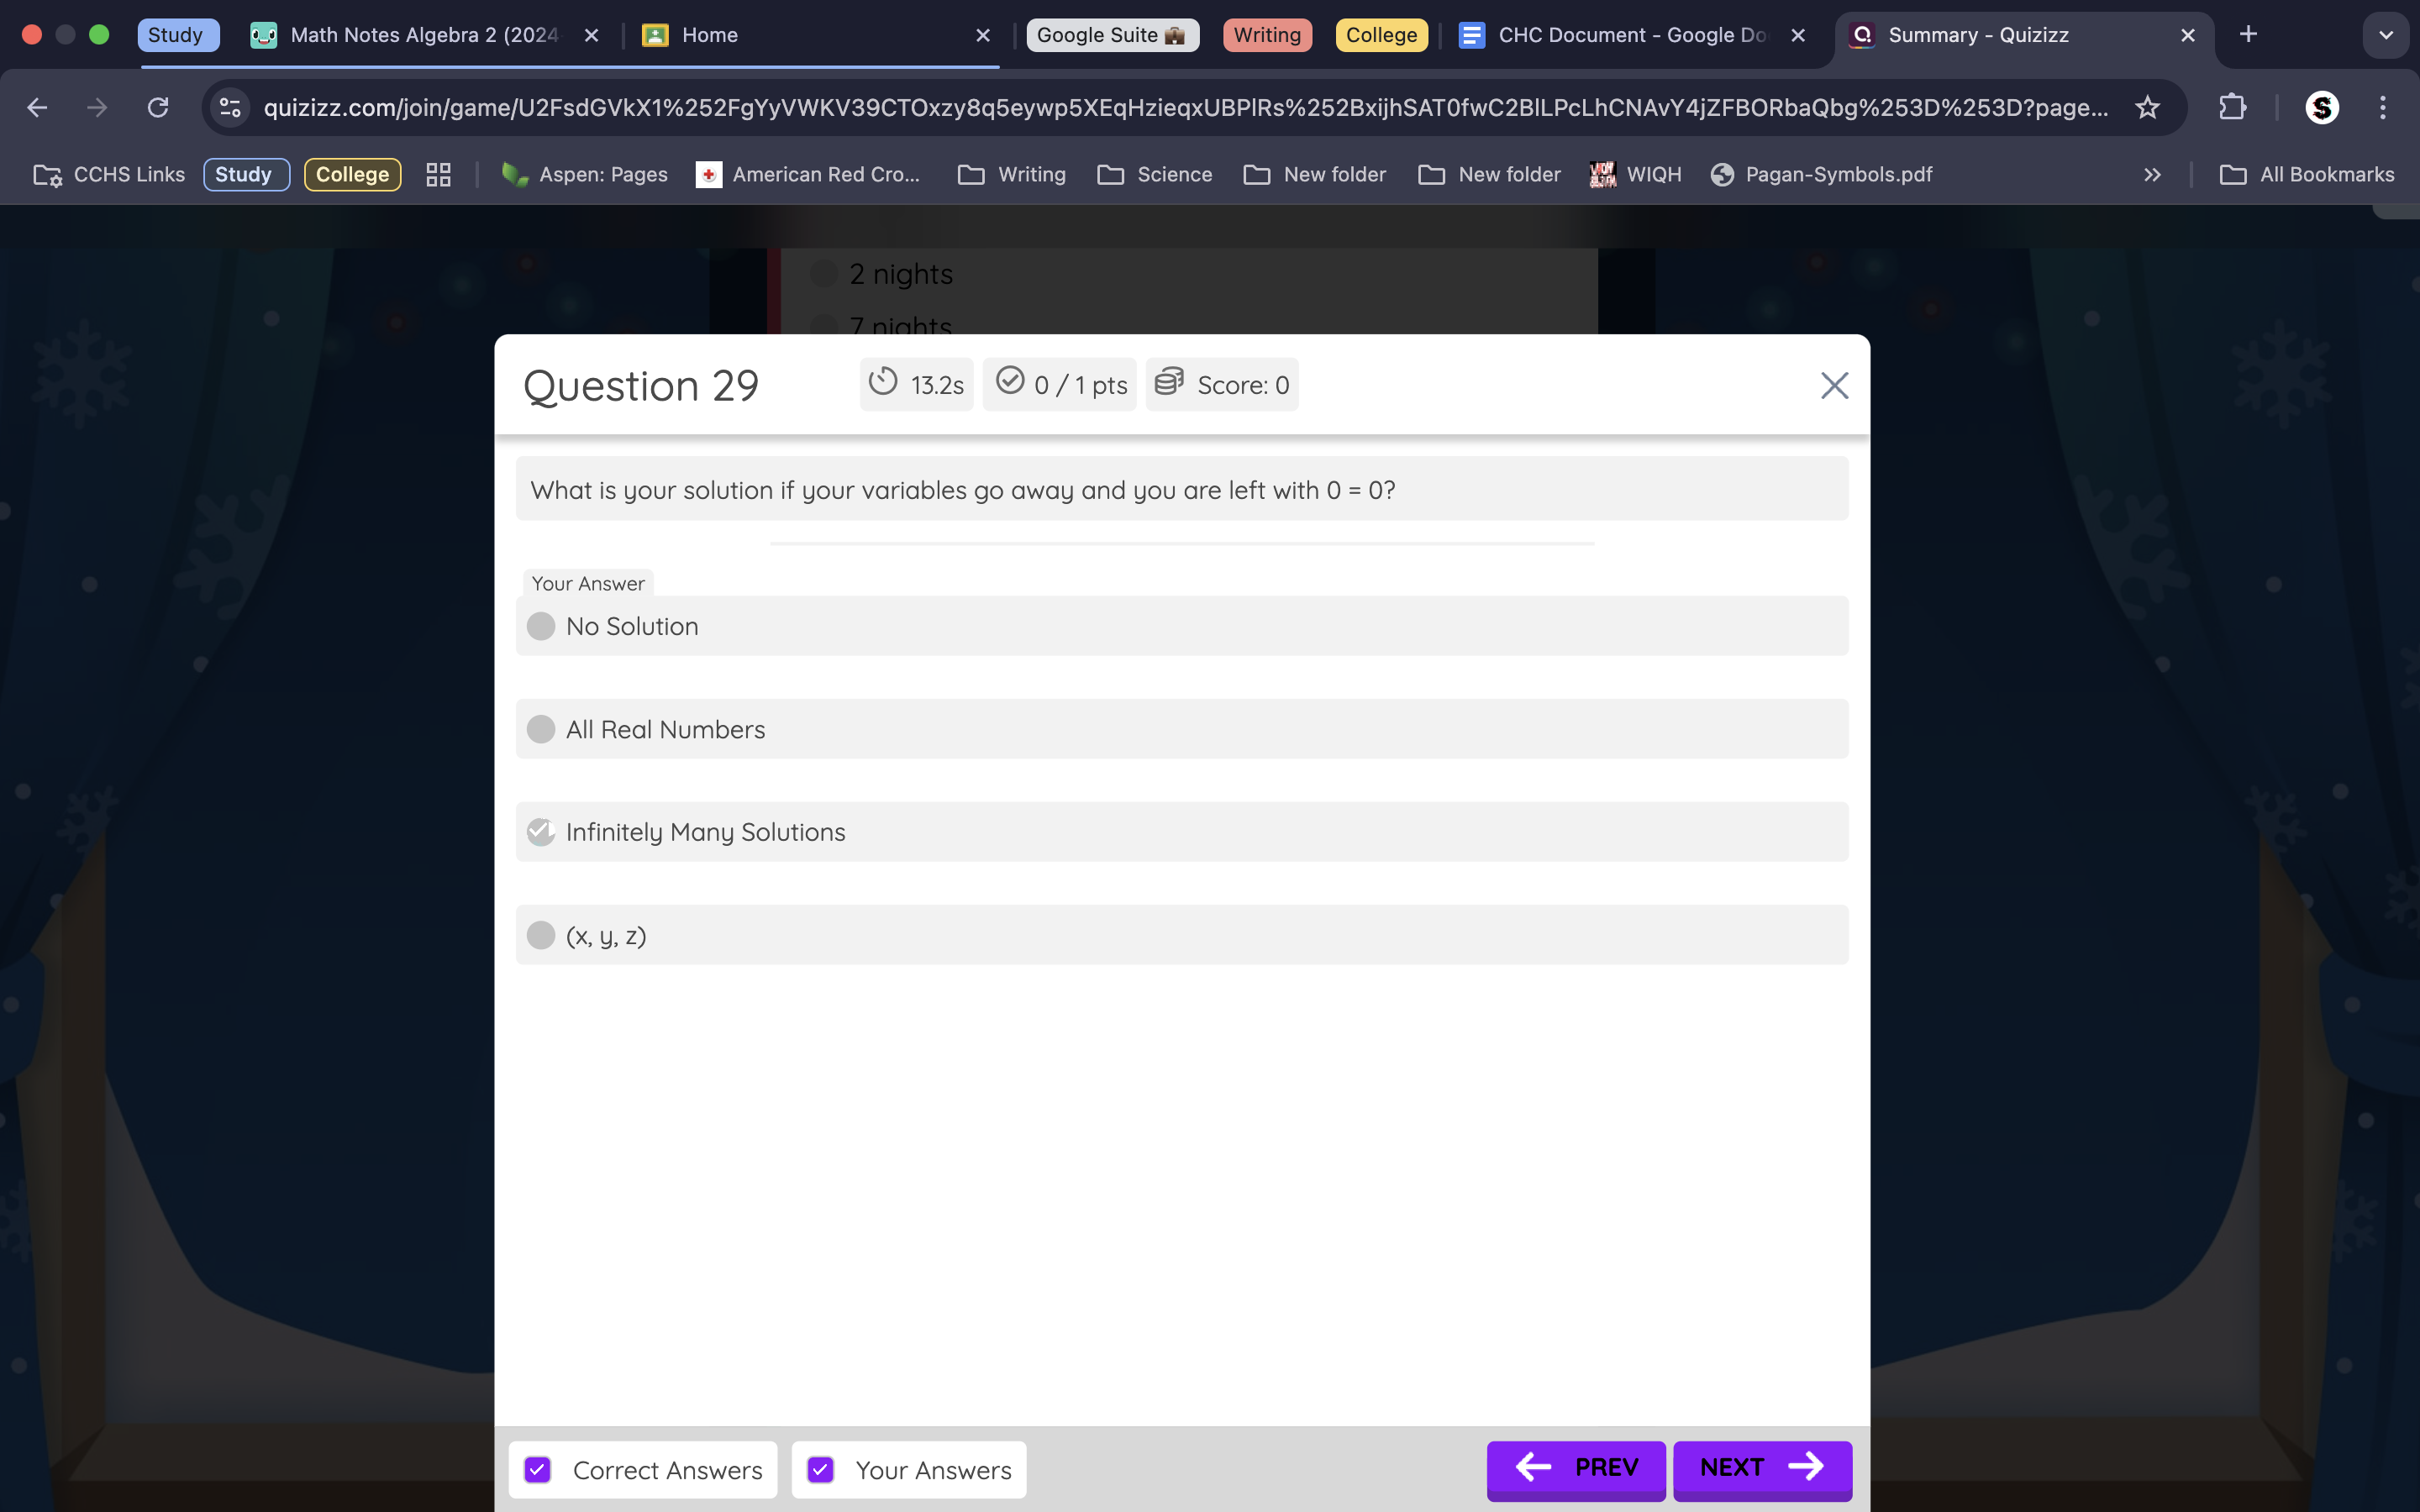
8) Remember that infinite solutions make both equations the same (even if not on originally, infinite solutions just need there to eventually be both equations as the same. The sum side does not have to be the same).
12) When making your mini-system and equation by adding the top two, you need to use elimination on that top equation to make the mini-system have only one variable.
13) The system of equations is correct, and the idea of needing to use substitution is also correct, however we need to plug ‘H+10’ into both upper equations and put those new equations together into the coherent mini-system. 25-20=15, so you can solve for z from that and thus the rest of the system.
15c) Because the problem says that he must have 2 notebooks for each binder, the 2 variable is placed with the y, making the first inequality is actually X>2y. Solve both inequalities into y=mx+b to graph.
16) Remember to shade the inequalities after graphing the line by testing with (0,0).
17) Remember that the bottom equation is y=-2, and thus has a false statement attached to the (0,0) point being tested.
19) Because muffin batches need to be half or more than the amount of cookie batches, this means that muffin batches will always be equal to or more than 1/2C, making the inequality m≥ ½ C, and the system {210c+260m≤2000, m≥ ½ C} Set the bottom equation to standard form and use optimization? to solve.
20) Use Desmos.
22) Remember that quadratic equations have 2 solutions.
23) Because K is the y-value, a value that would give the equation no solution would be a value without an intersection on the graph, and because the functions’s greatest y-value is 2, anything over 2 would have no solution. Because it’s absolute value, the only value that would give the equation one solution would be at the vertex.
28) Remember that absolute value equations have 2 solutions. Ask why the absolute value doesn’t change to the positive equivalent of the negative value
34) The idea is correct to use substitution, use the exponent on the inside of the parentheses to get rid of it, and then distribute by the x to get the correct equation. Make the equation equal to 0 and factor (because of the two squares) to get the solutions. Would be easier to graph, if considered.
35) Correct idea. Use the exponent on the values inside the parentheses first and then combine like terms to solve.
39) Solve this equation graphically. The bottom equation is linear, and the top is the equation for circle center, (x+h)2+(y+k)2=r2, so the top equation will be a circle, and the bottom a line.
40) Remember that quadratic equations have 2 solutions.
42) *Come back to* need to use elimination first on both the top and the bottom equation. Then combine the top and bottom equations with the second seperately to get their respective equations for the mini-system. Use elimination in the mini-system to solve for x, plug in x to get y, and finally plug both x and y into the original equation to get z.
-Quizziz-
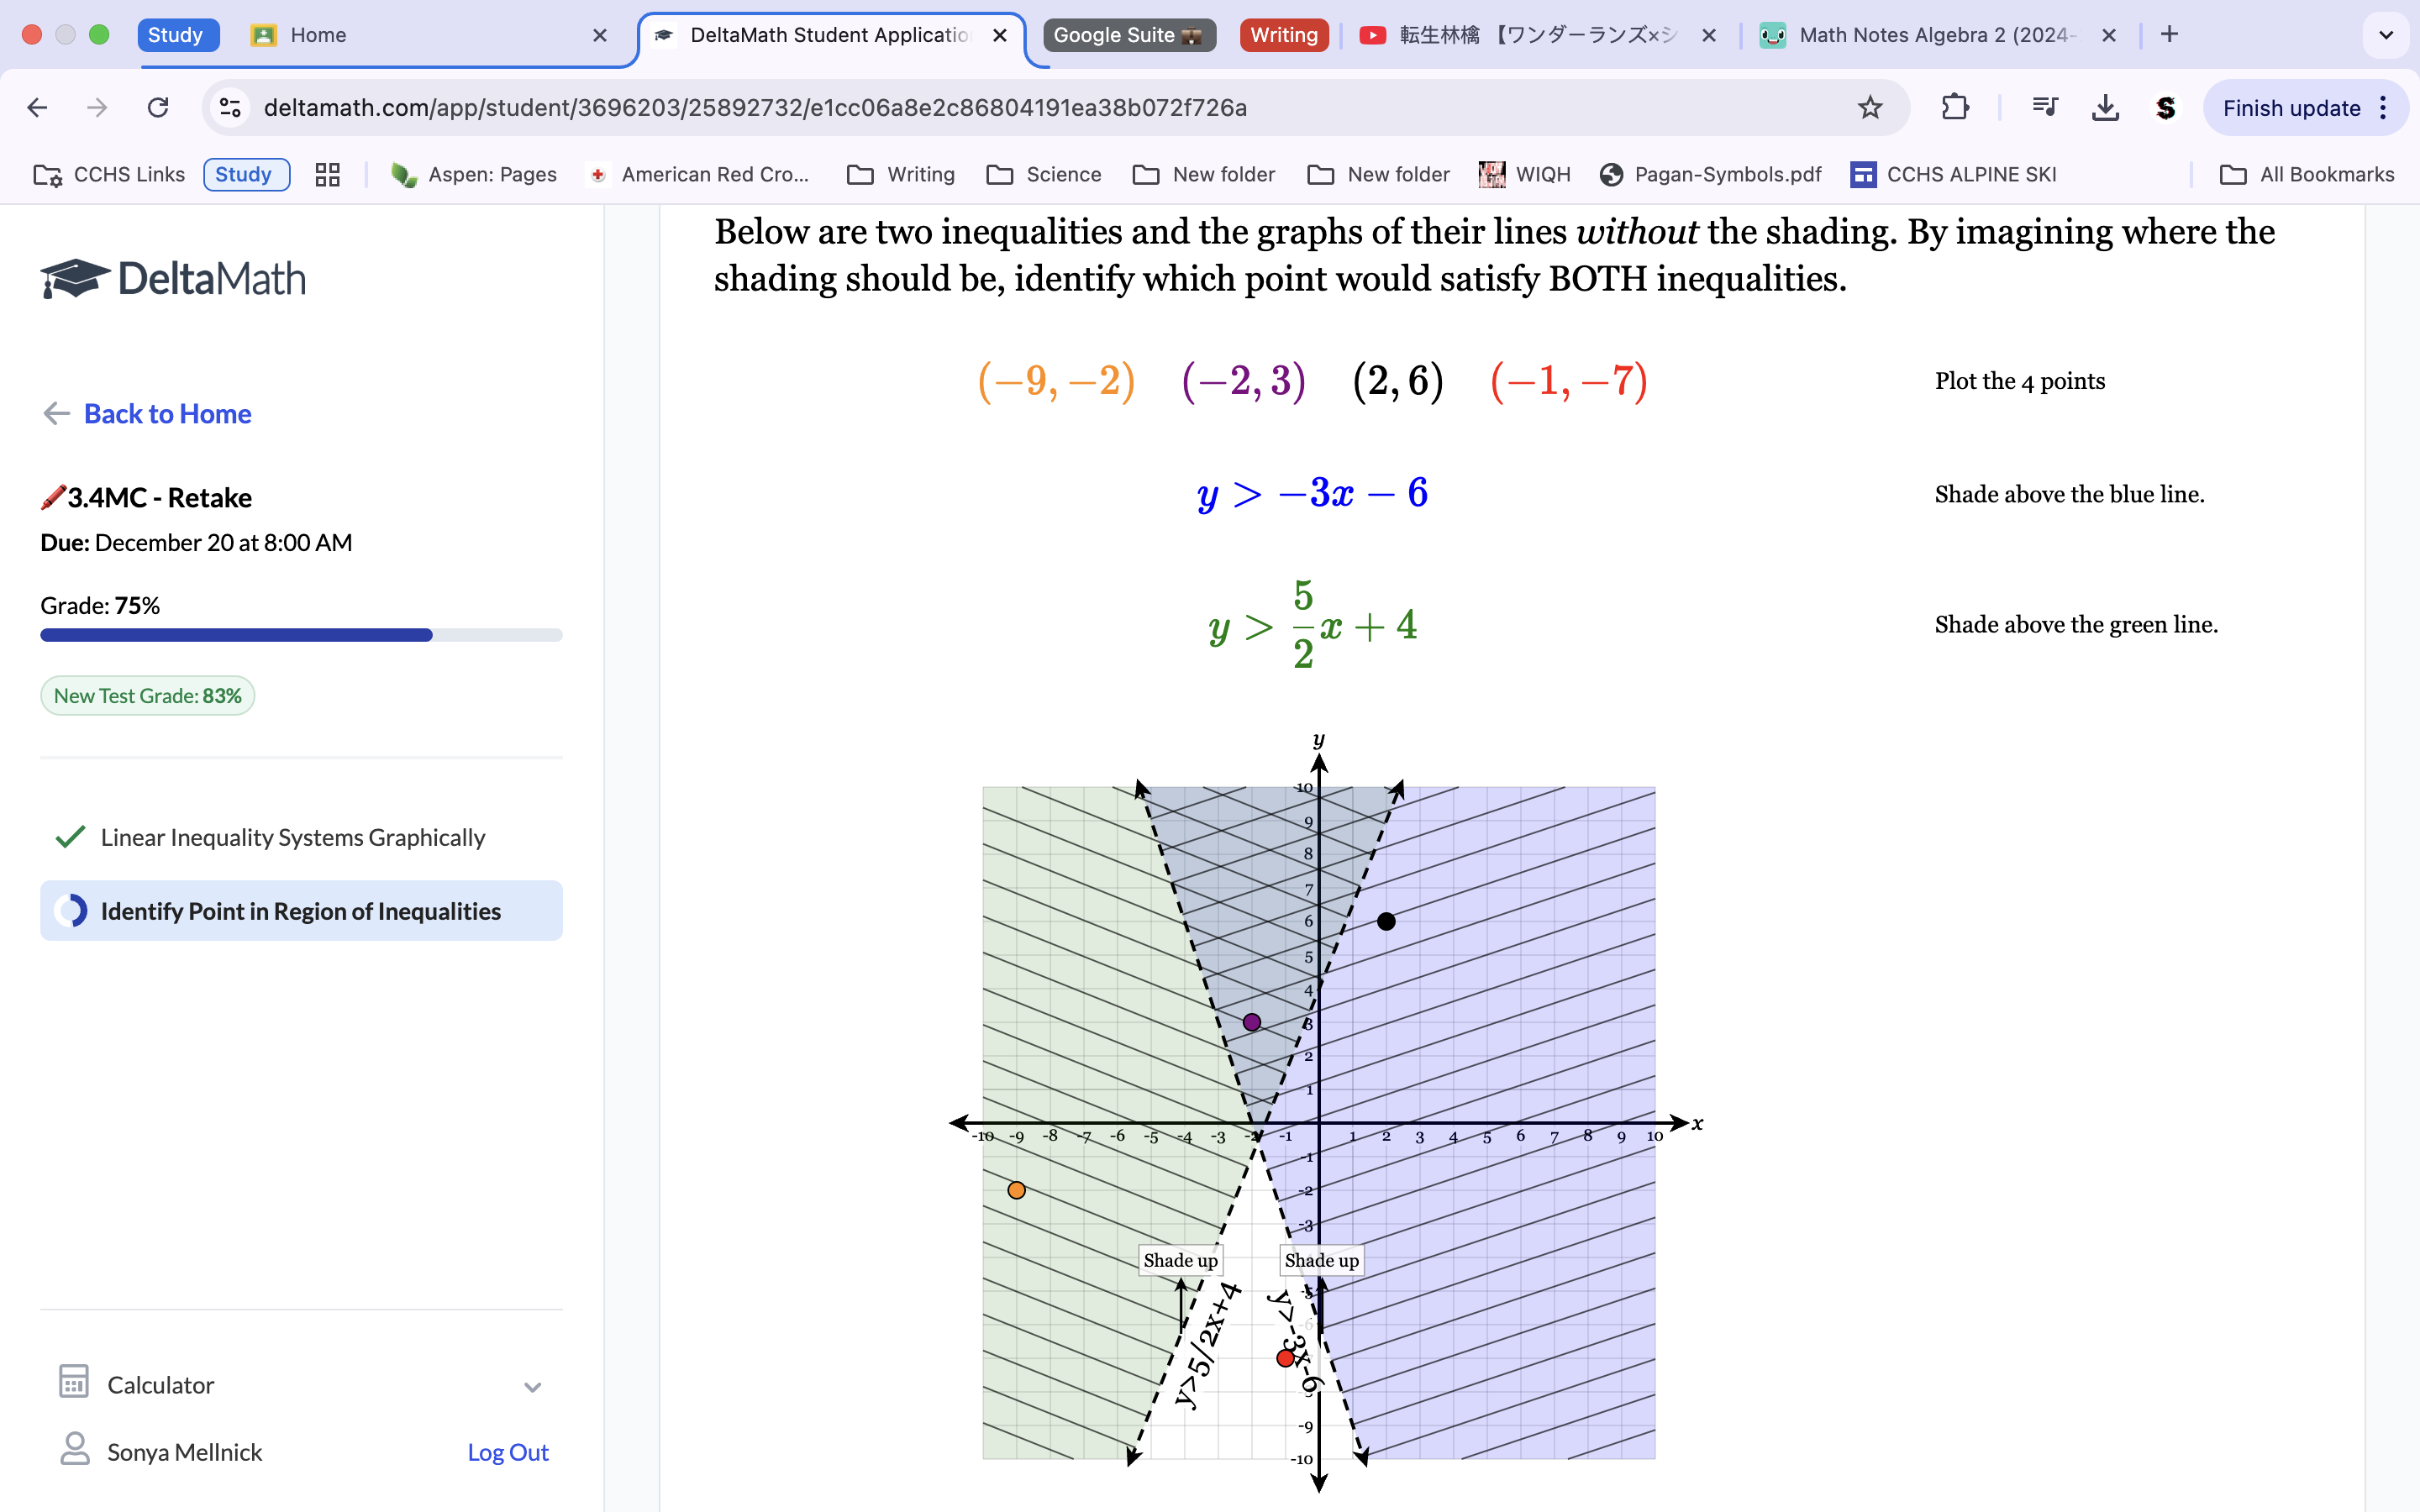
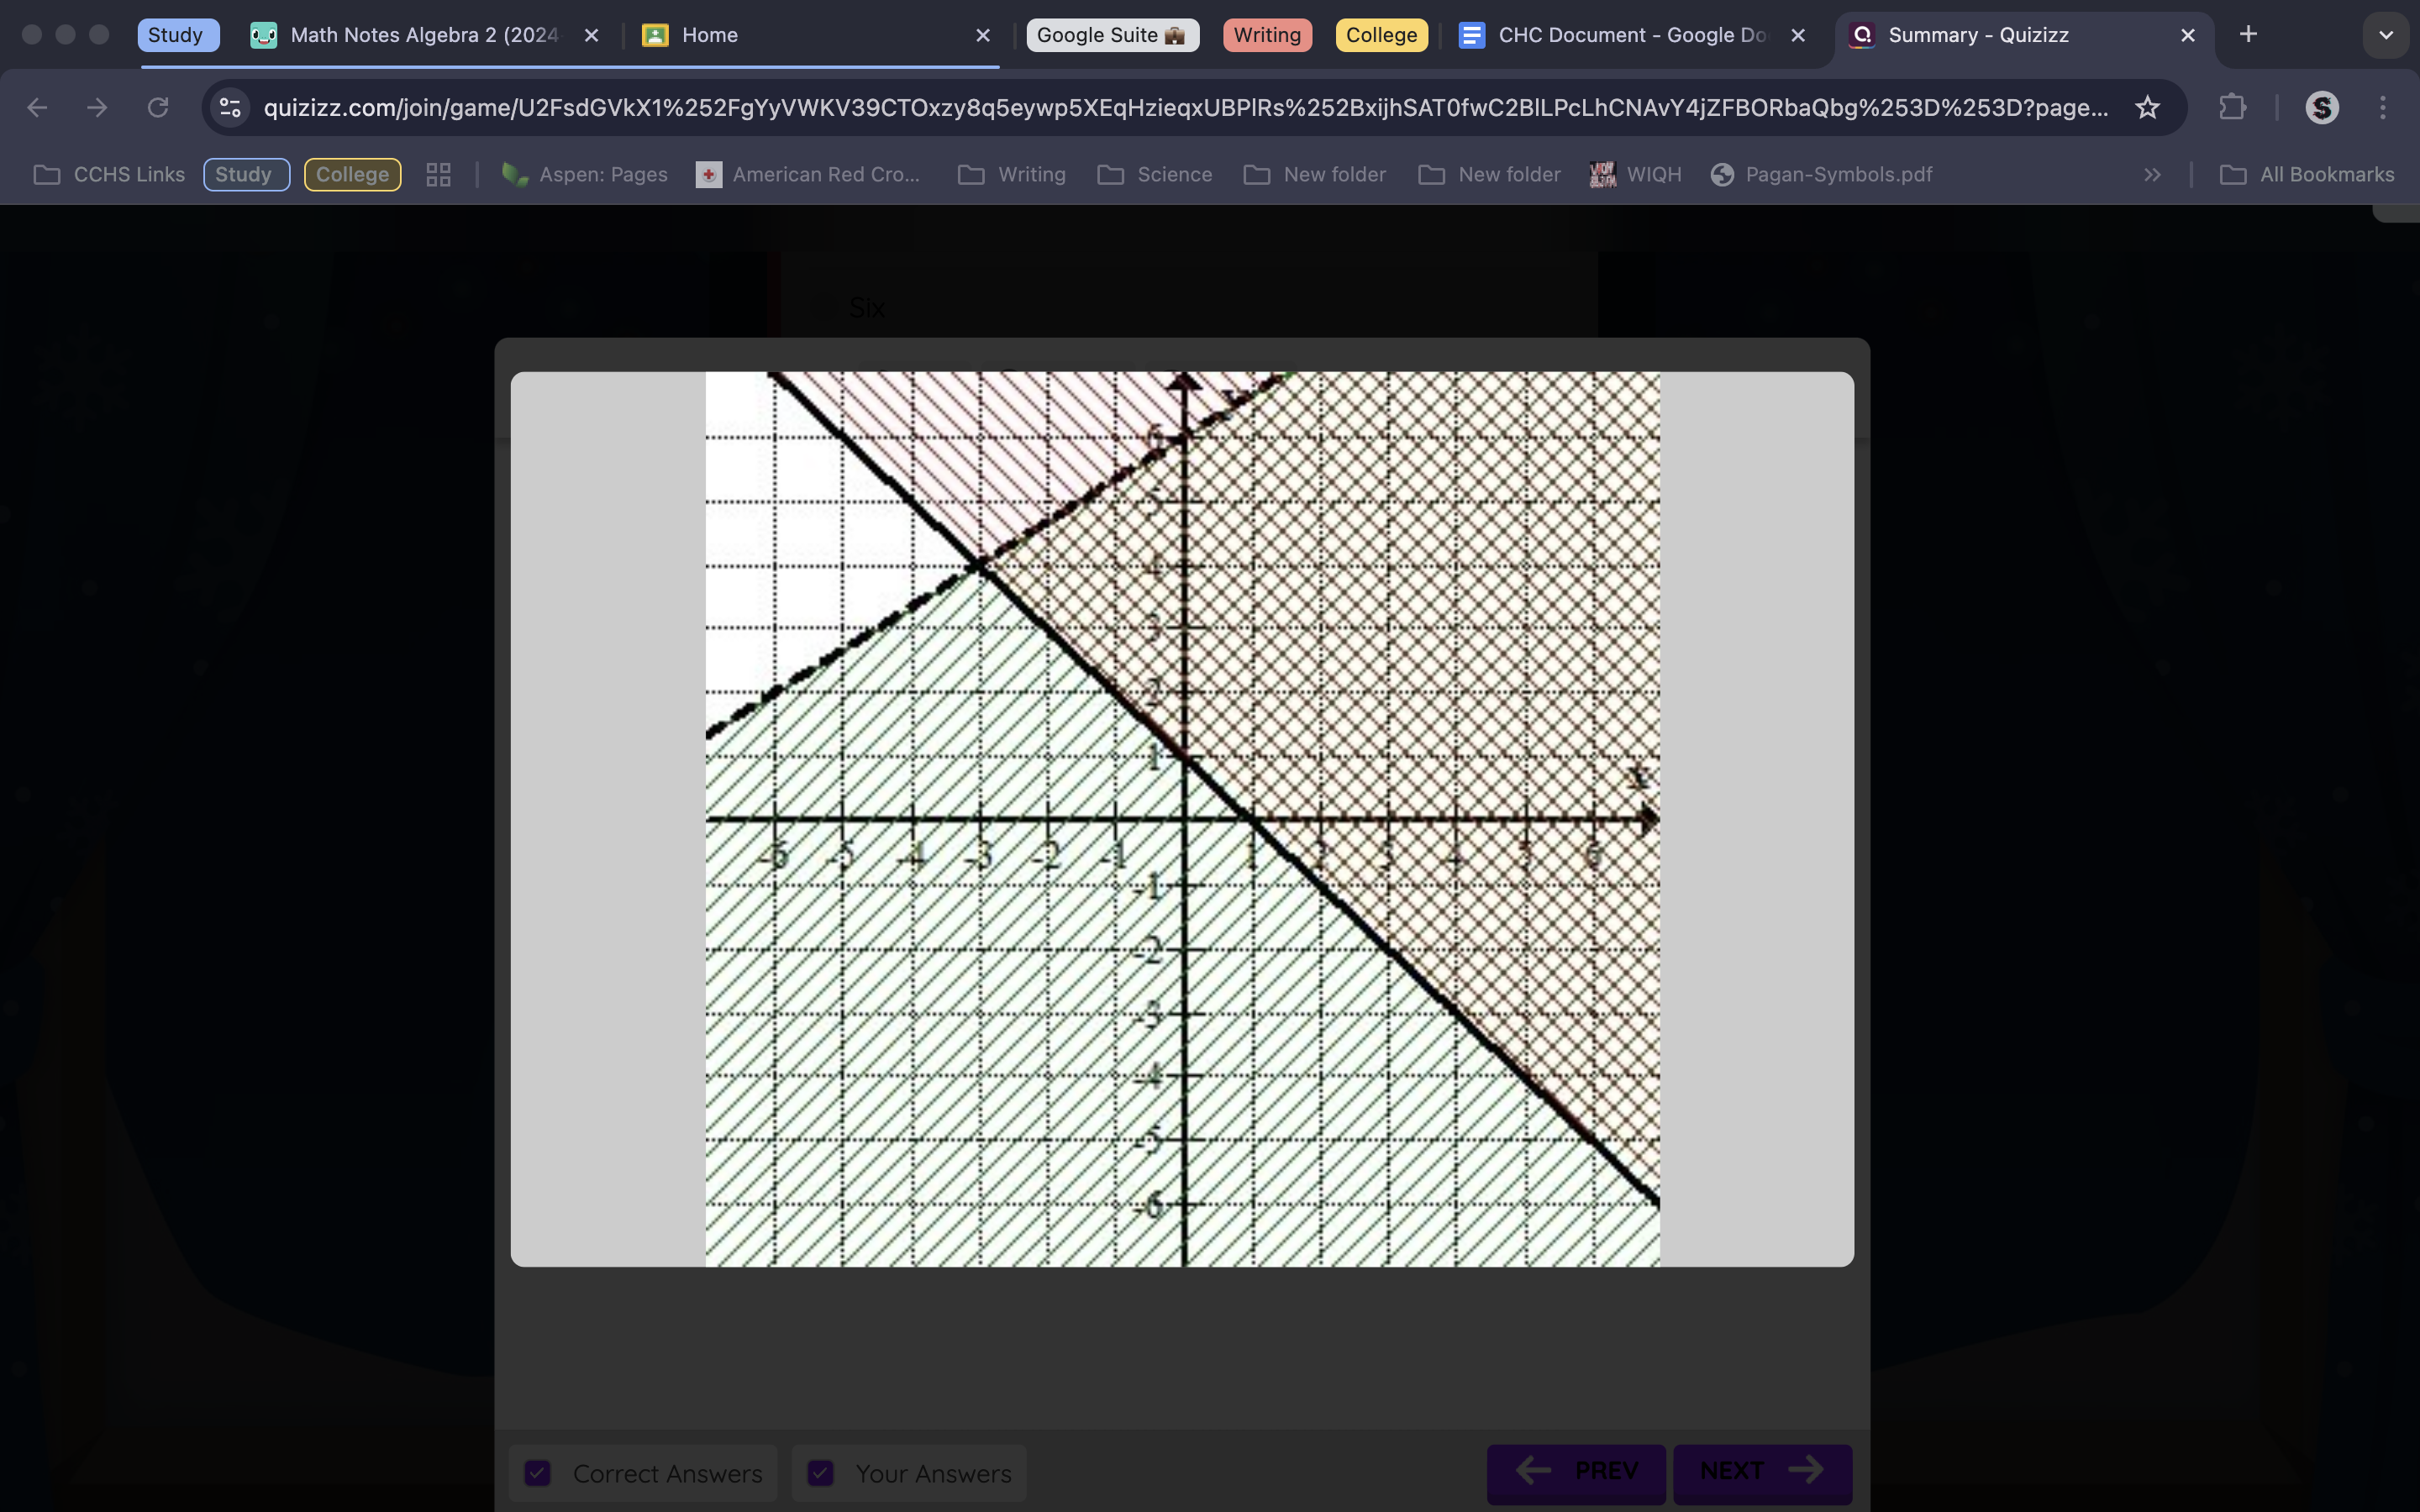
1) Name a solution to the graphed inequalities.
4.1 Mastery Check
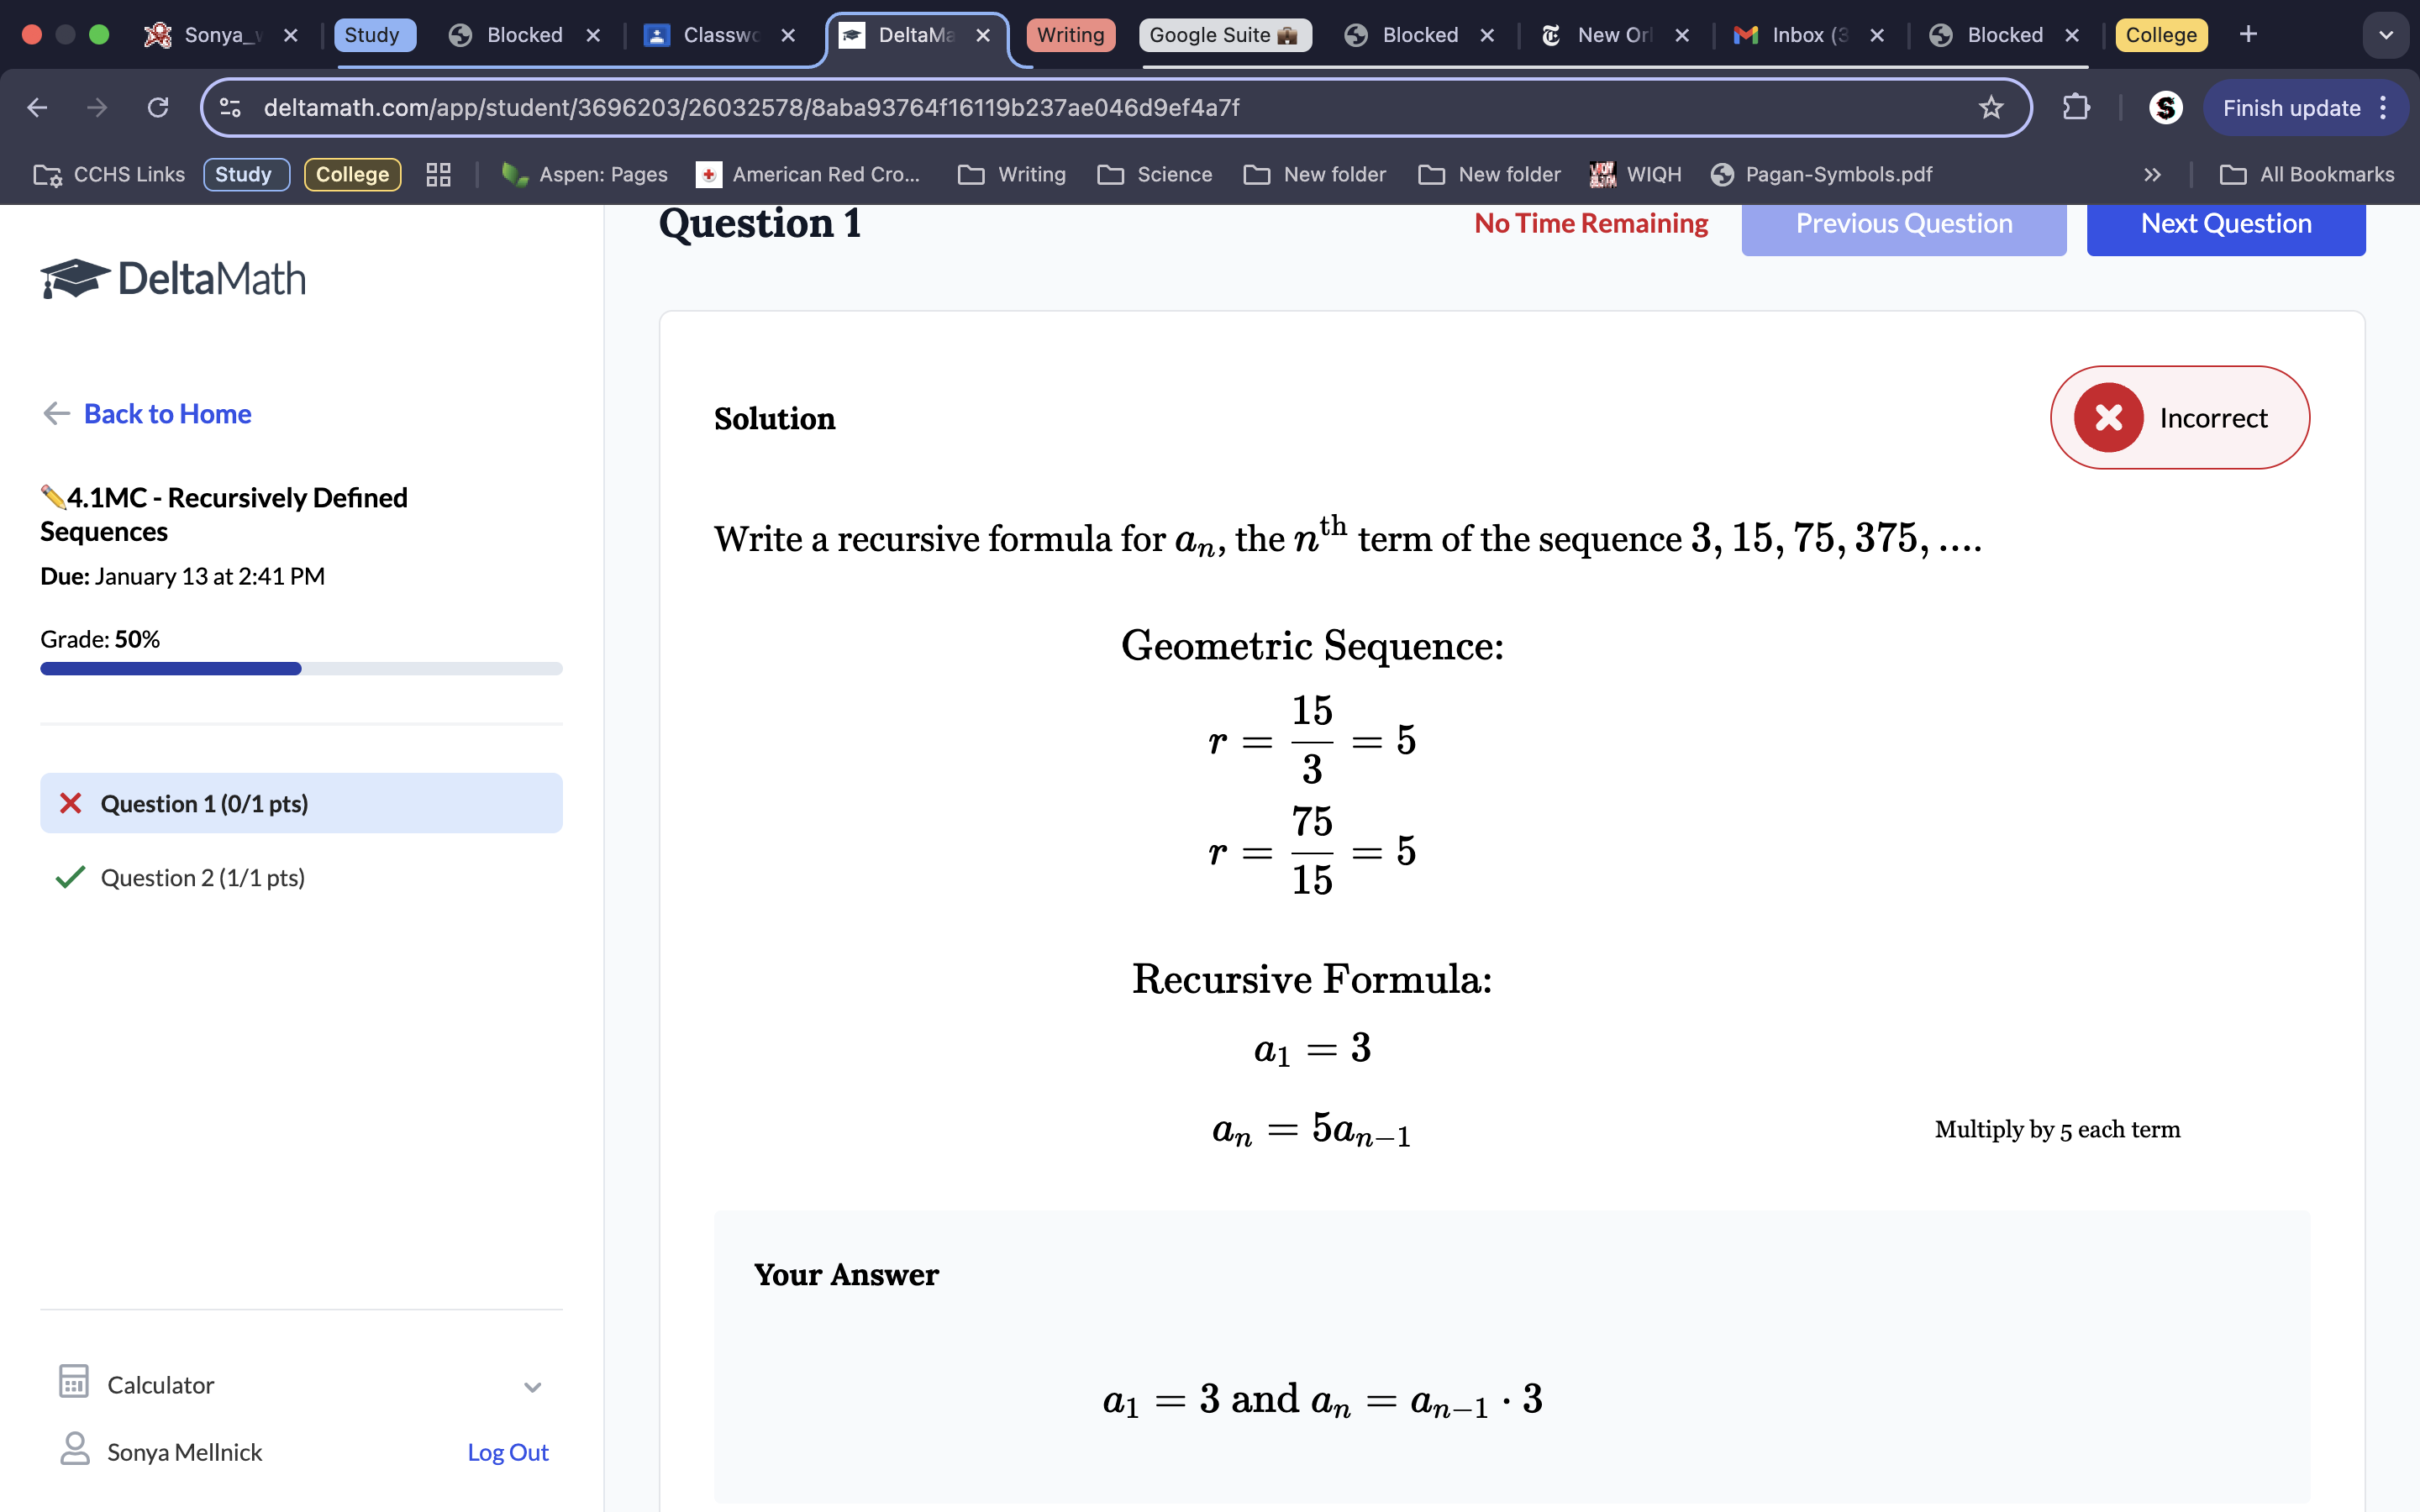
Because the 1st term listed is 3, and a1=first term, we know a1=3. We see that there is a pattern where every number is multiplied by 5, so we put that in front of the an-1 equation because 5 is the equations factor, making the recursive formula an=5an-1.
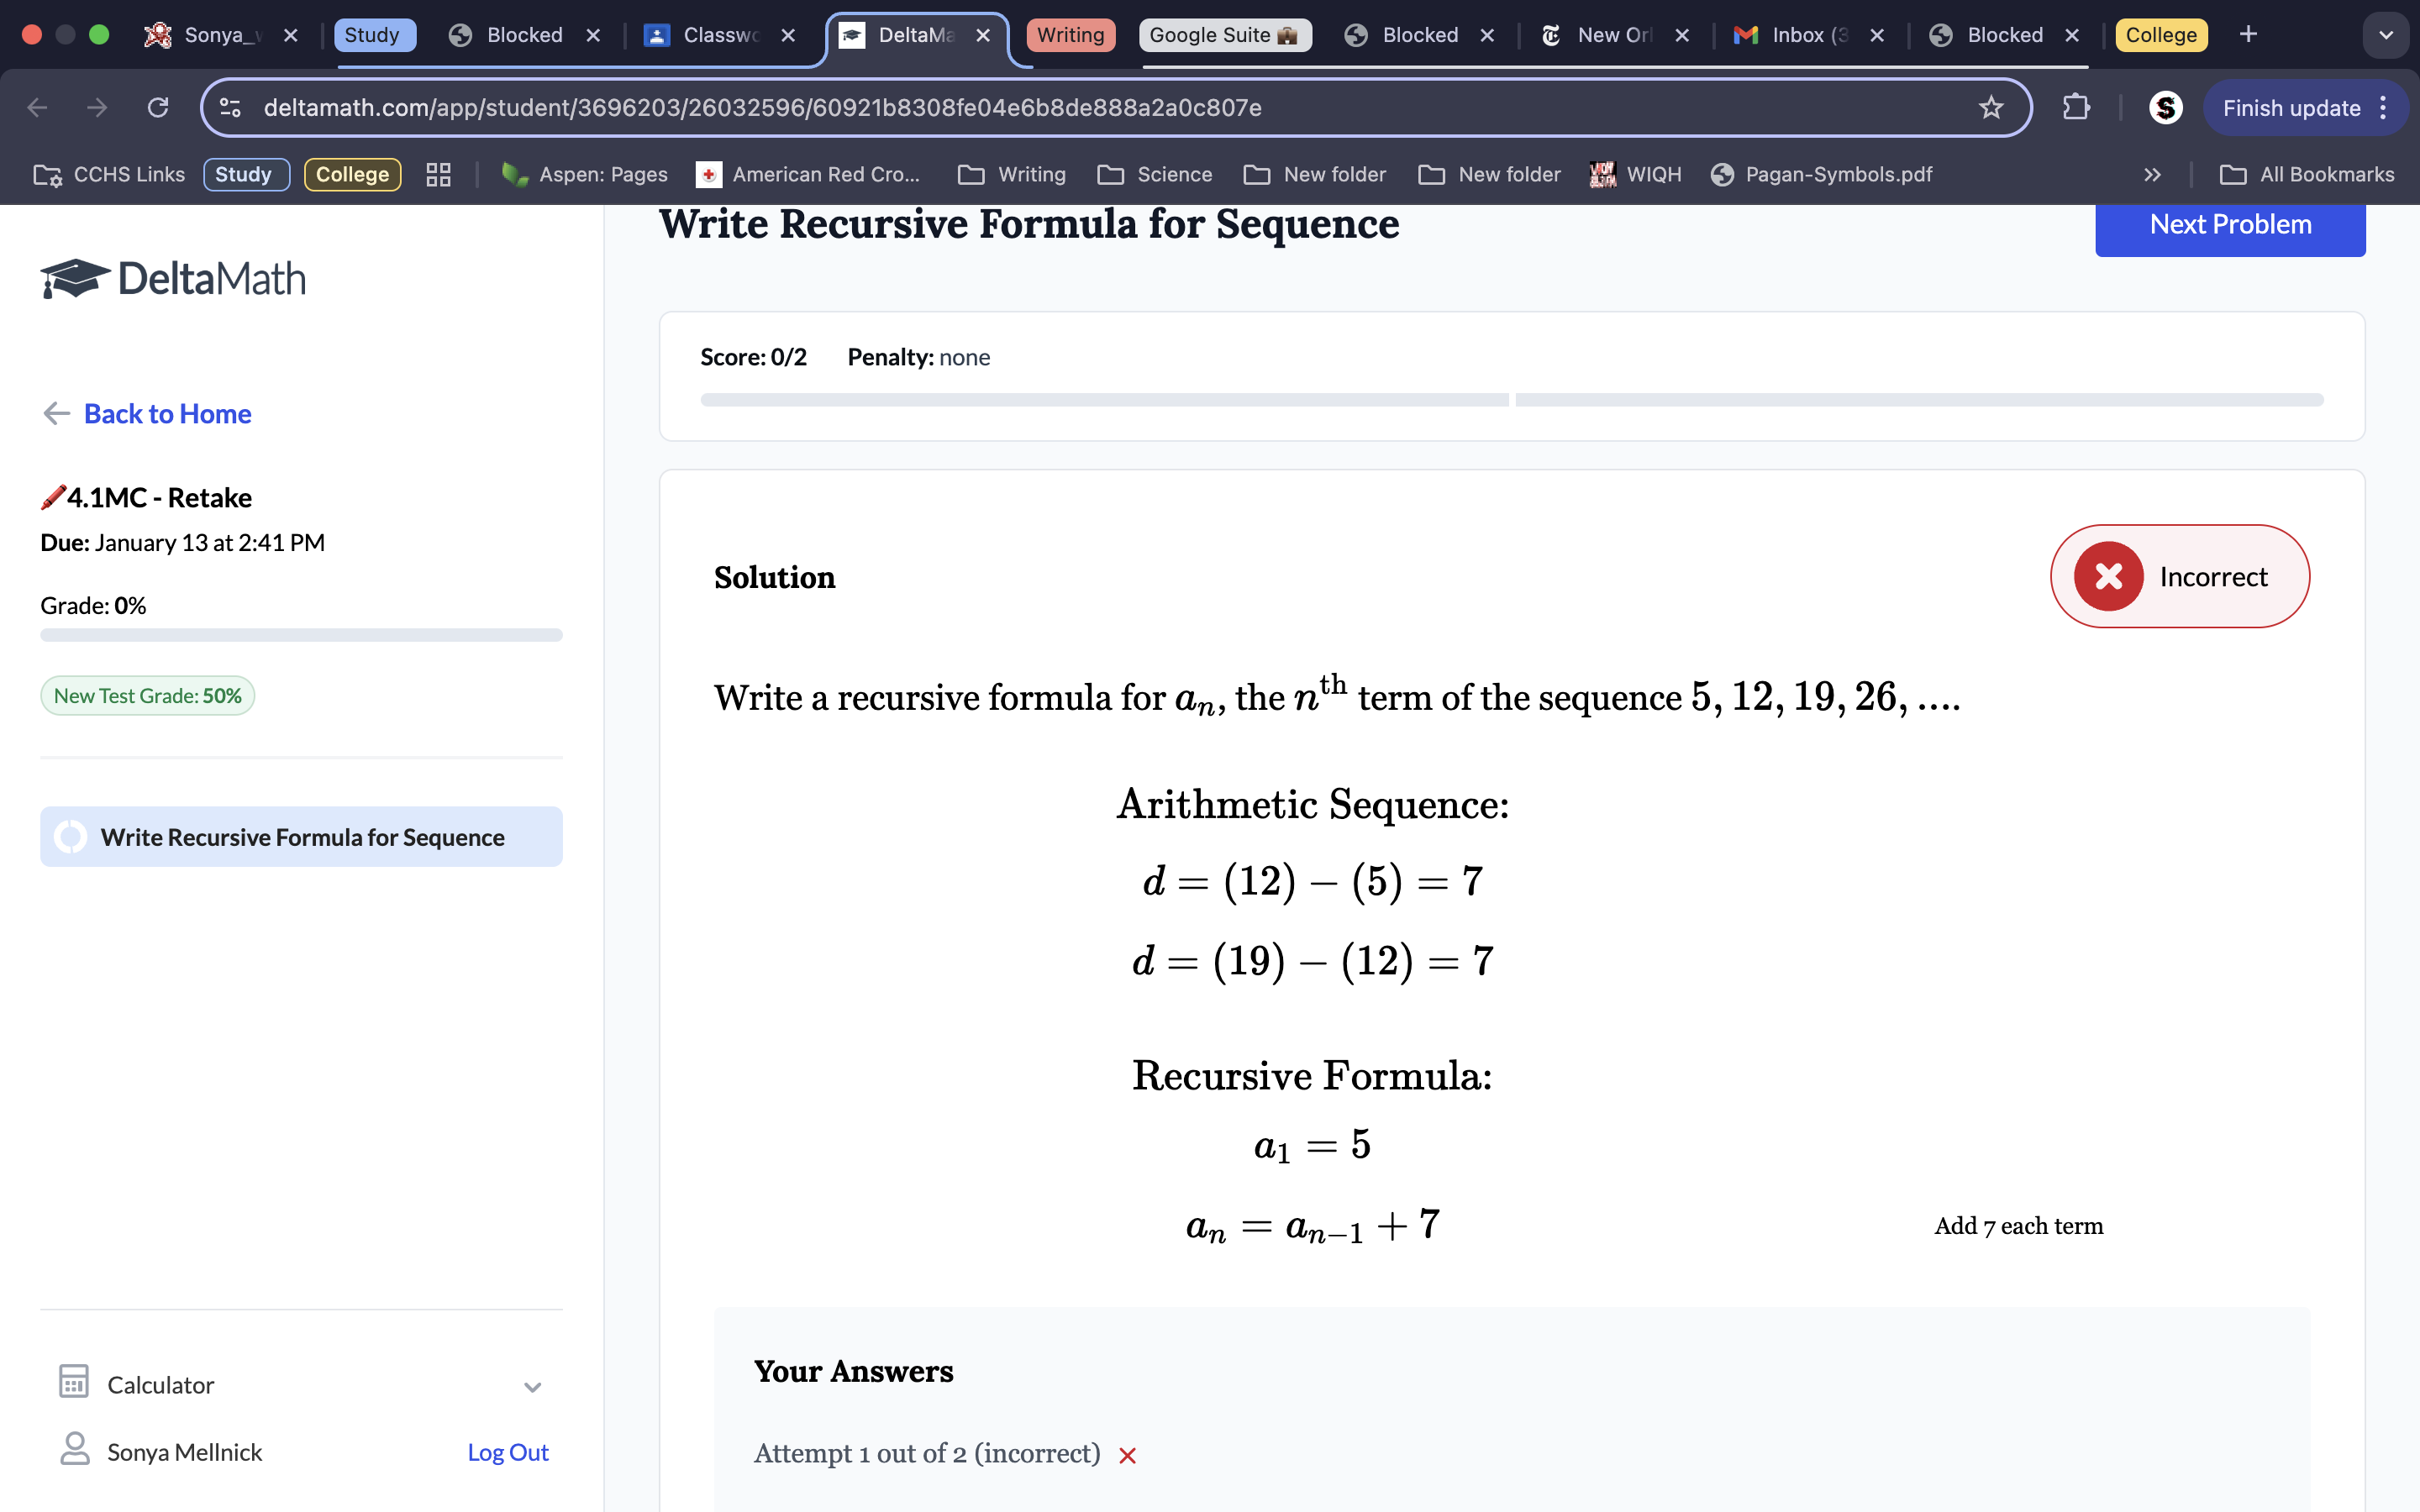
Because 5 is the first term, a1=5. Because the factor being added is +7, the formula has that factor of +7 in the equation, which makes an=an-1 +7.
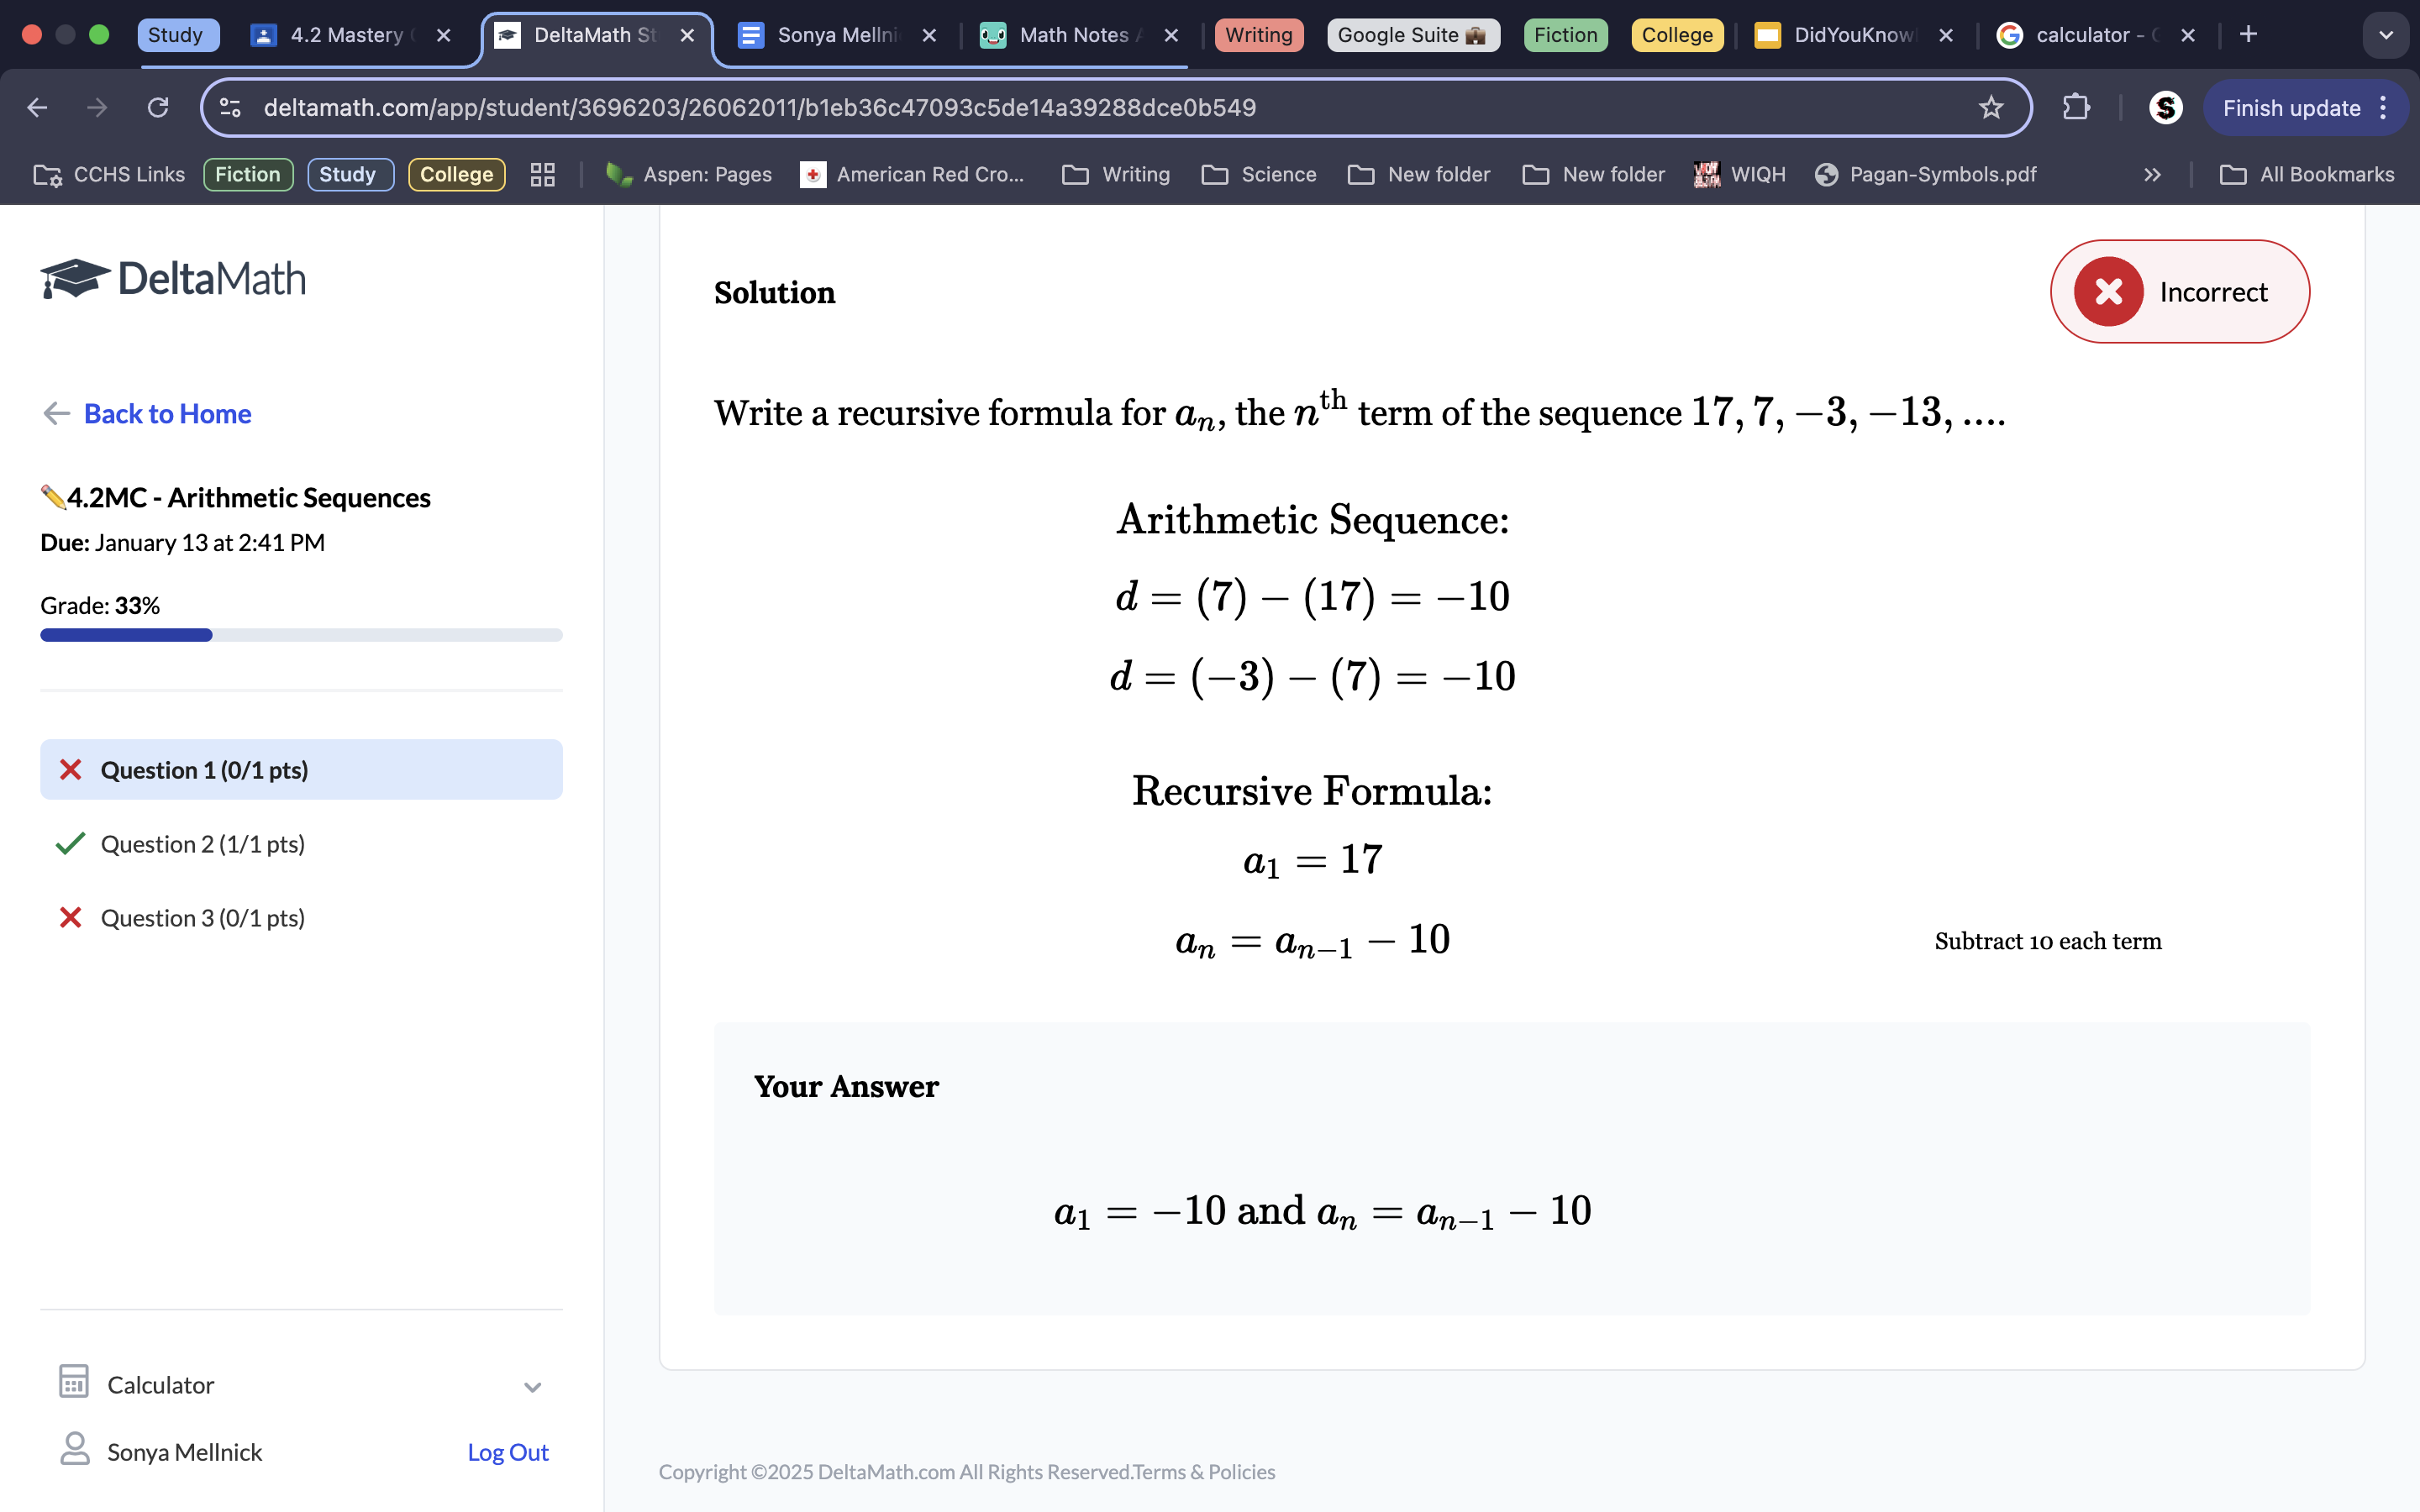
Because both 17-7 and -3—(+)13 both equal 10, we know the common difference is -10, because you subtract 10 each time. The first term is 17, so we plug each of those values into their respective spots in the formula, getting a1=17, an=an-1-10.
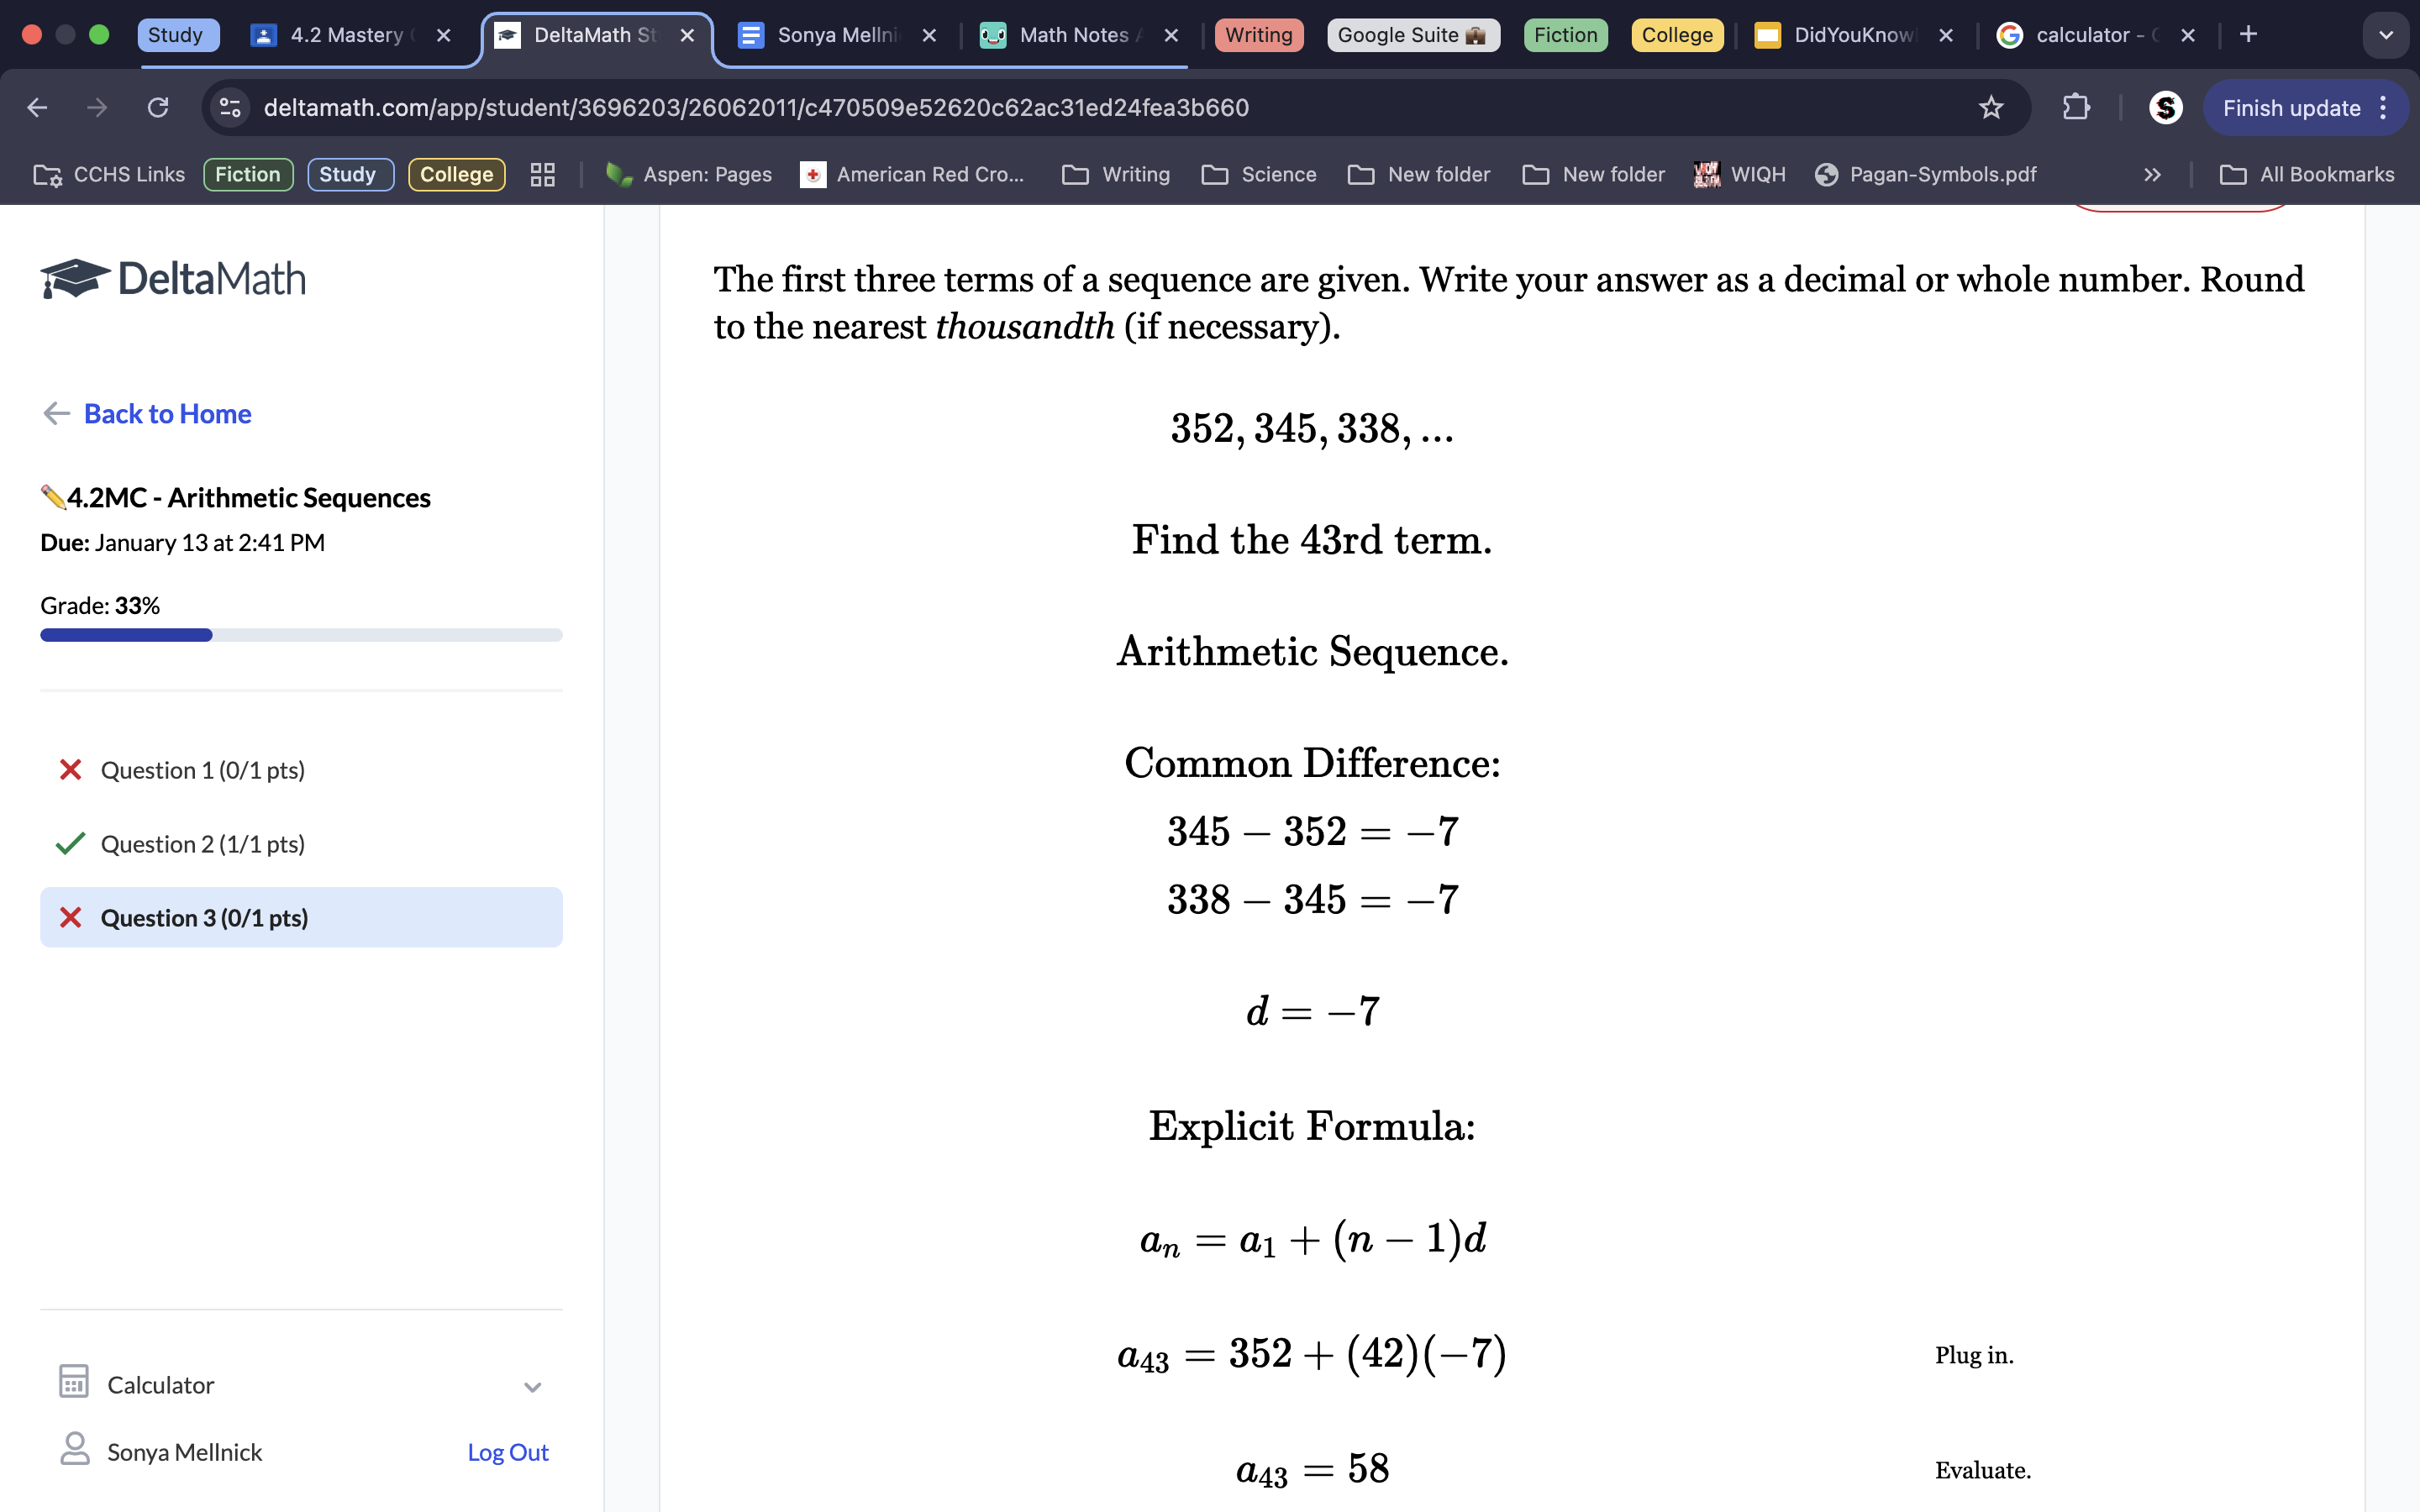
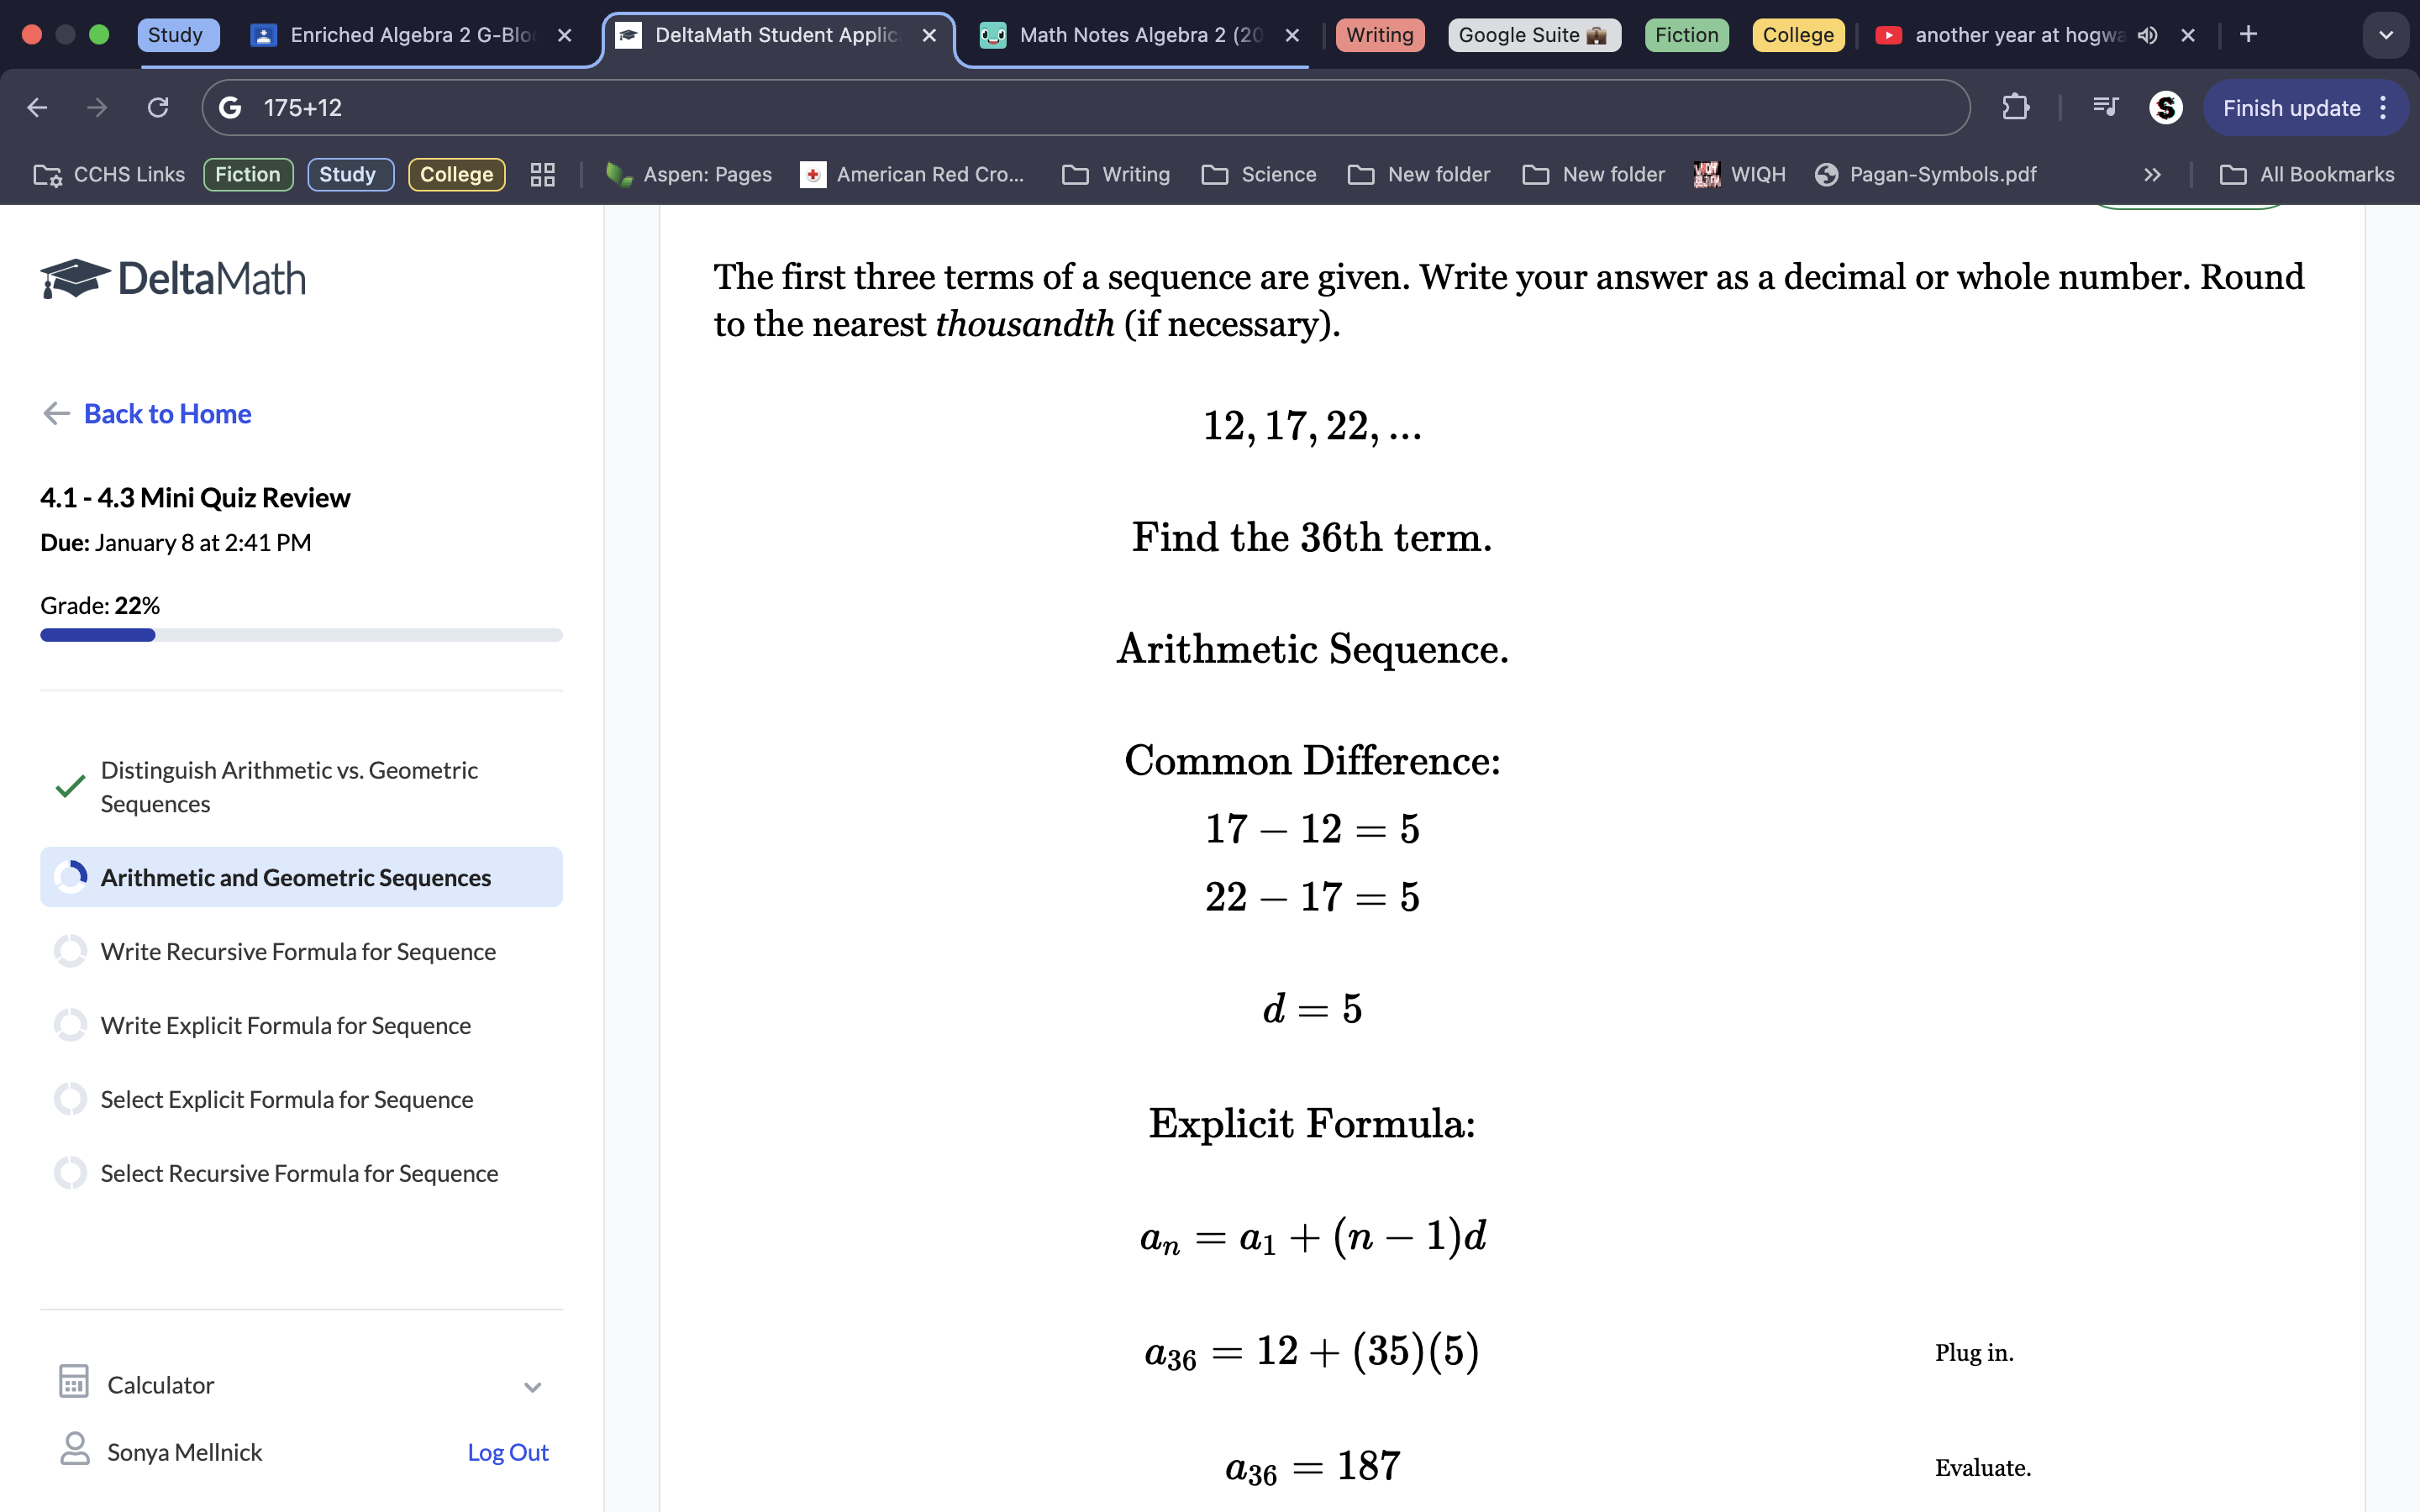
To find the 43rd term, we first find the common difference. Because 338-345 and 345-352 both equal -7, we know the common difference is -7 (we always go from the 3rd term down to the 1st term to get our common difference) We also know the 1st term is 352. Then, we can just plug in both the 1st term and the common difference into their respective spots on the equations. This gets a43=352-7(n-1). We also know the term number we are trying to get, 43. Plug that in for n. Now you can solve it. This gets a final answer of a43=58
-Practice Exam-
1. Remember that the equation is an-1(n-1) so you have to subtract 1 from the term your multiplying for. Multiply the term number by the ratio/difference and add it to your 1st term.Remember to include a(term number)= and then the answer.
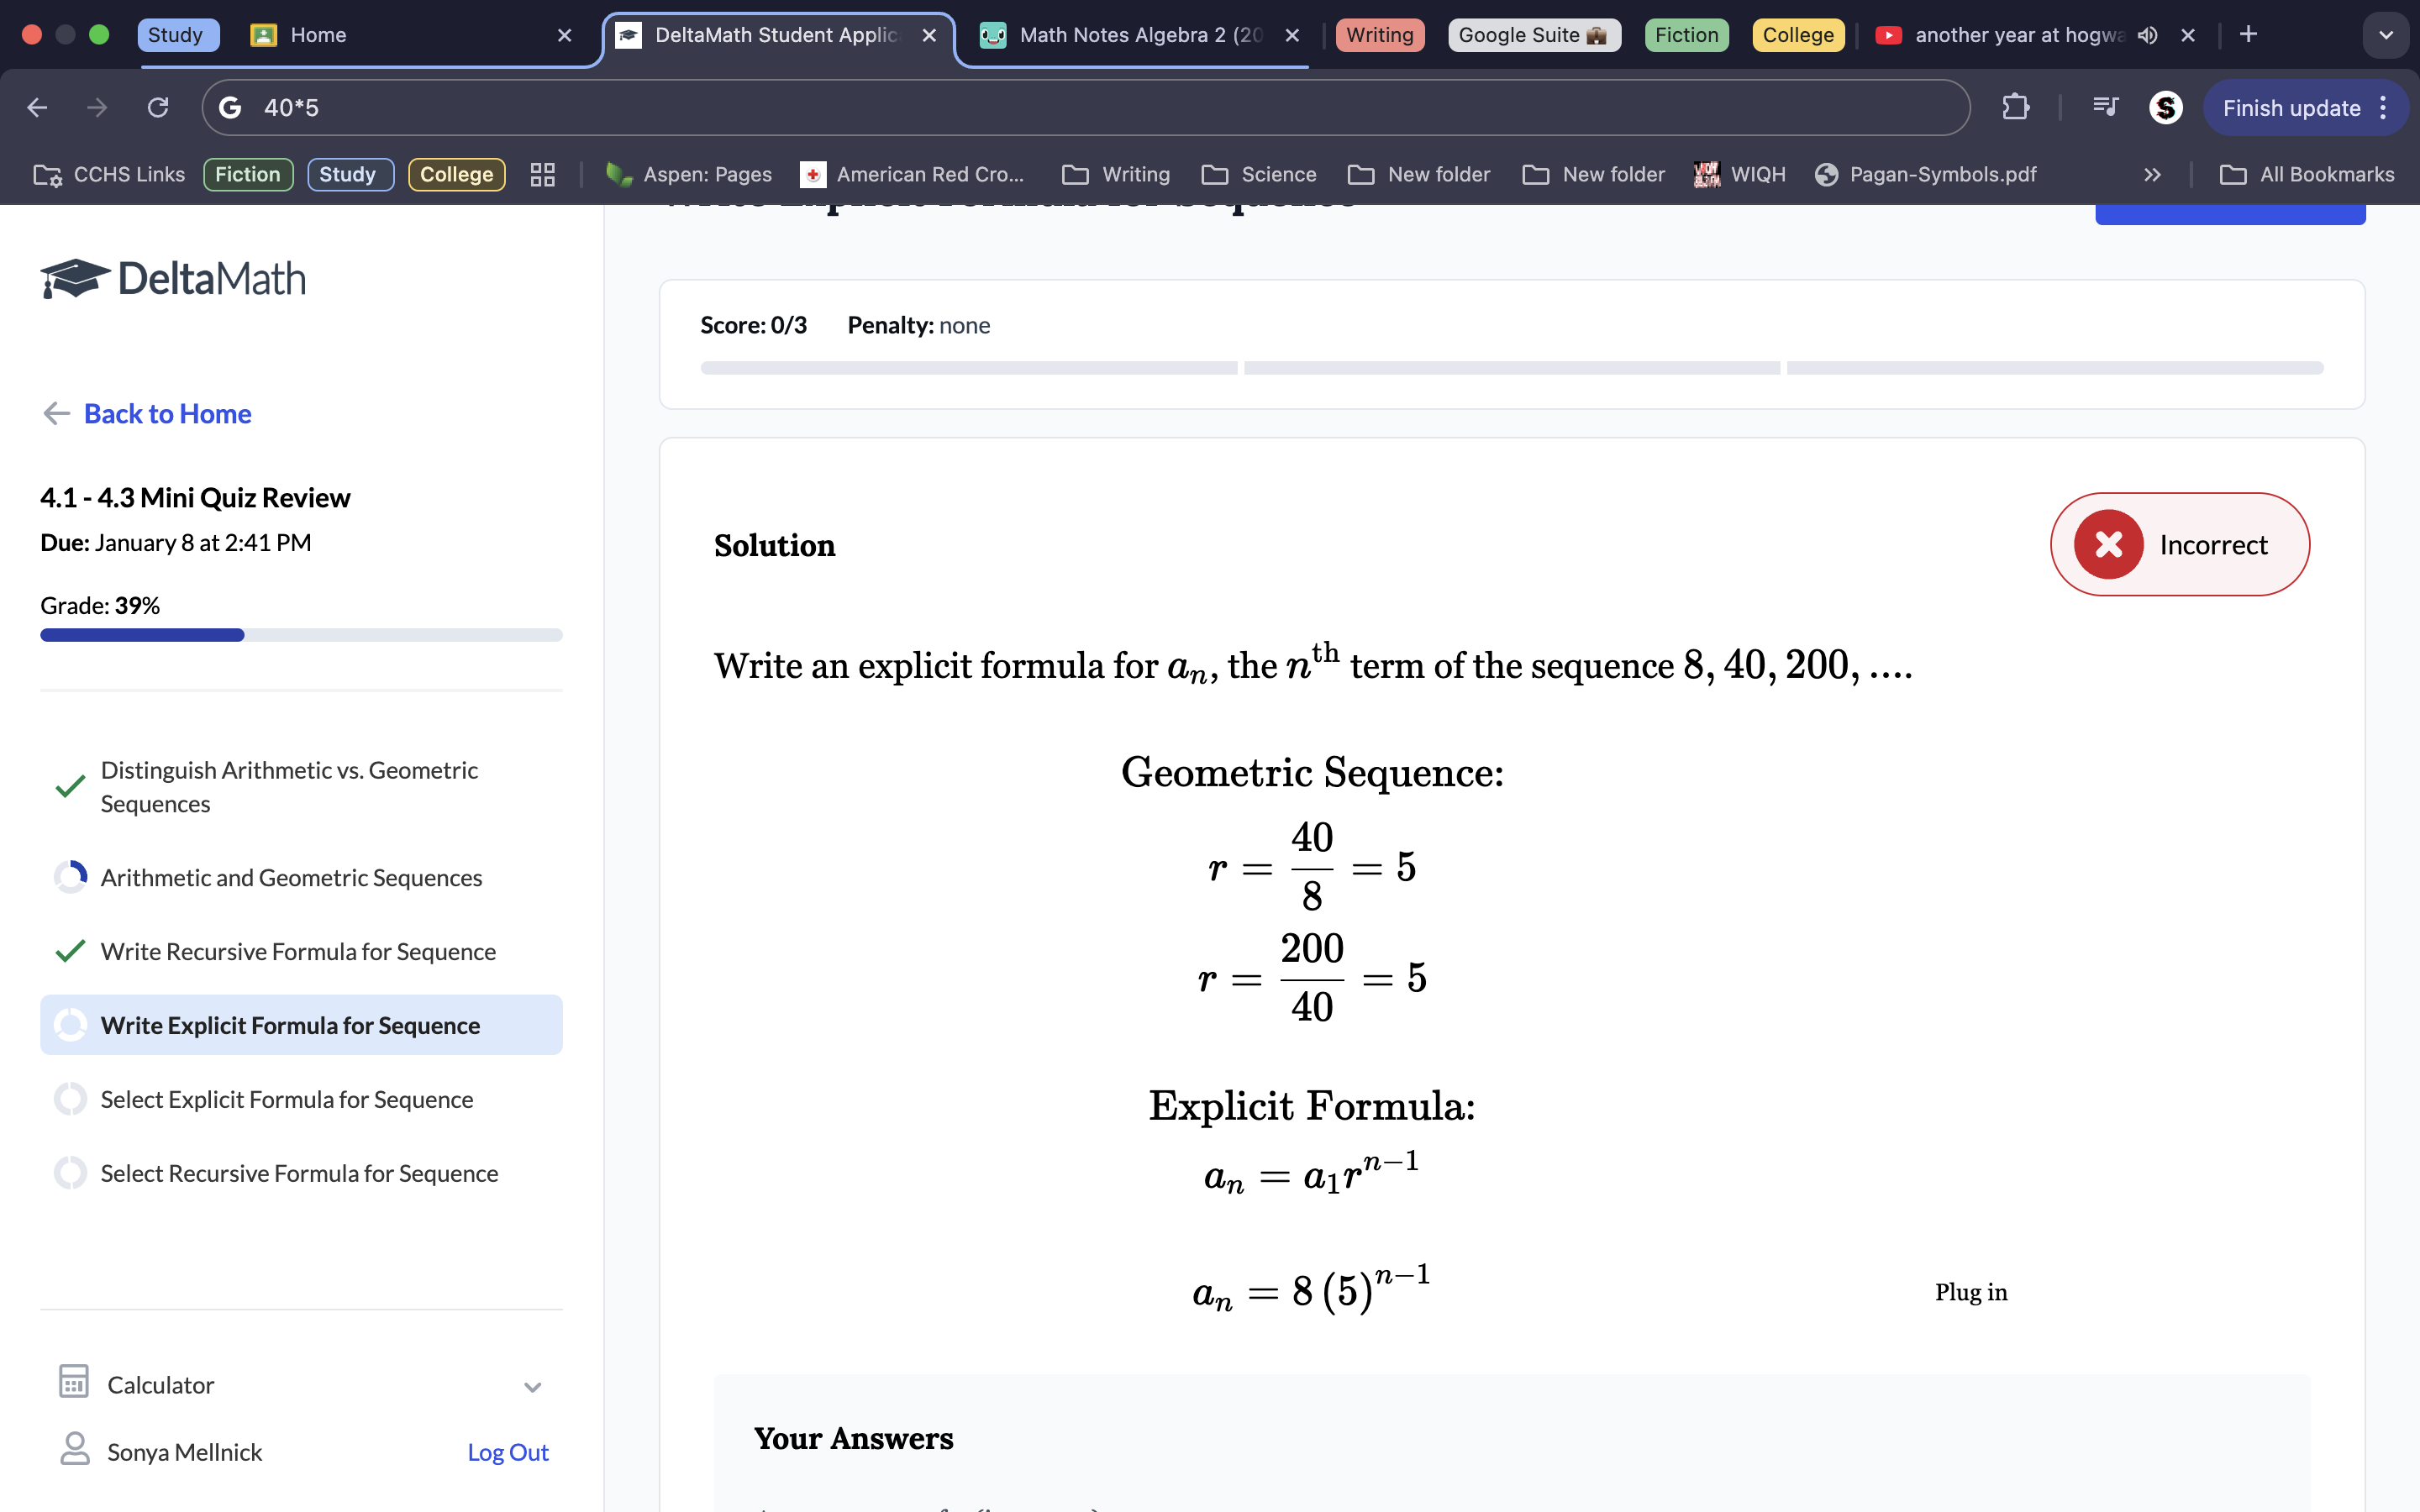
2. Because 200/4 and 40/8 are both 5, we know the common ratio is 5. The explicit formula for geometric sequences is an=a1rn-1, with a1 representing the 1st term, r representing the common ratio, and n representing the term number. Because we don’t know the nth term, we leave n as a variable. But, we do know the 1st term and the common ratio, so we plug each in their respective variables to get a final explicit formula of an=8(5)n-1
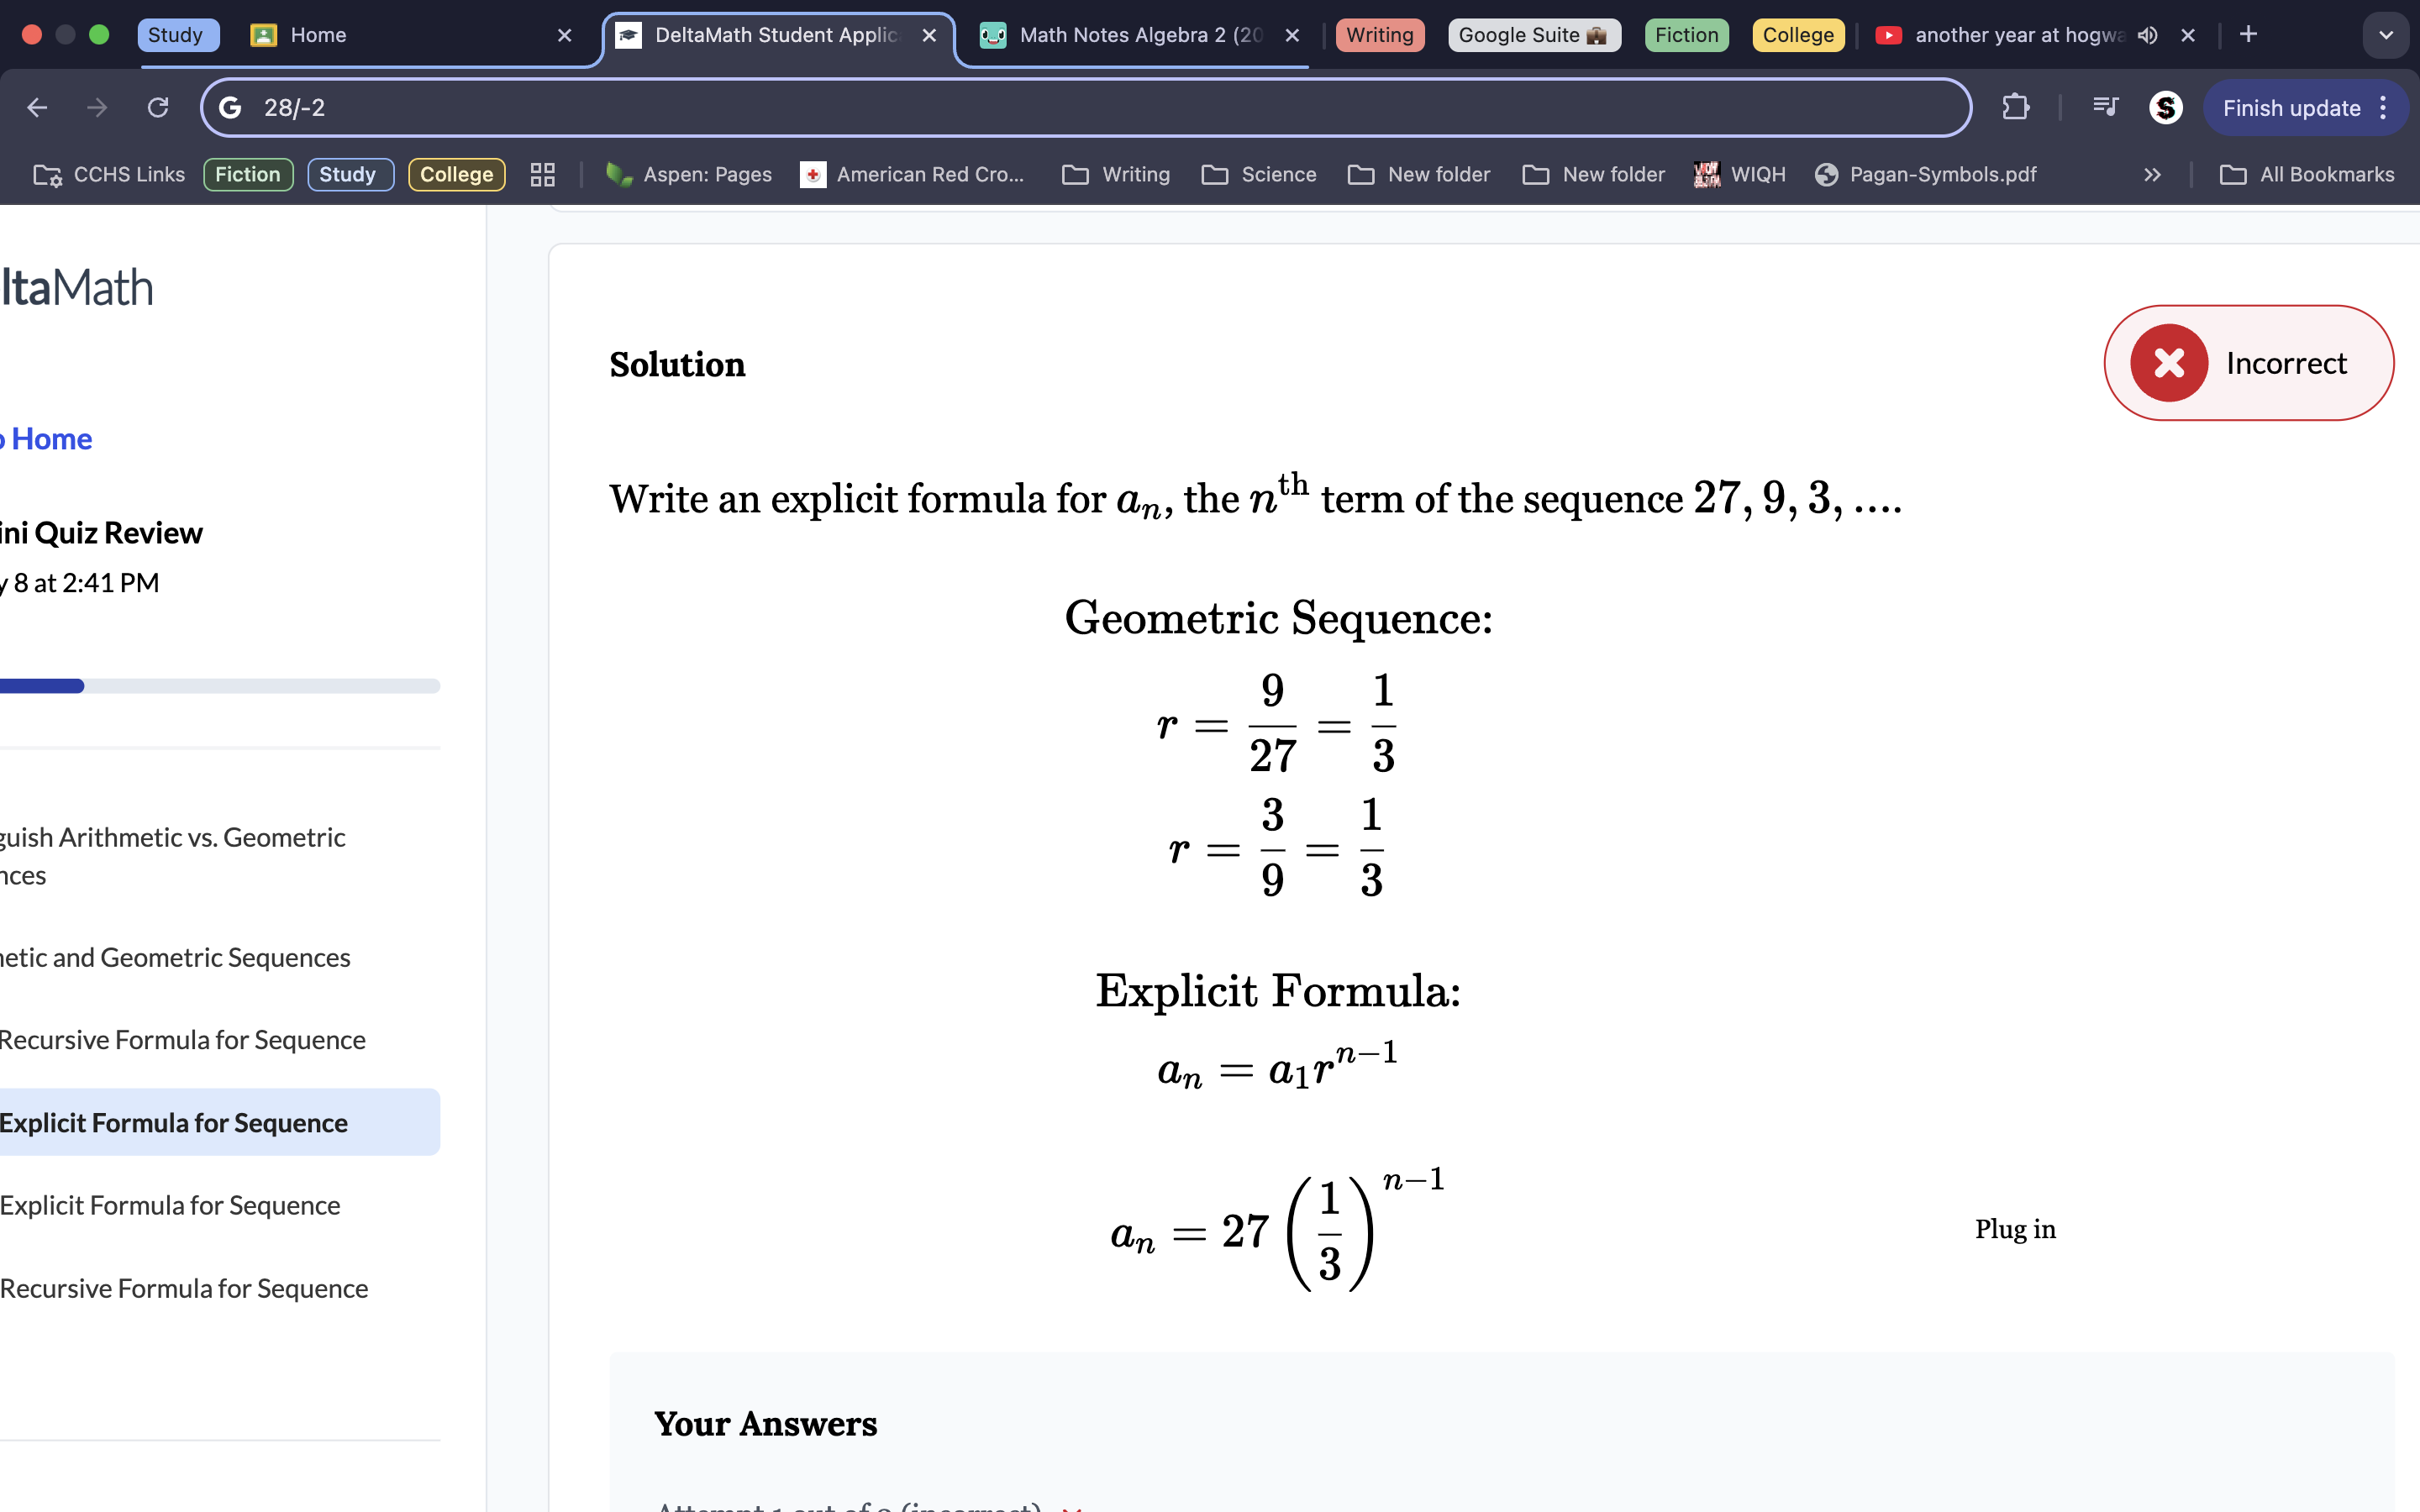
3. To get the common ratio, you must divide from the 3rd term down. Because both 3/9 and 9/27 are both 1/3, we know this is the common ratio. We also know that 27 is the 1st term, so plug both these values into the explicit formula to get an=27(1/3)n-1
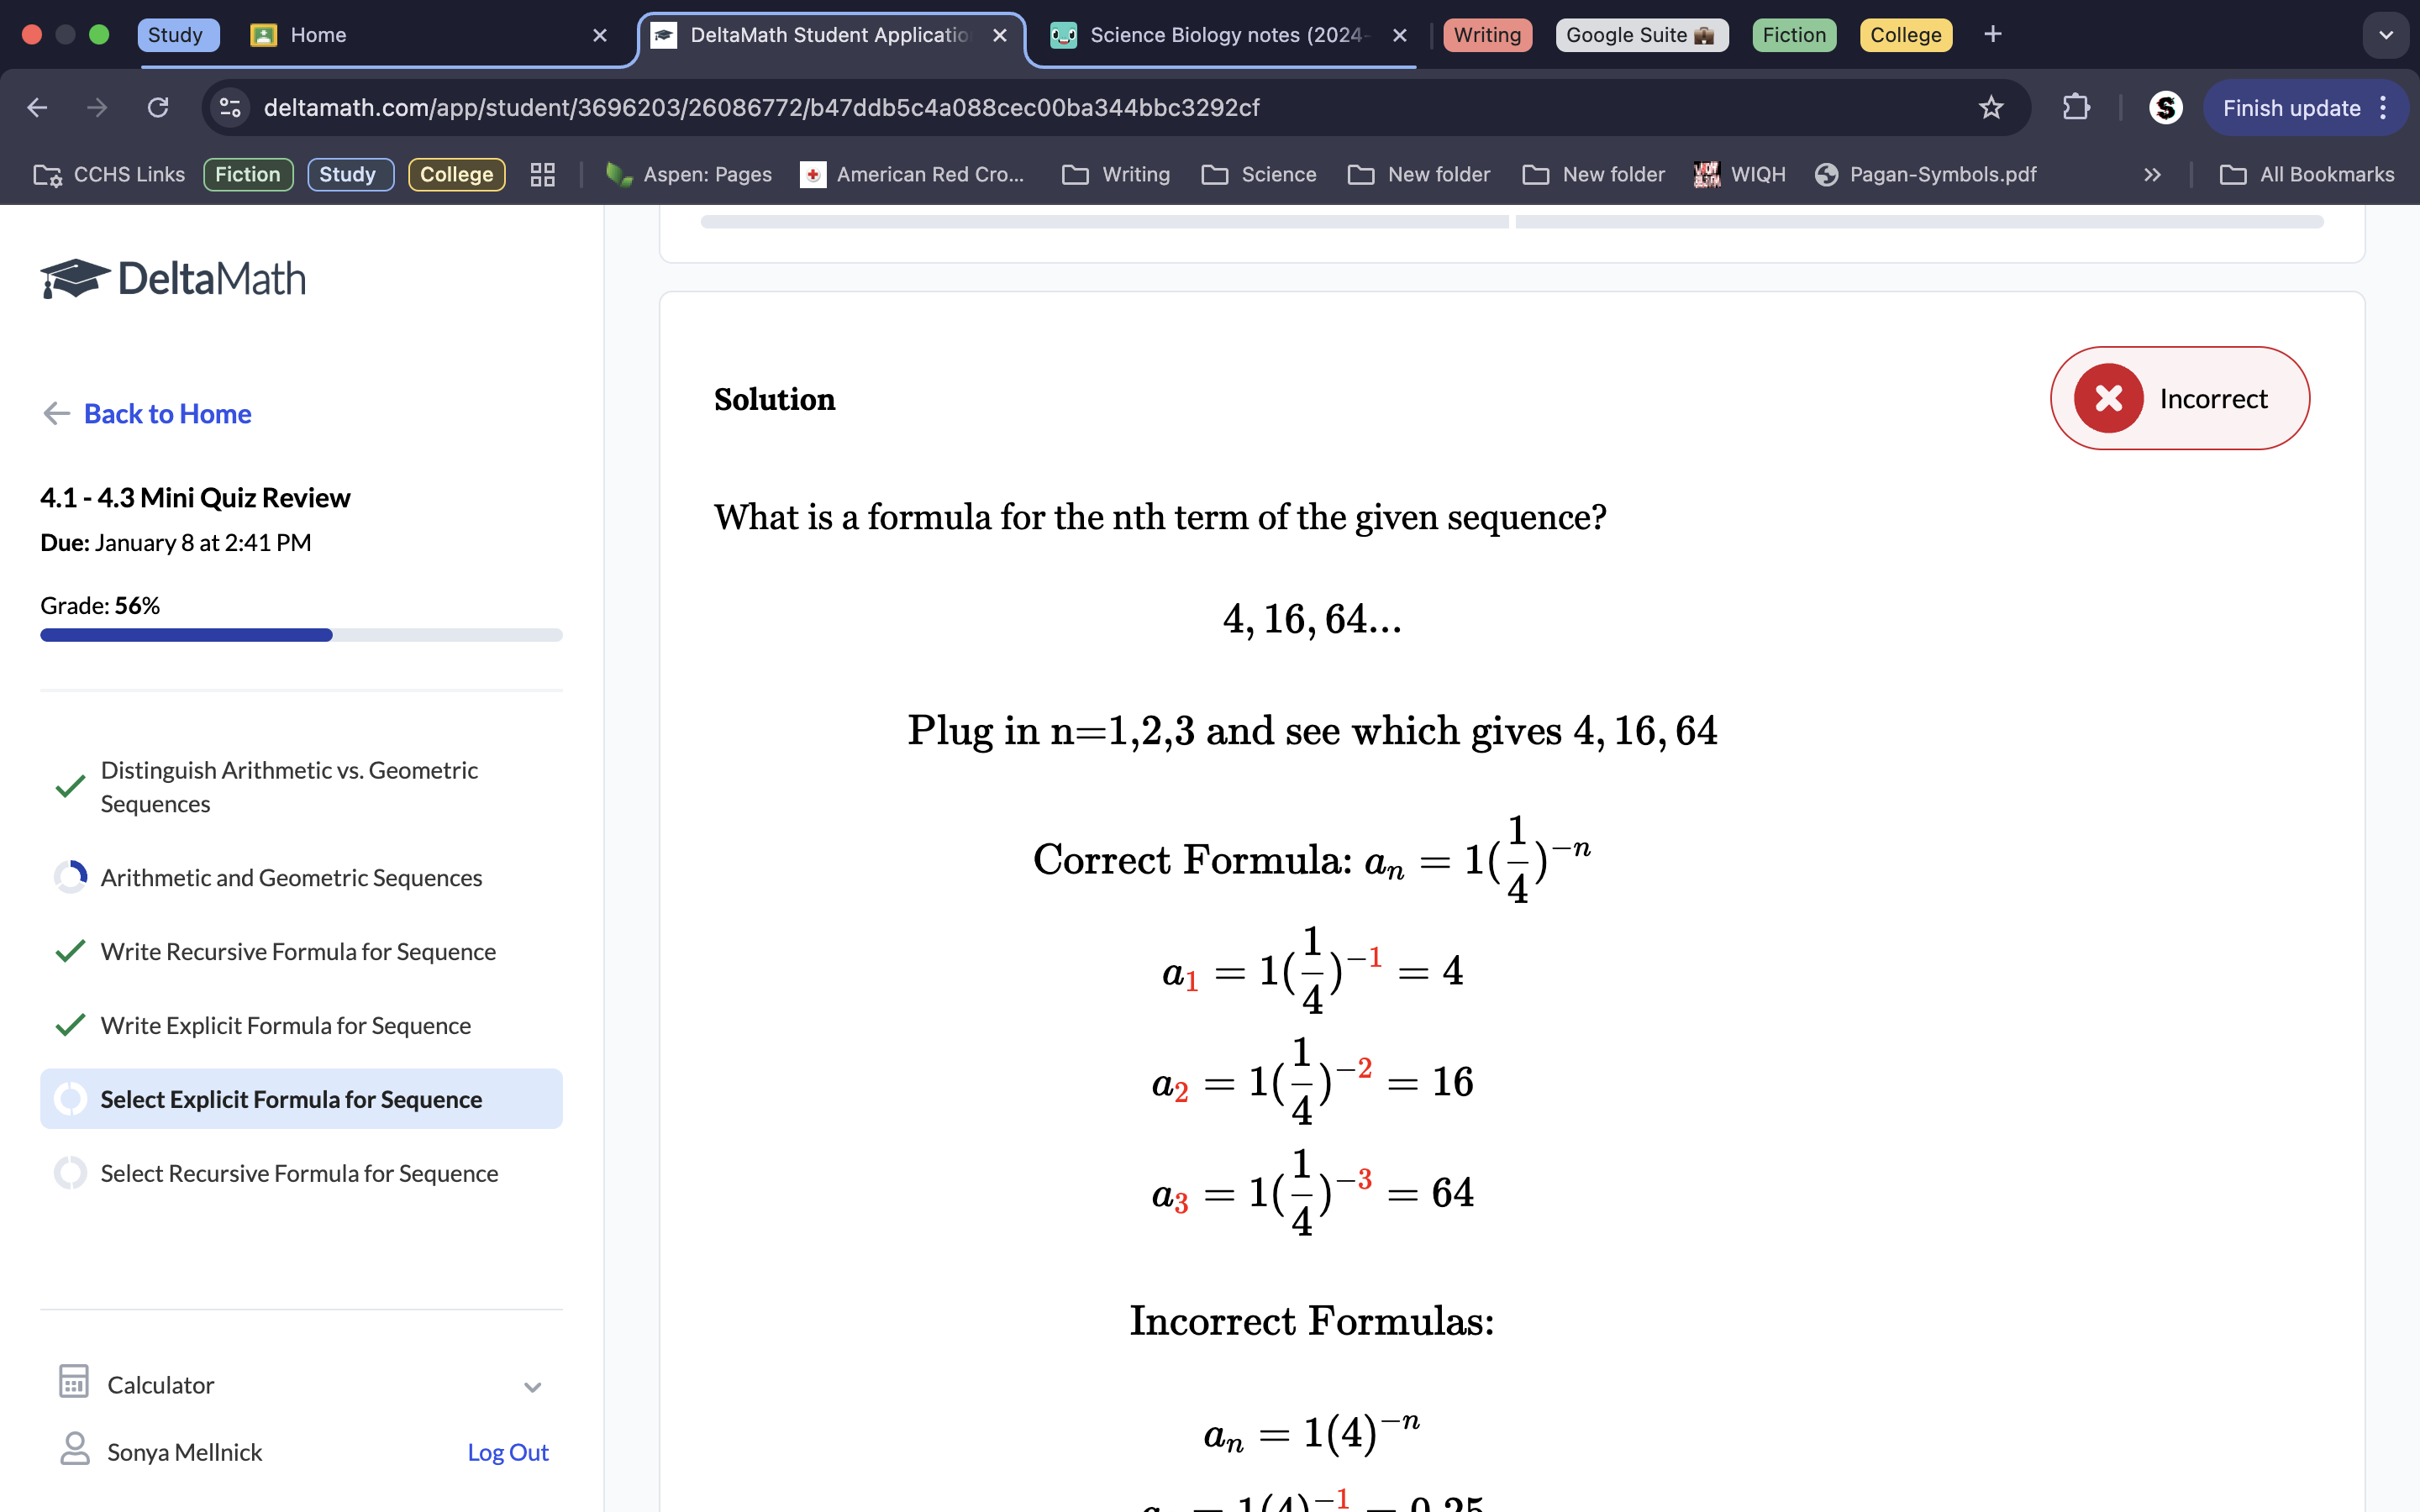
4. To find the formula for the given sequence, we have to plug the term numbers into the explicit formula equations, and conduct this on each equation until we find one that has an equal sum to the respective term numbers. If we plug 1 in for n on the given formula of a1= 1(1/4)n we get 4, 2 in for n we get 16, and 3 in for n we get 64, which are all the sums equal to their term values, thus a1=1(1/4)n is the correct explicit formula. Plug in the expected equations, and solve for the equalities.
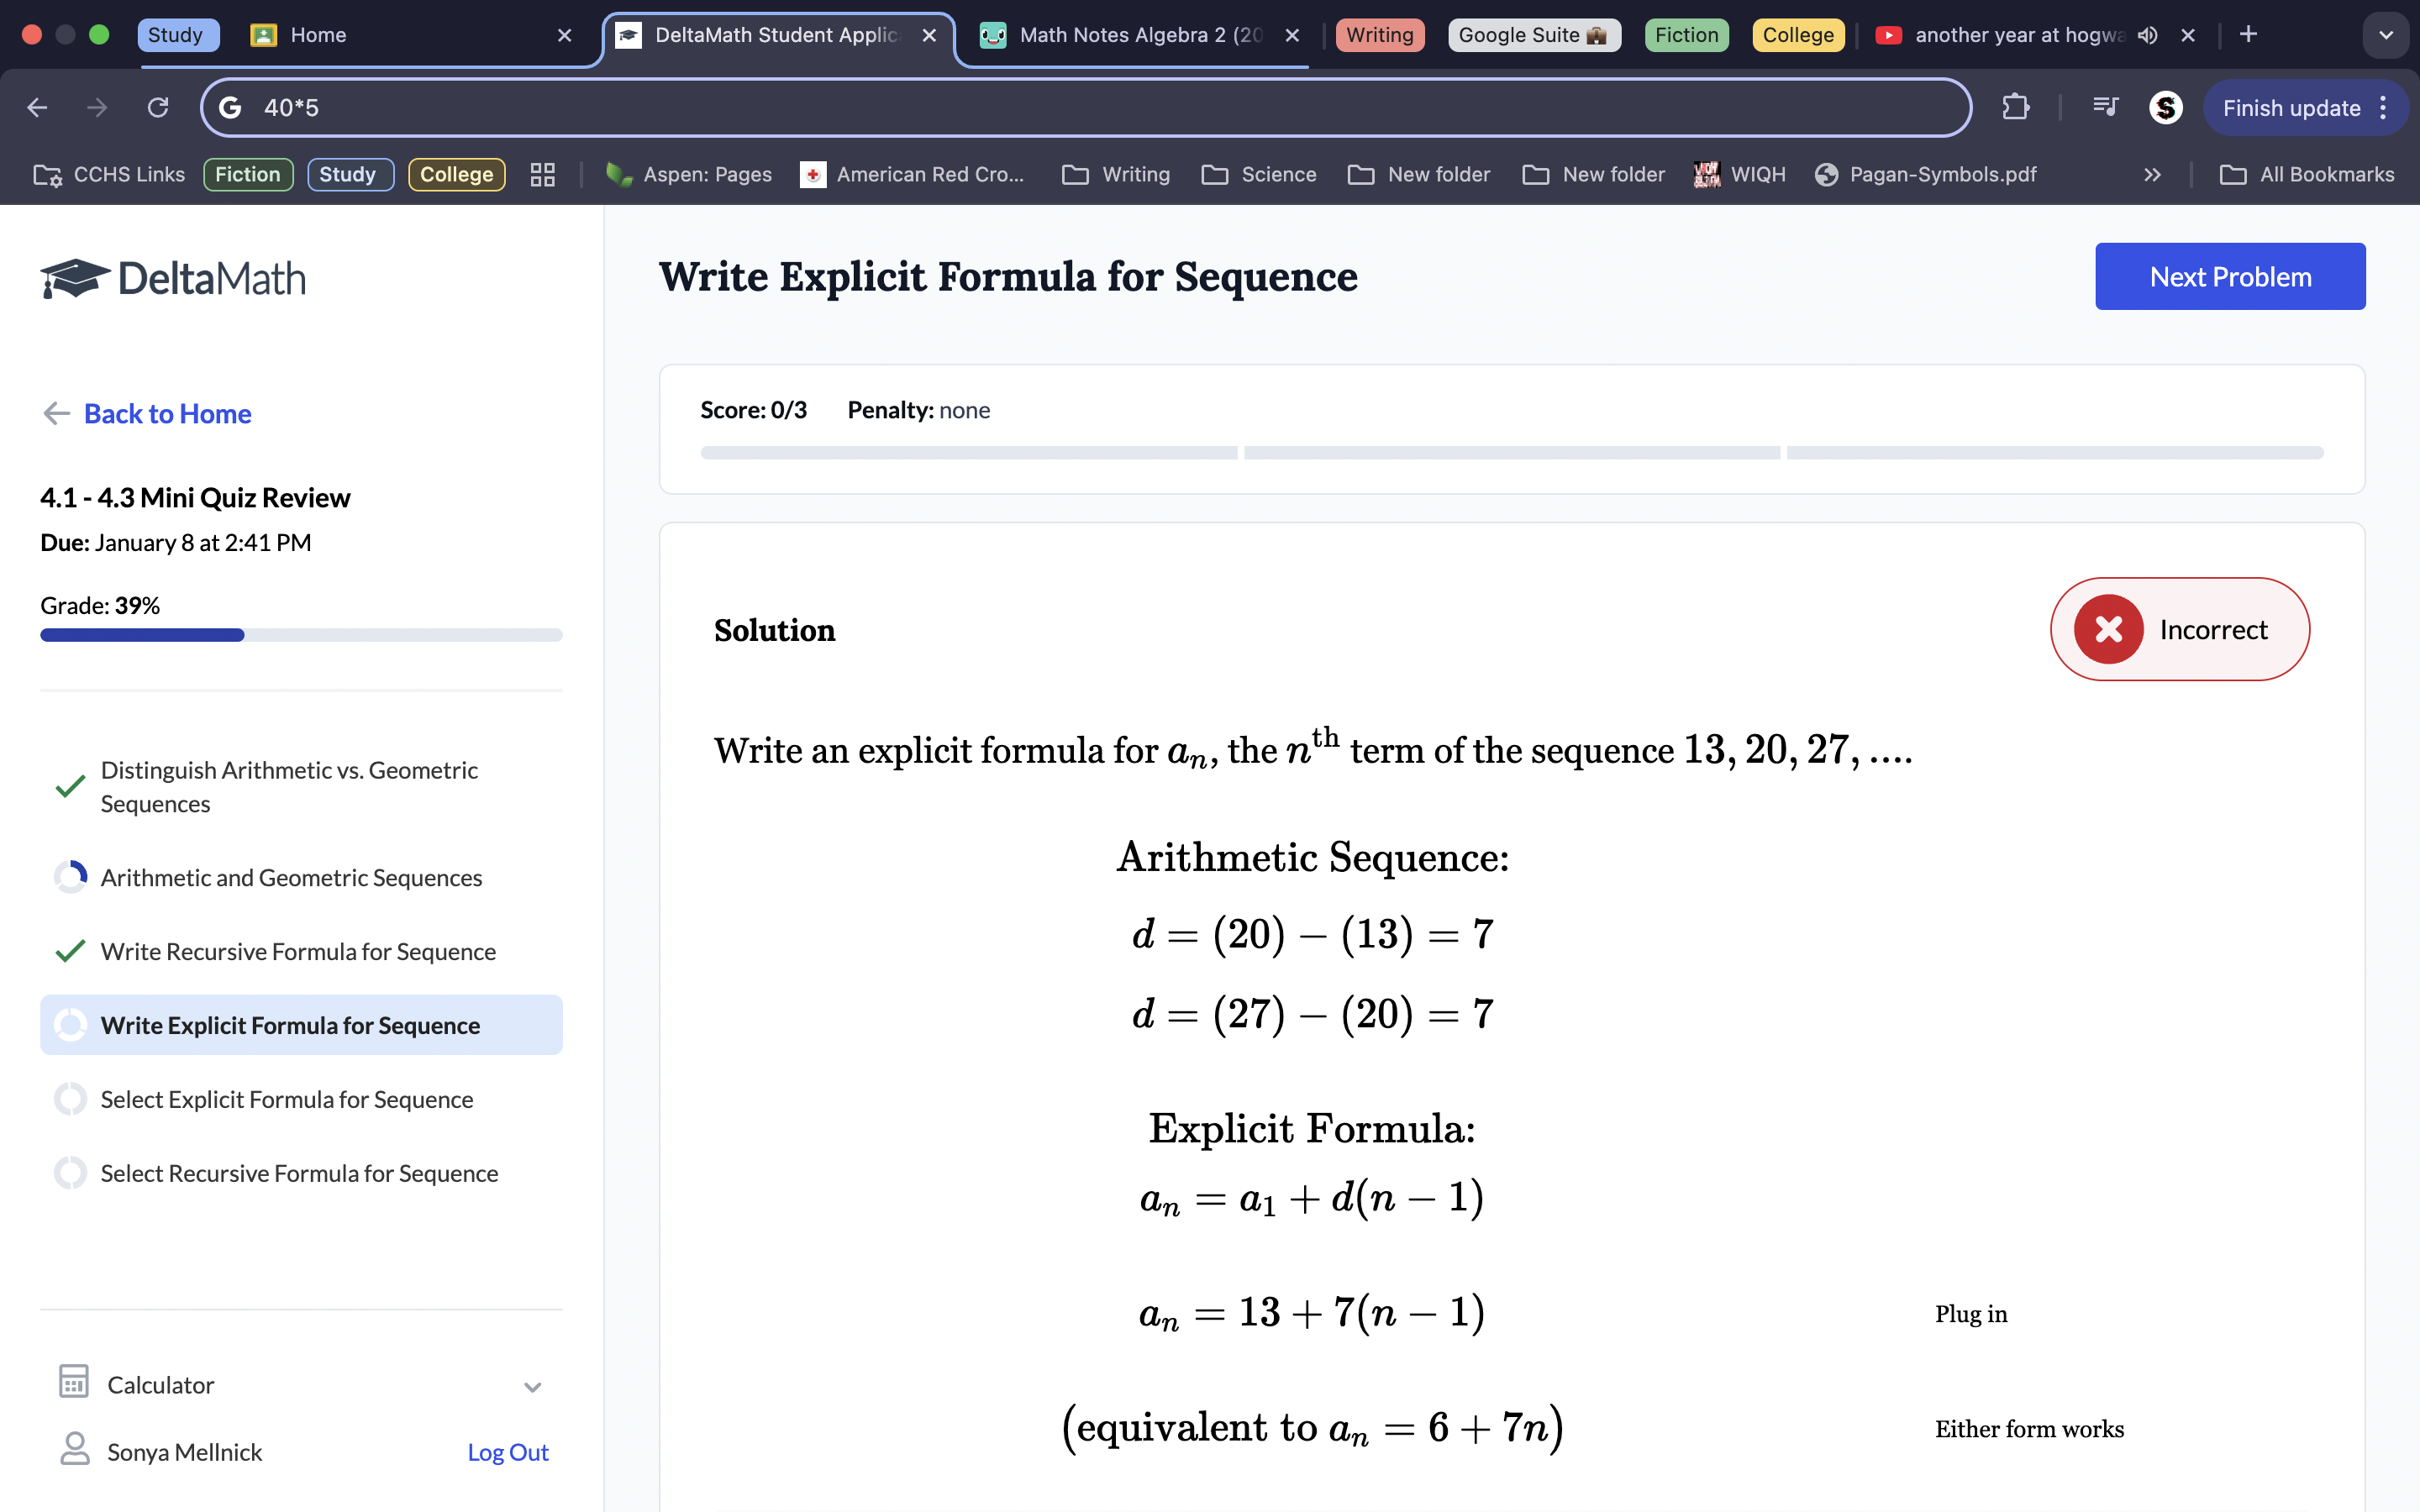
5. Because 27-20 and 20-13 are both 7, we know the common difference is 7. The explicit formula for arithmetic sequences is a1= a1 + d (n-1), so since we are solving for the nth term, we leave n as a variable, but we know the first term (13) and the common difference we plug those in to the explicit formula to get a final formula of a1=13+7(n-1). Remember that despite the fact we are subtracting, the sum and common difference still totals to 7 (positive) so we plug 7 into the equation with a +.
6. Because both 75/45 and 45/27 equals 5/3, that is our common ratio. We are trying to find the 6th term, so if we plug in the first term, the common ratio, and the term number (6) into our equation of an=a1rn-1, we can solve for the term at it’s 6th point. Plug in variables. This gets an=27(5/3)6-1. Solve to get a final answer of 347.222.
Unit 3 Test: *Ask for answers back*
2) A system of two equations has no solution. Which of the following could be the other equation in the system?
9) Algebraically solve the following system of equation for the solutions. Show all of your work.
Midyear practice Exam
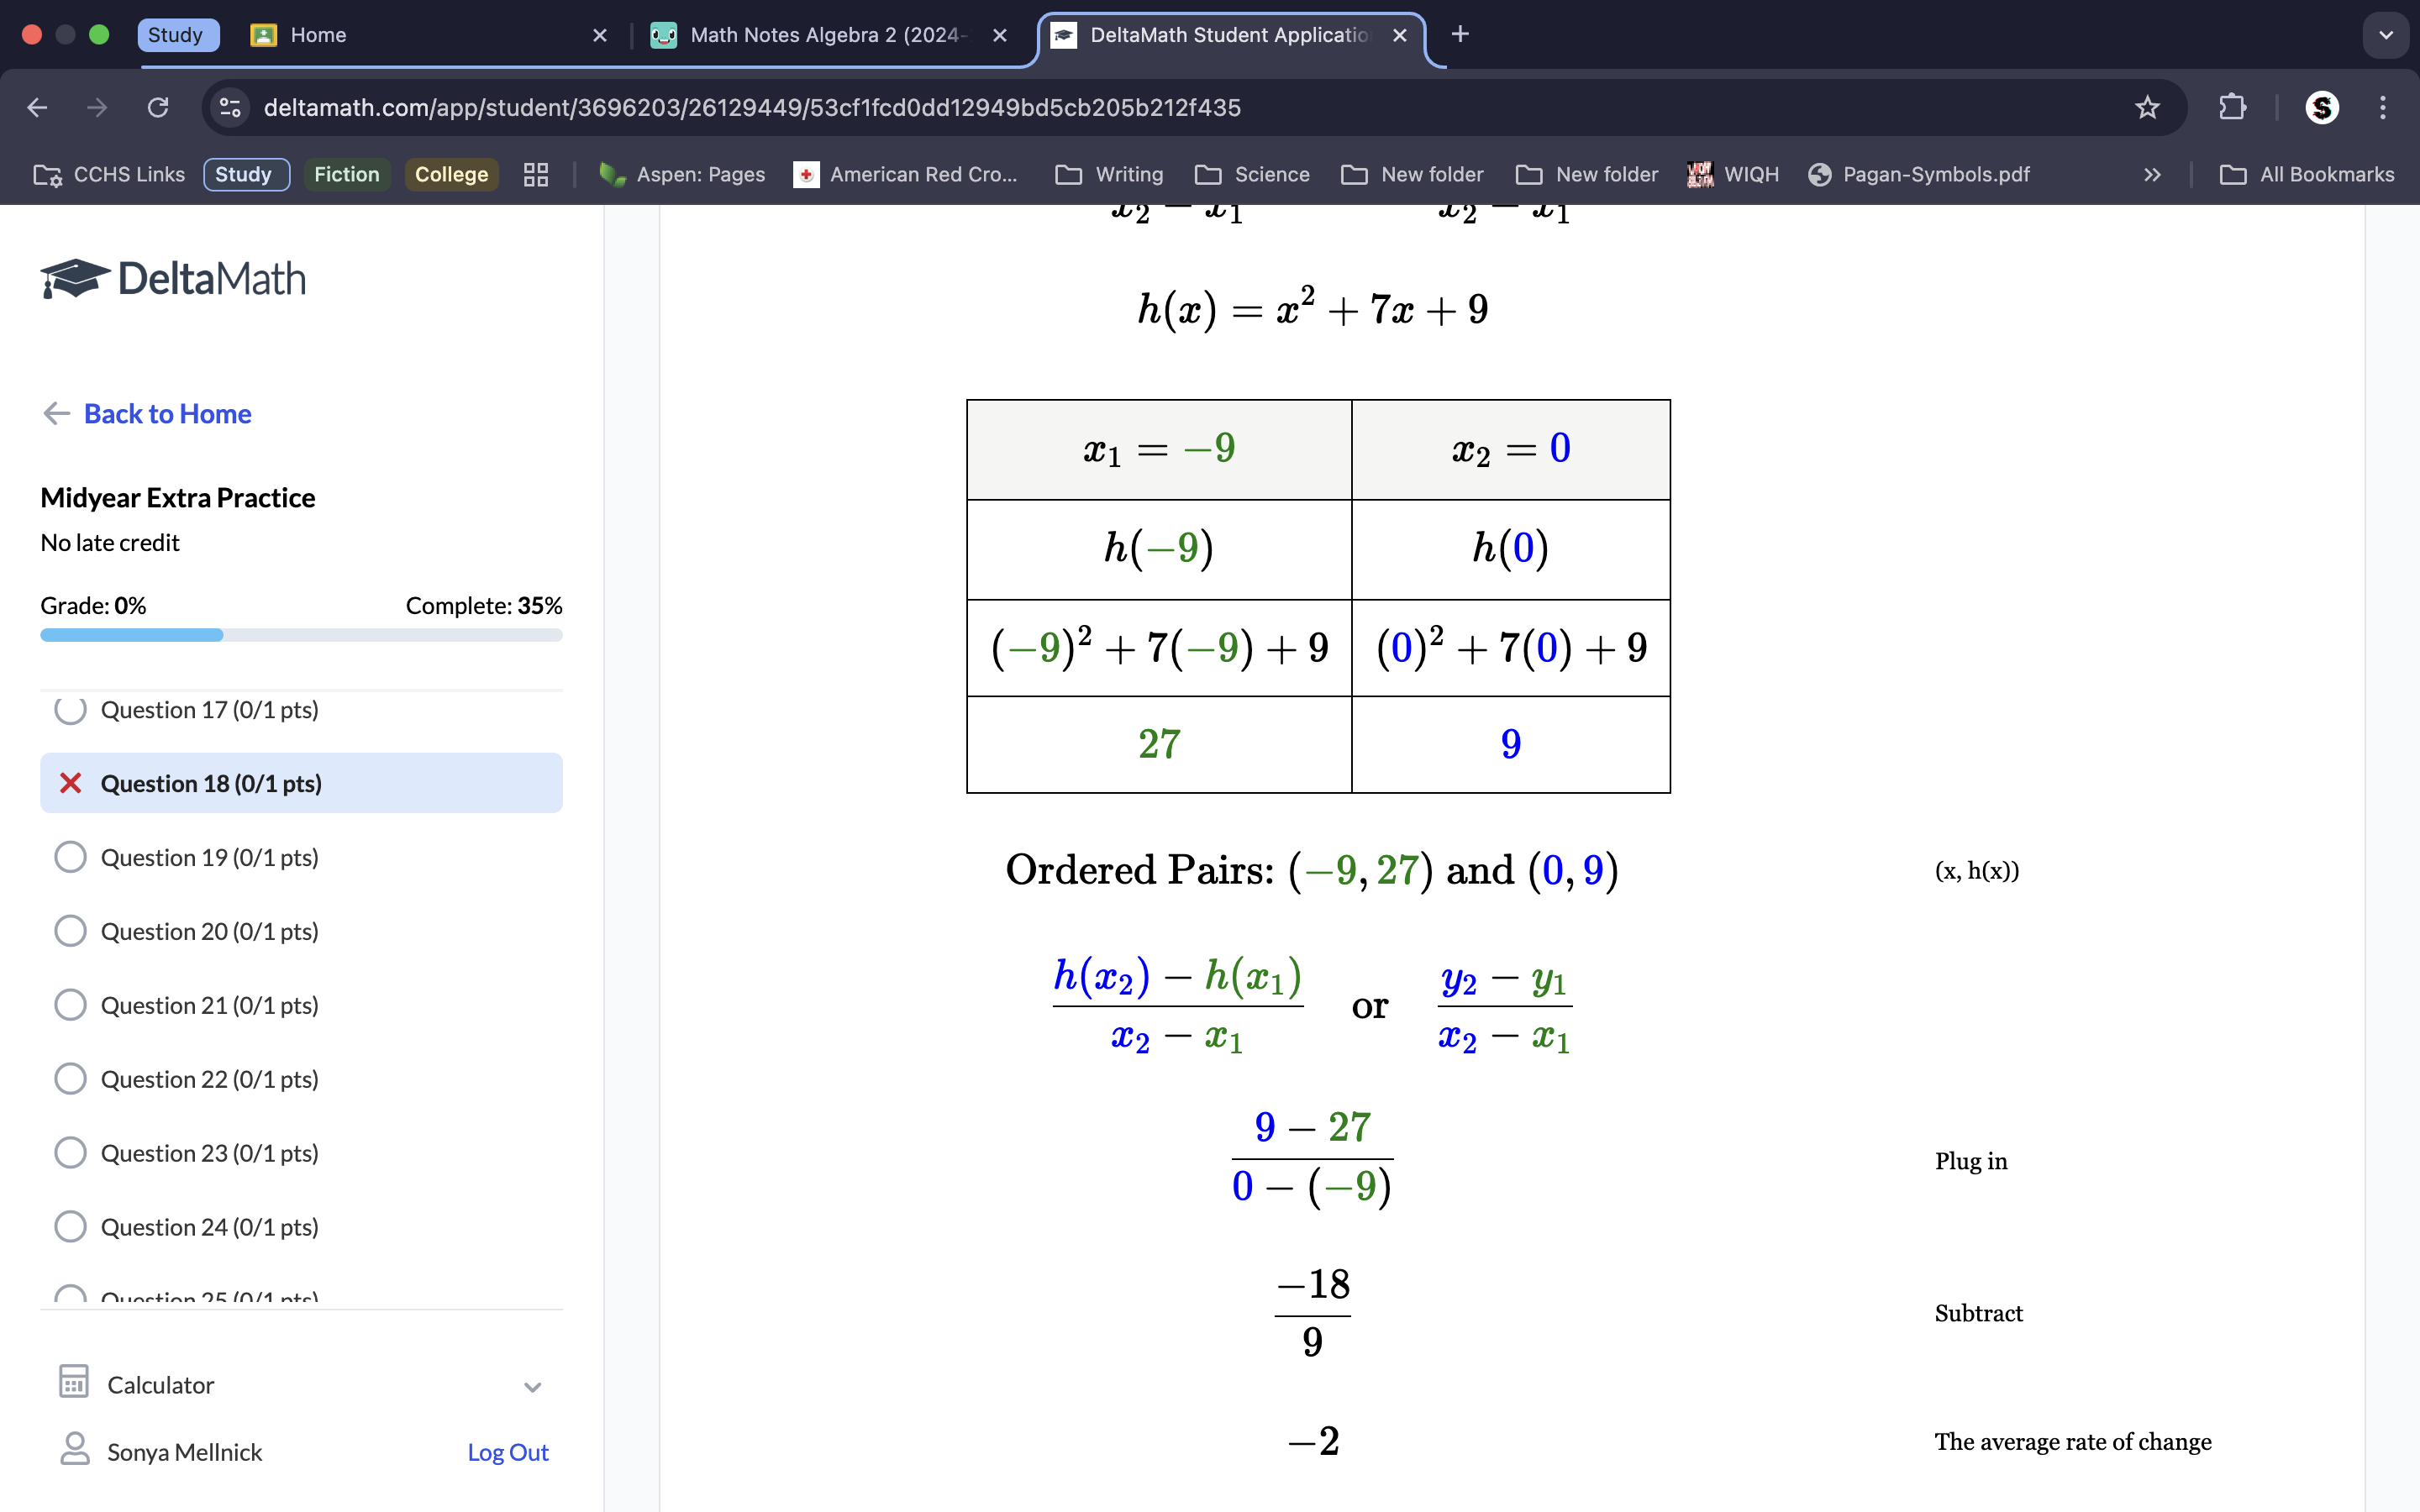
We get the average rate of change by subtracting the y values over the subtracted x values. The inequality gives us the x values already, so the bottom equation is 0—9. Always start from the larger x value. To get the y-value, plug the x values into the h(x) equation to get the corresponding y-values seperately. This gets y=9 and y=27. Thus the top equation is 9-27. Put over the bottom equation. 9-27/0+9. Combine. -18/9. Divide. -2. -2 is the average rate of change.
Because the points listed are not on a plotted point on the graph, they stay < and >, despite the fact the line is solid.
Because the line has solid plotted, distinct points, they are included on the graph so we plot so we use ≤ and ≥ notation.
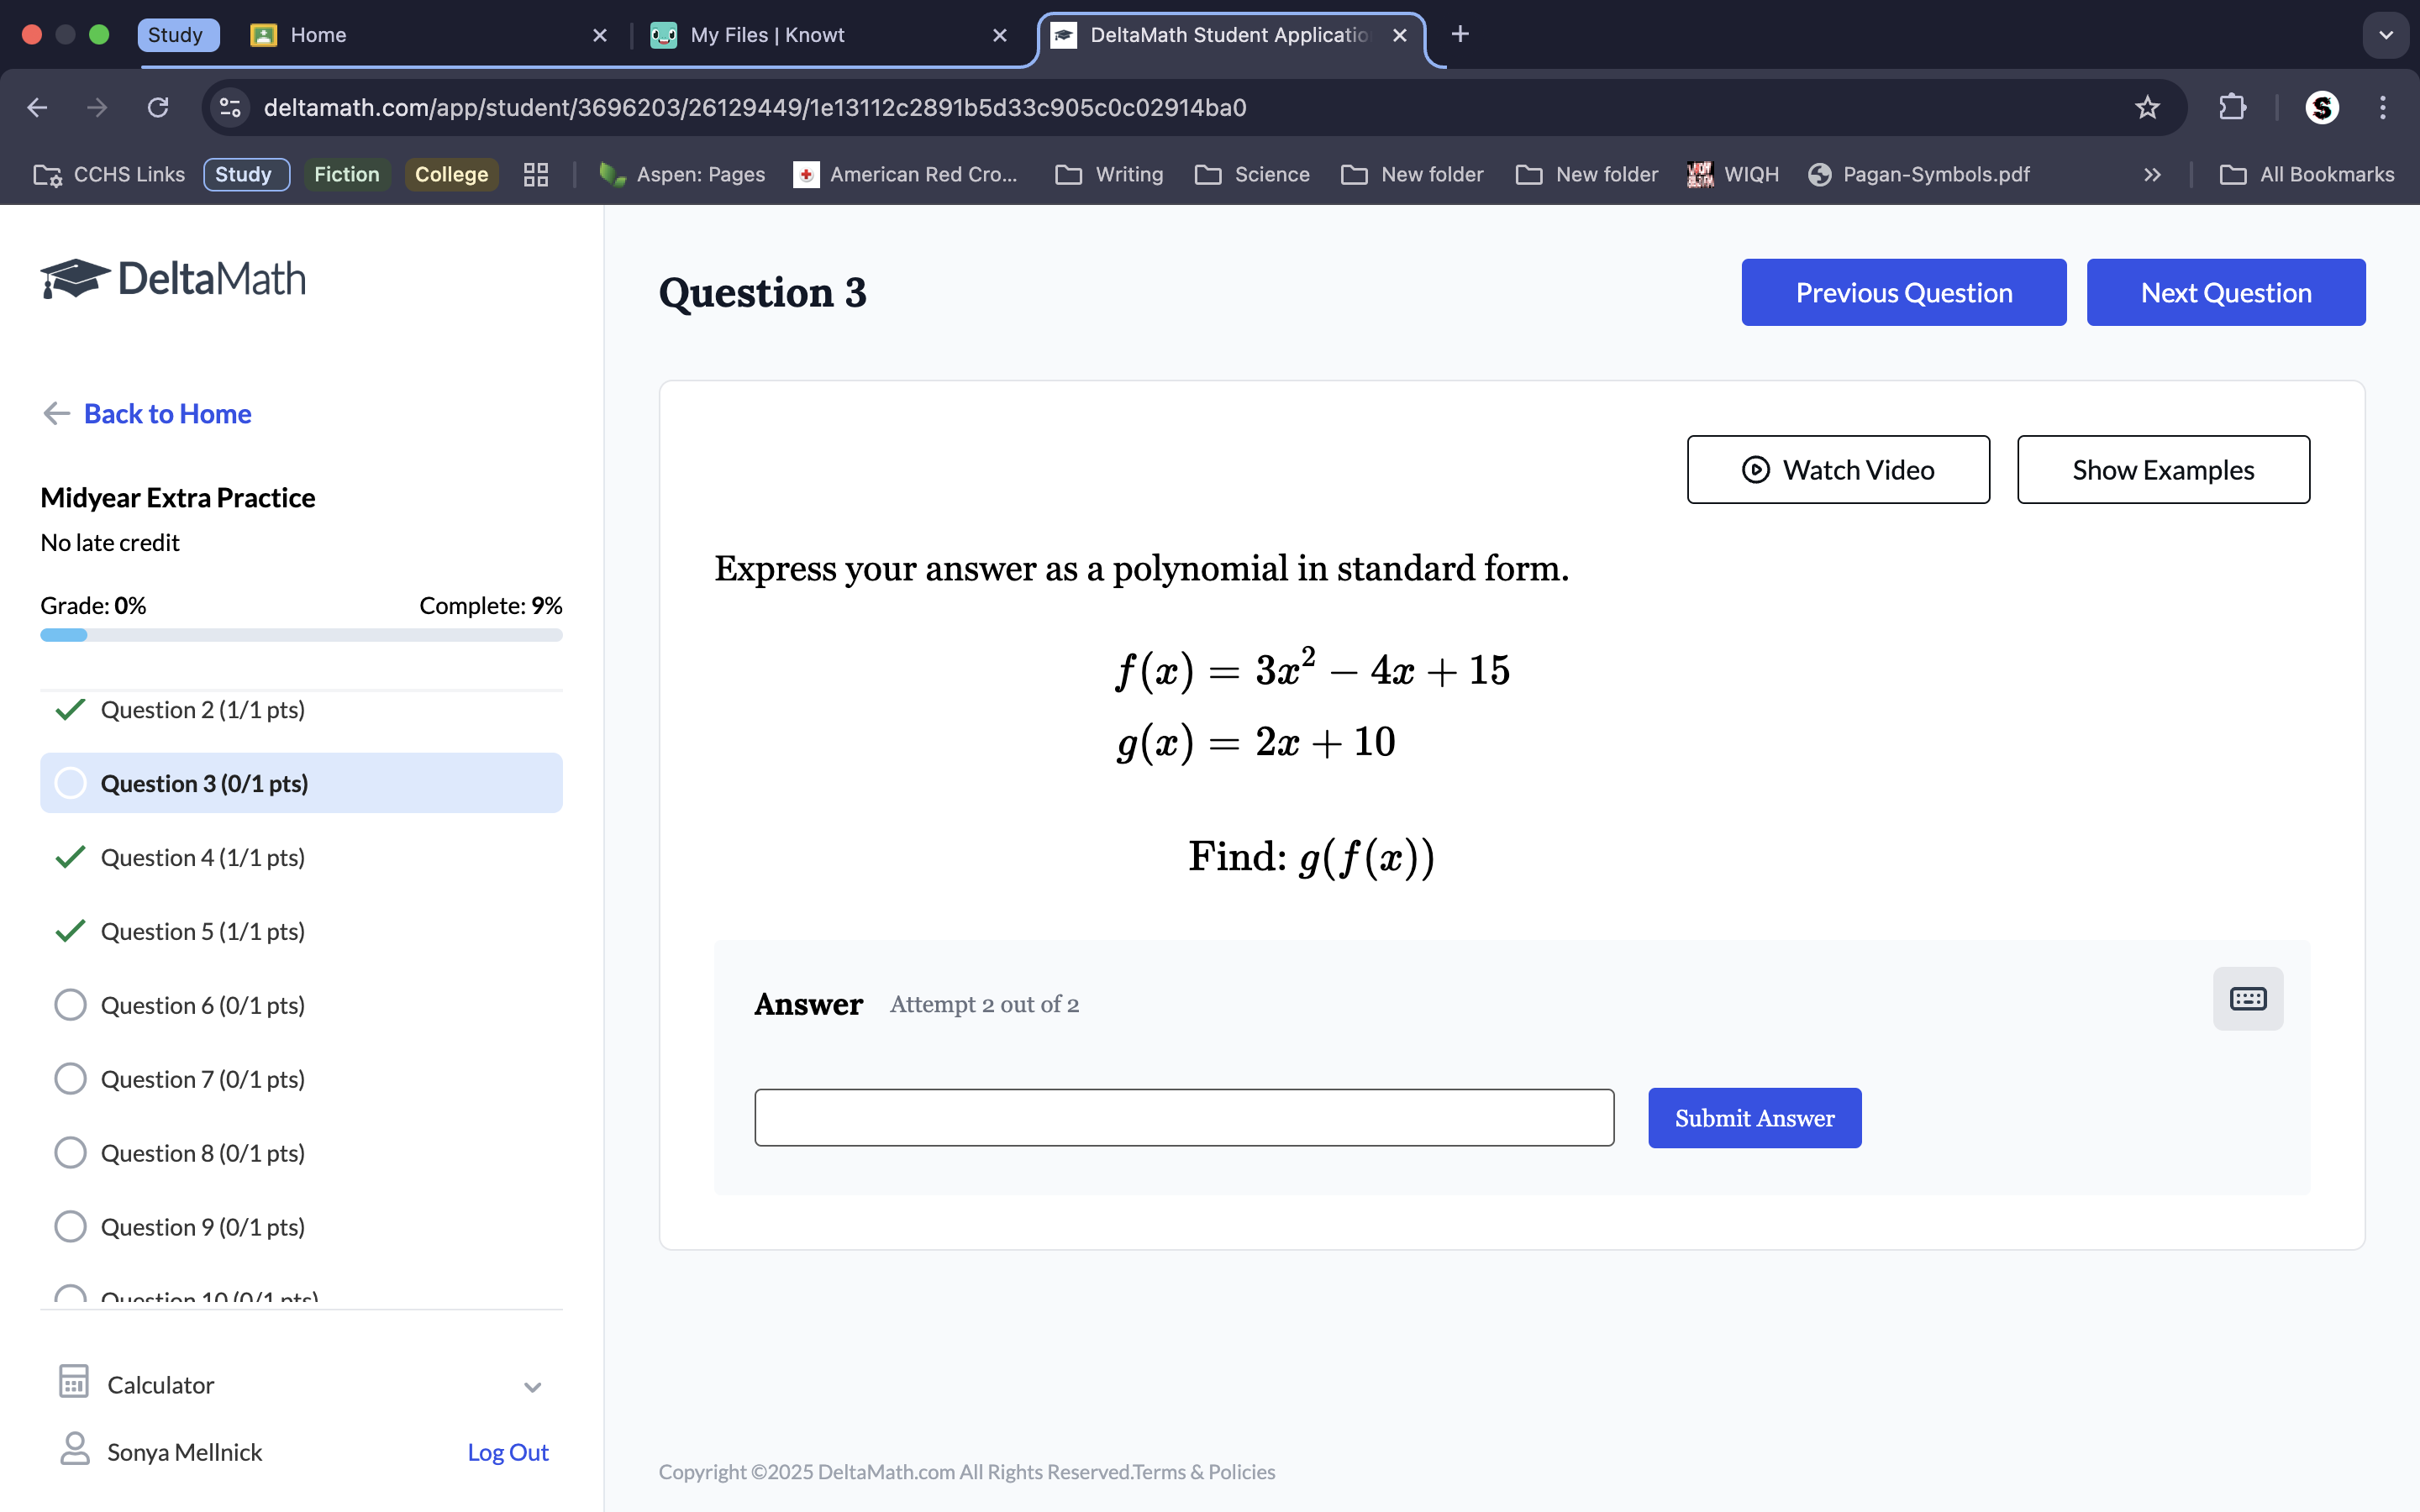
Pay attention to your negatives. To find g(f(x)), plug the equation of f(x) into the x variable of g(x). This gets 2(3×2-4x+15) +10. Distribute the 2 over the equations in (). Combine like terms and solve.
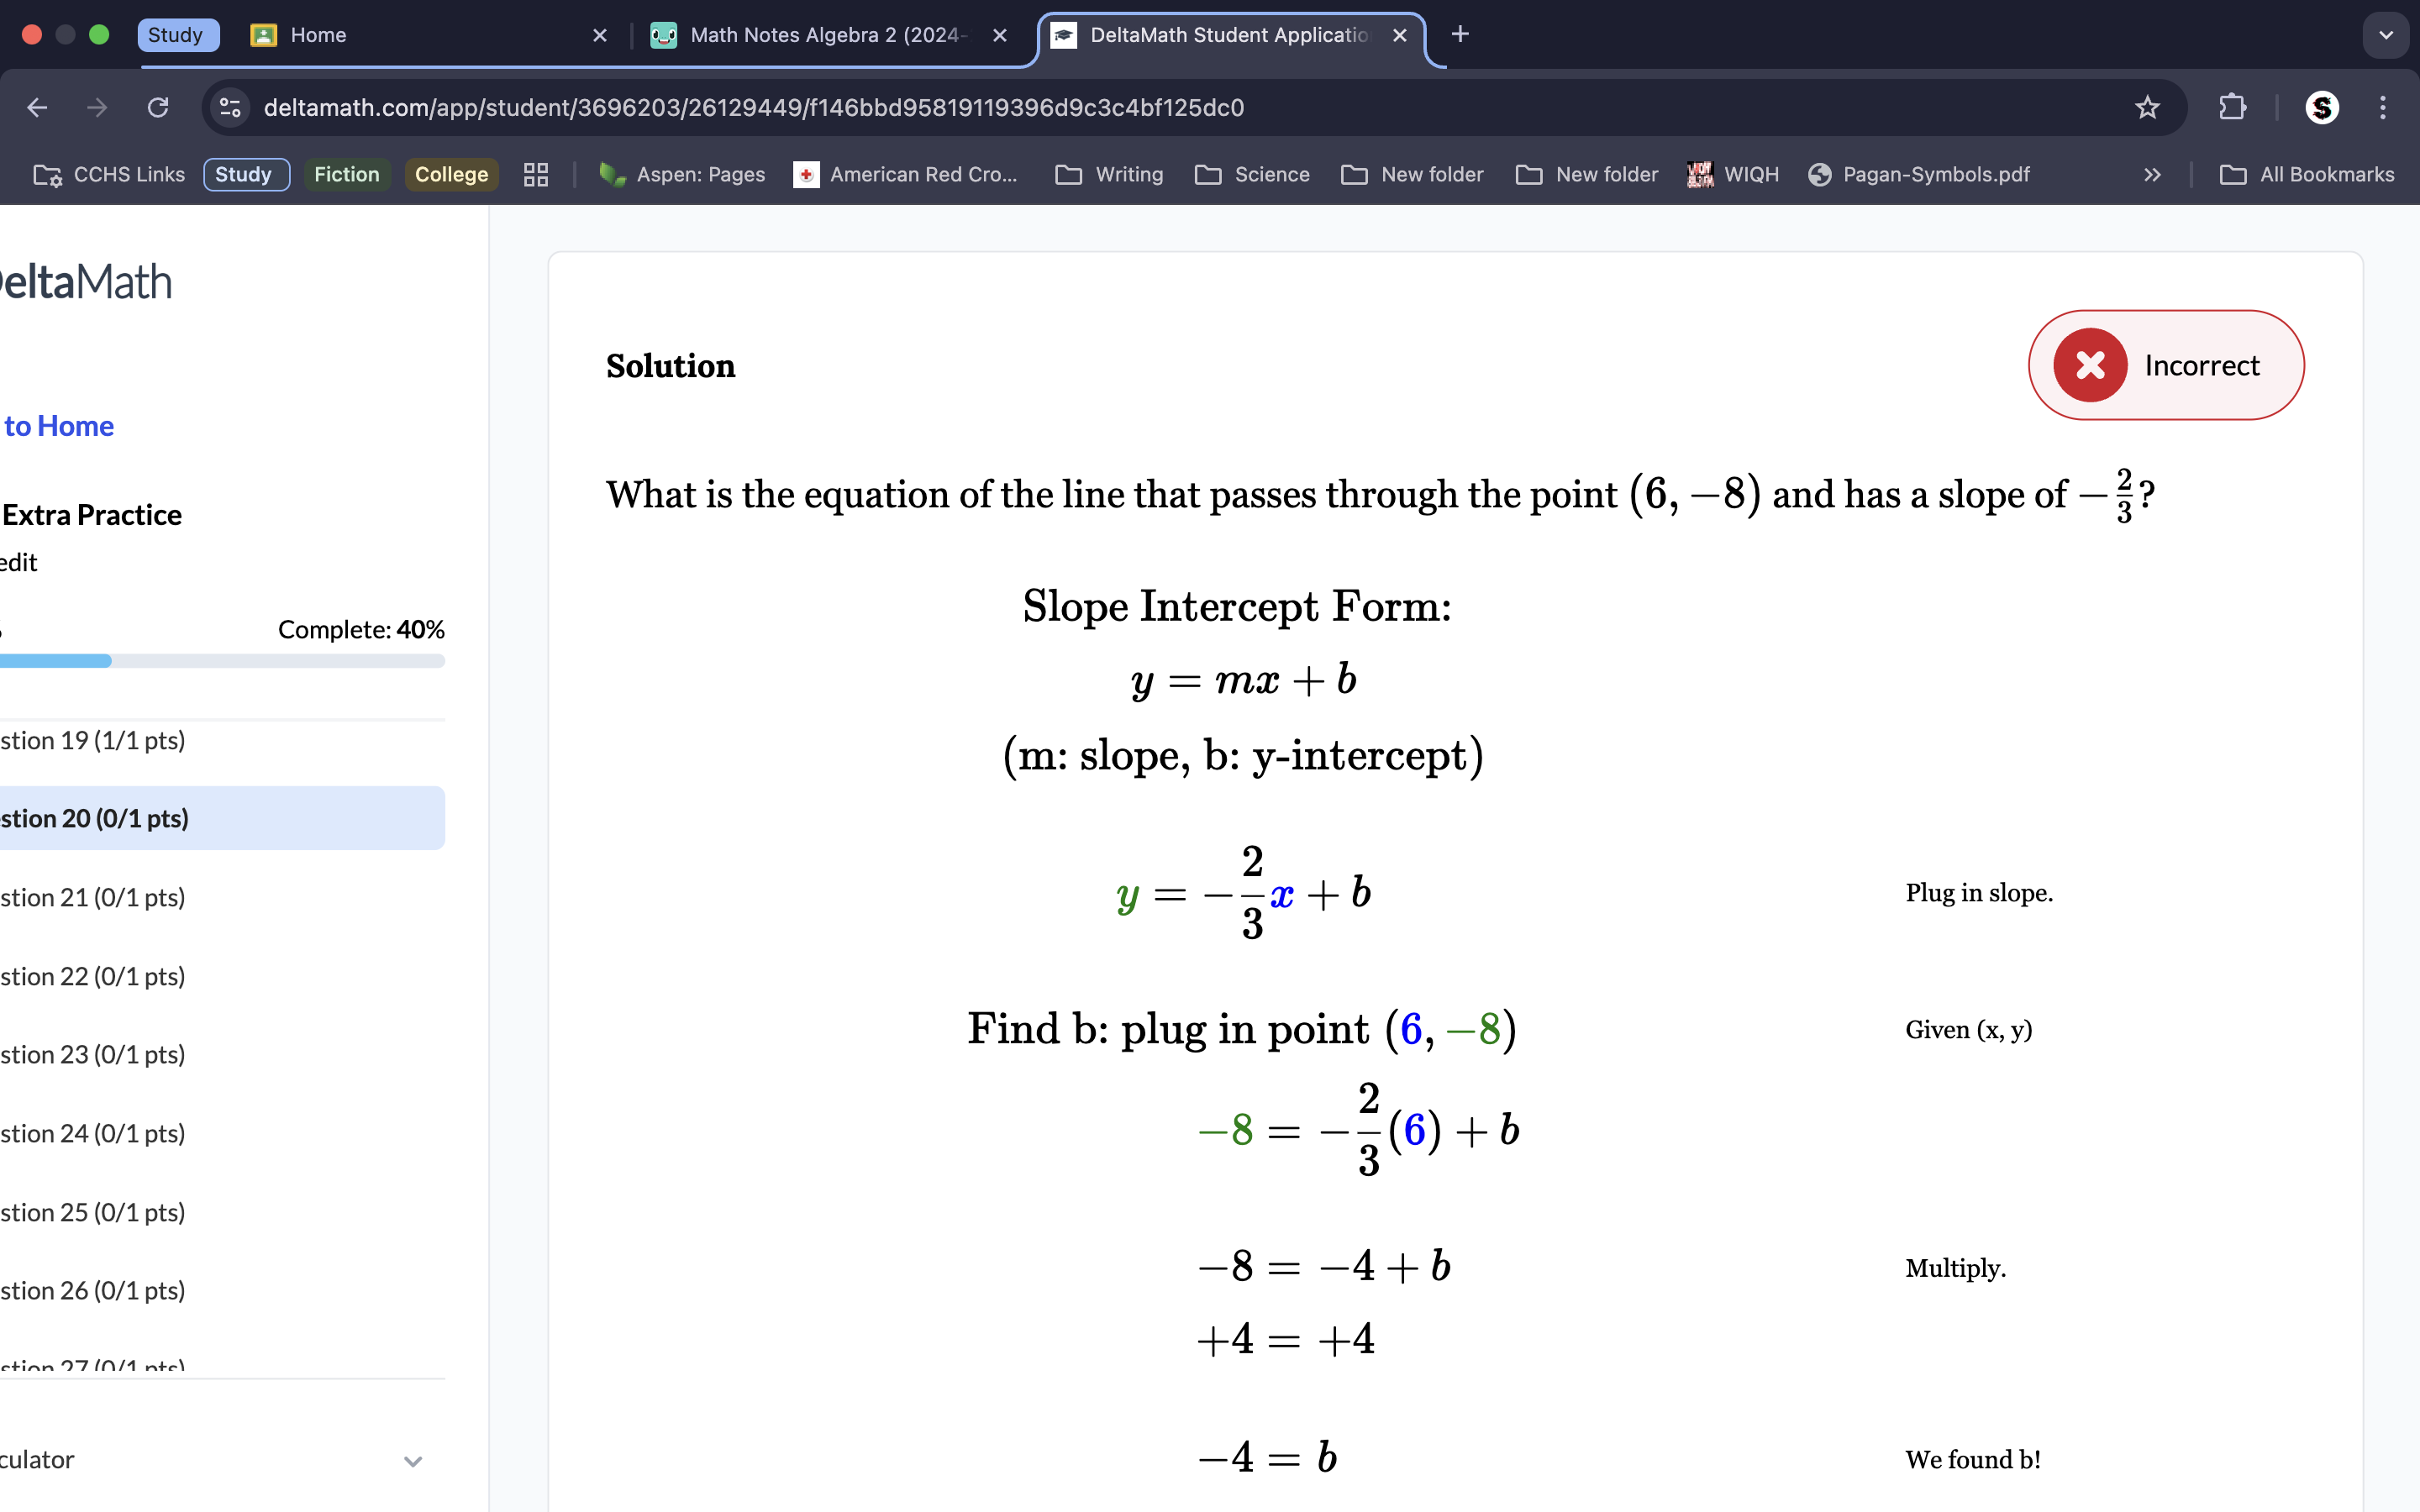
Start the equation immediately in slope-intercept form, and plug the slope in for m. Plug the y and x value in to find b and then put the value for b back into the original equation, making the equation of the line.
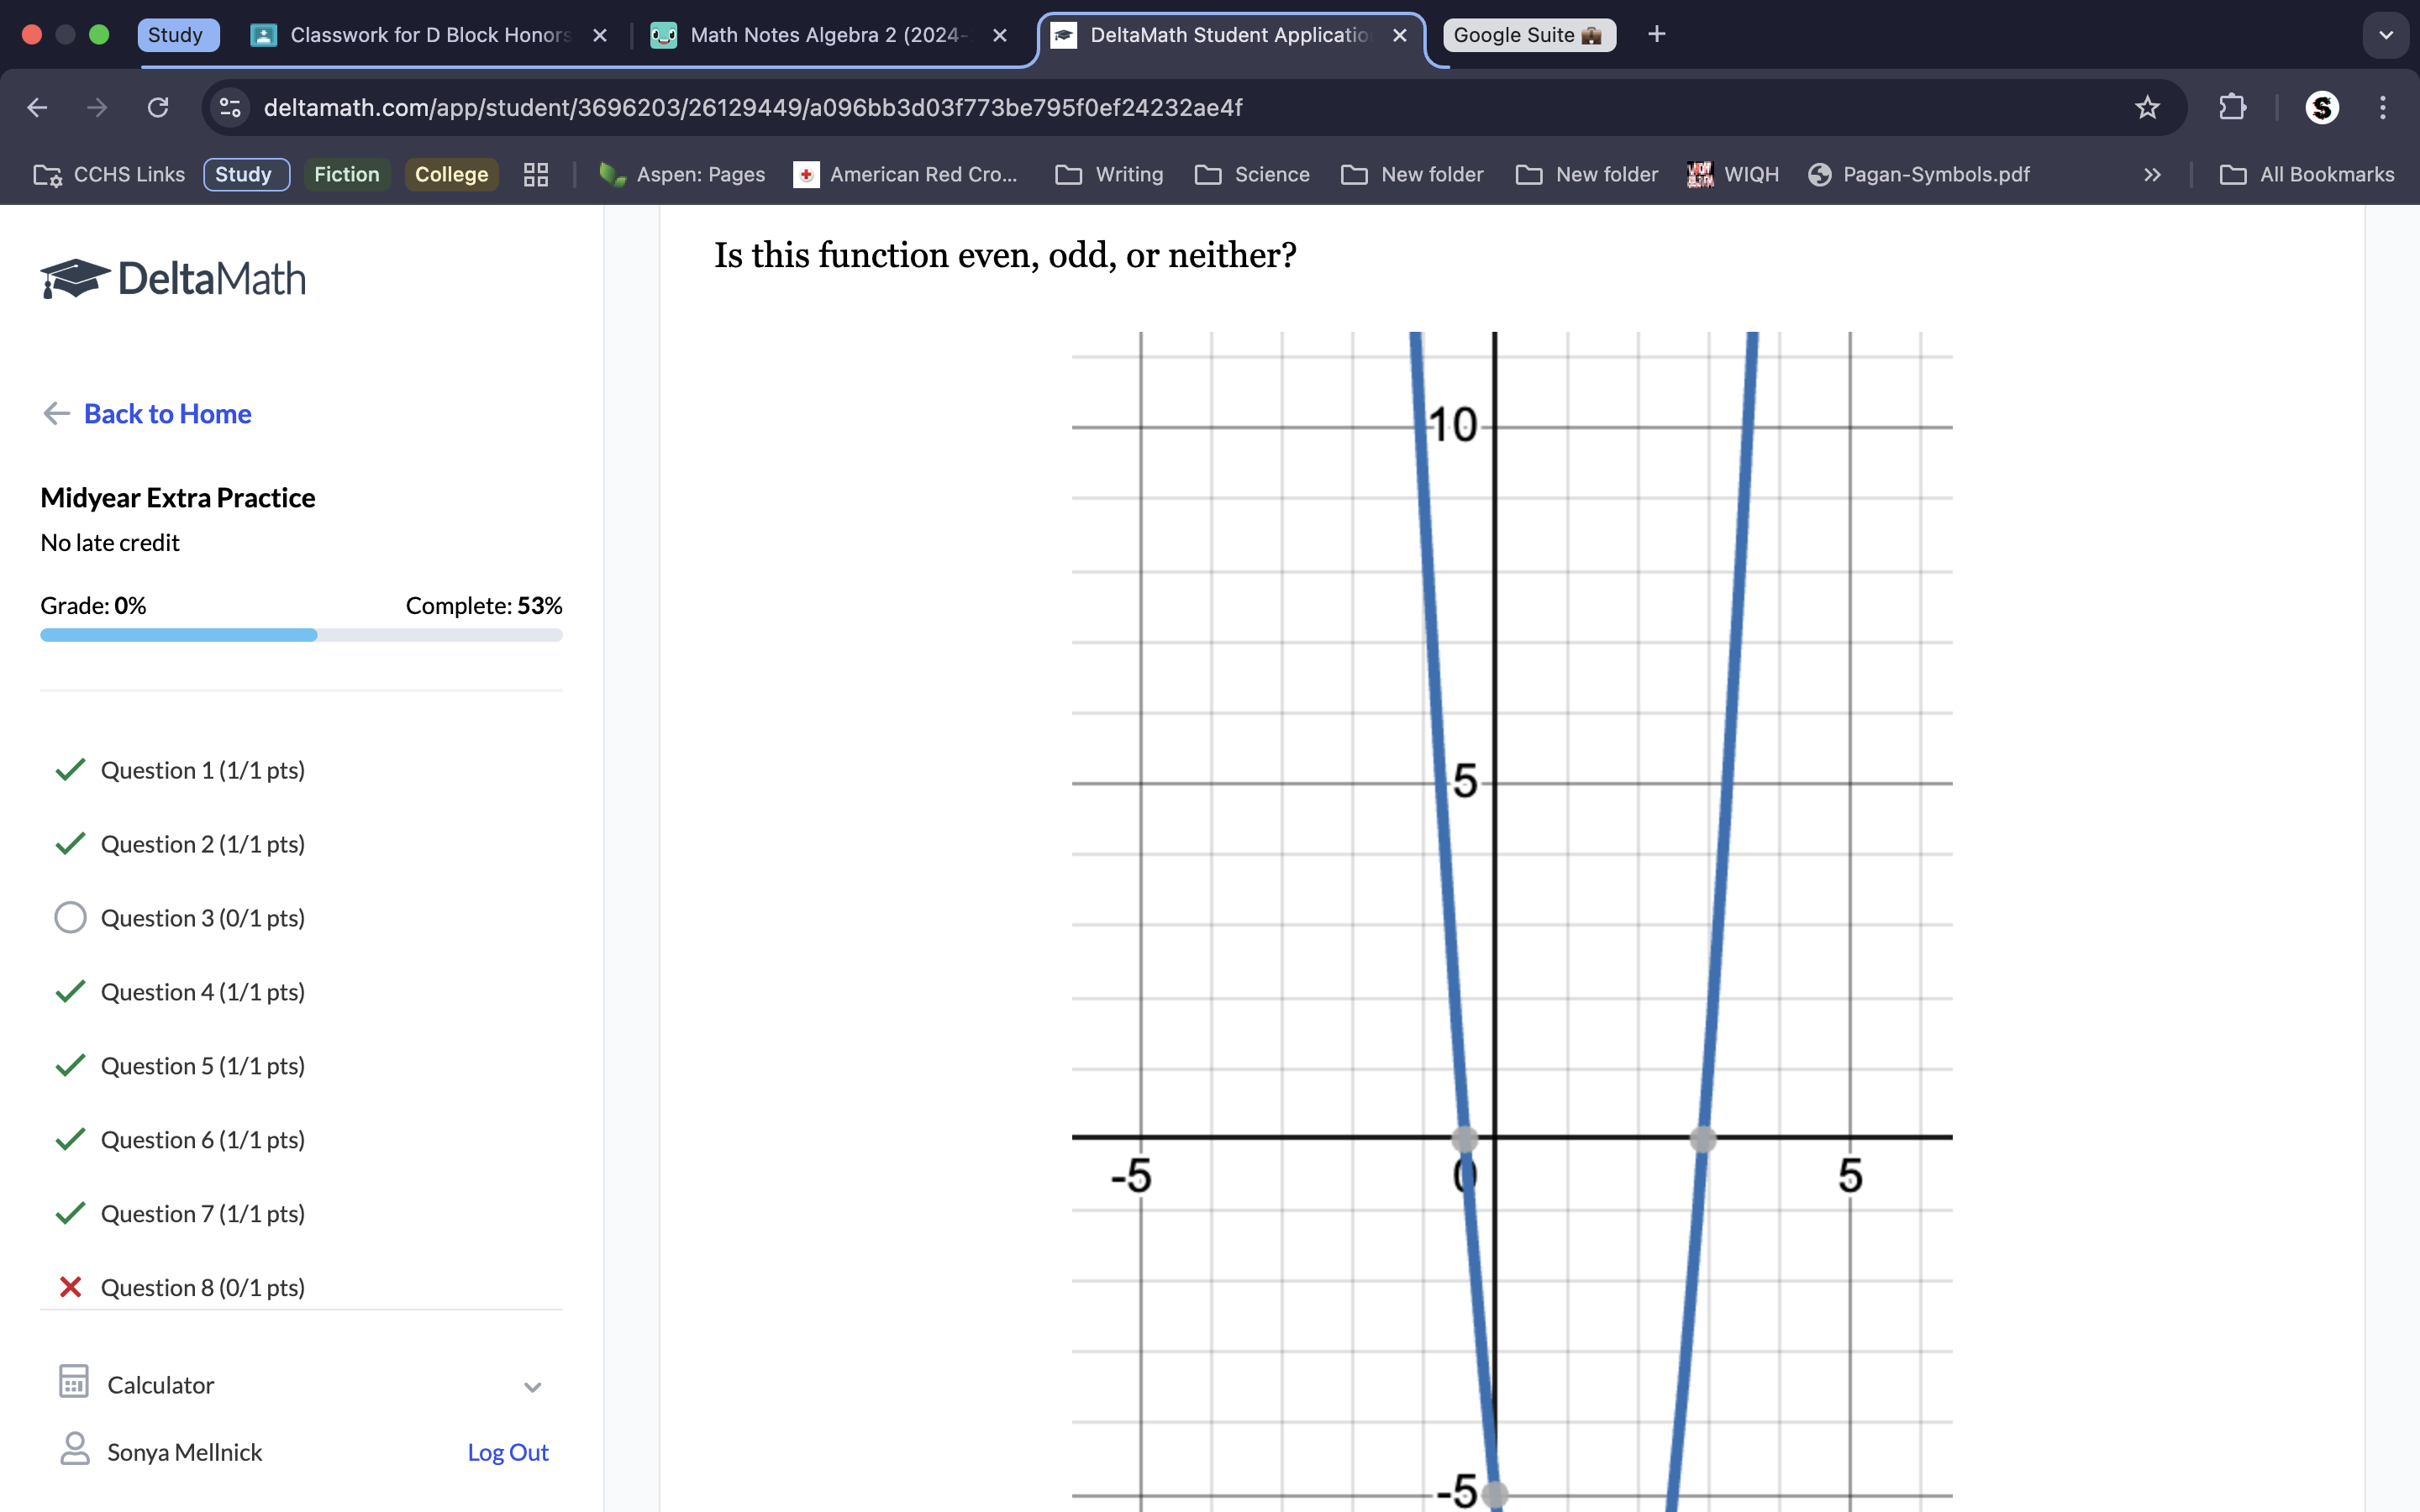
Even graphs must be at the origin, if it’s not at the origin or will reflect symmetry at 180˚ (or when reflected of the y-axis) it is neither.
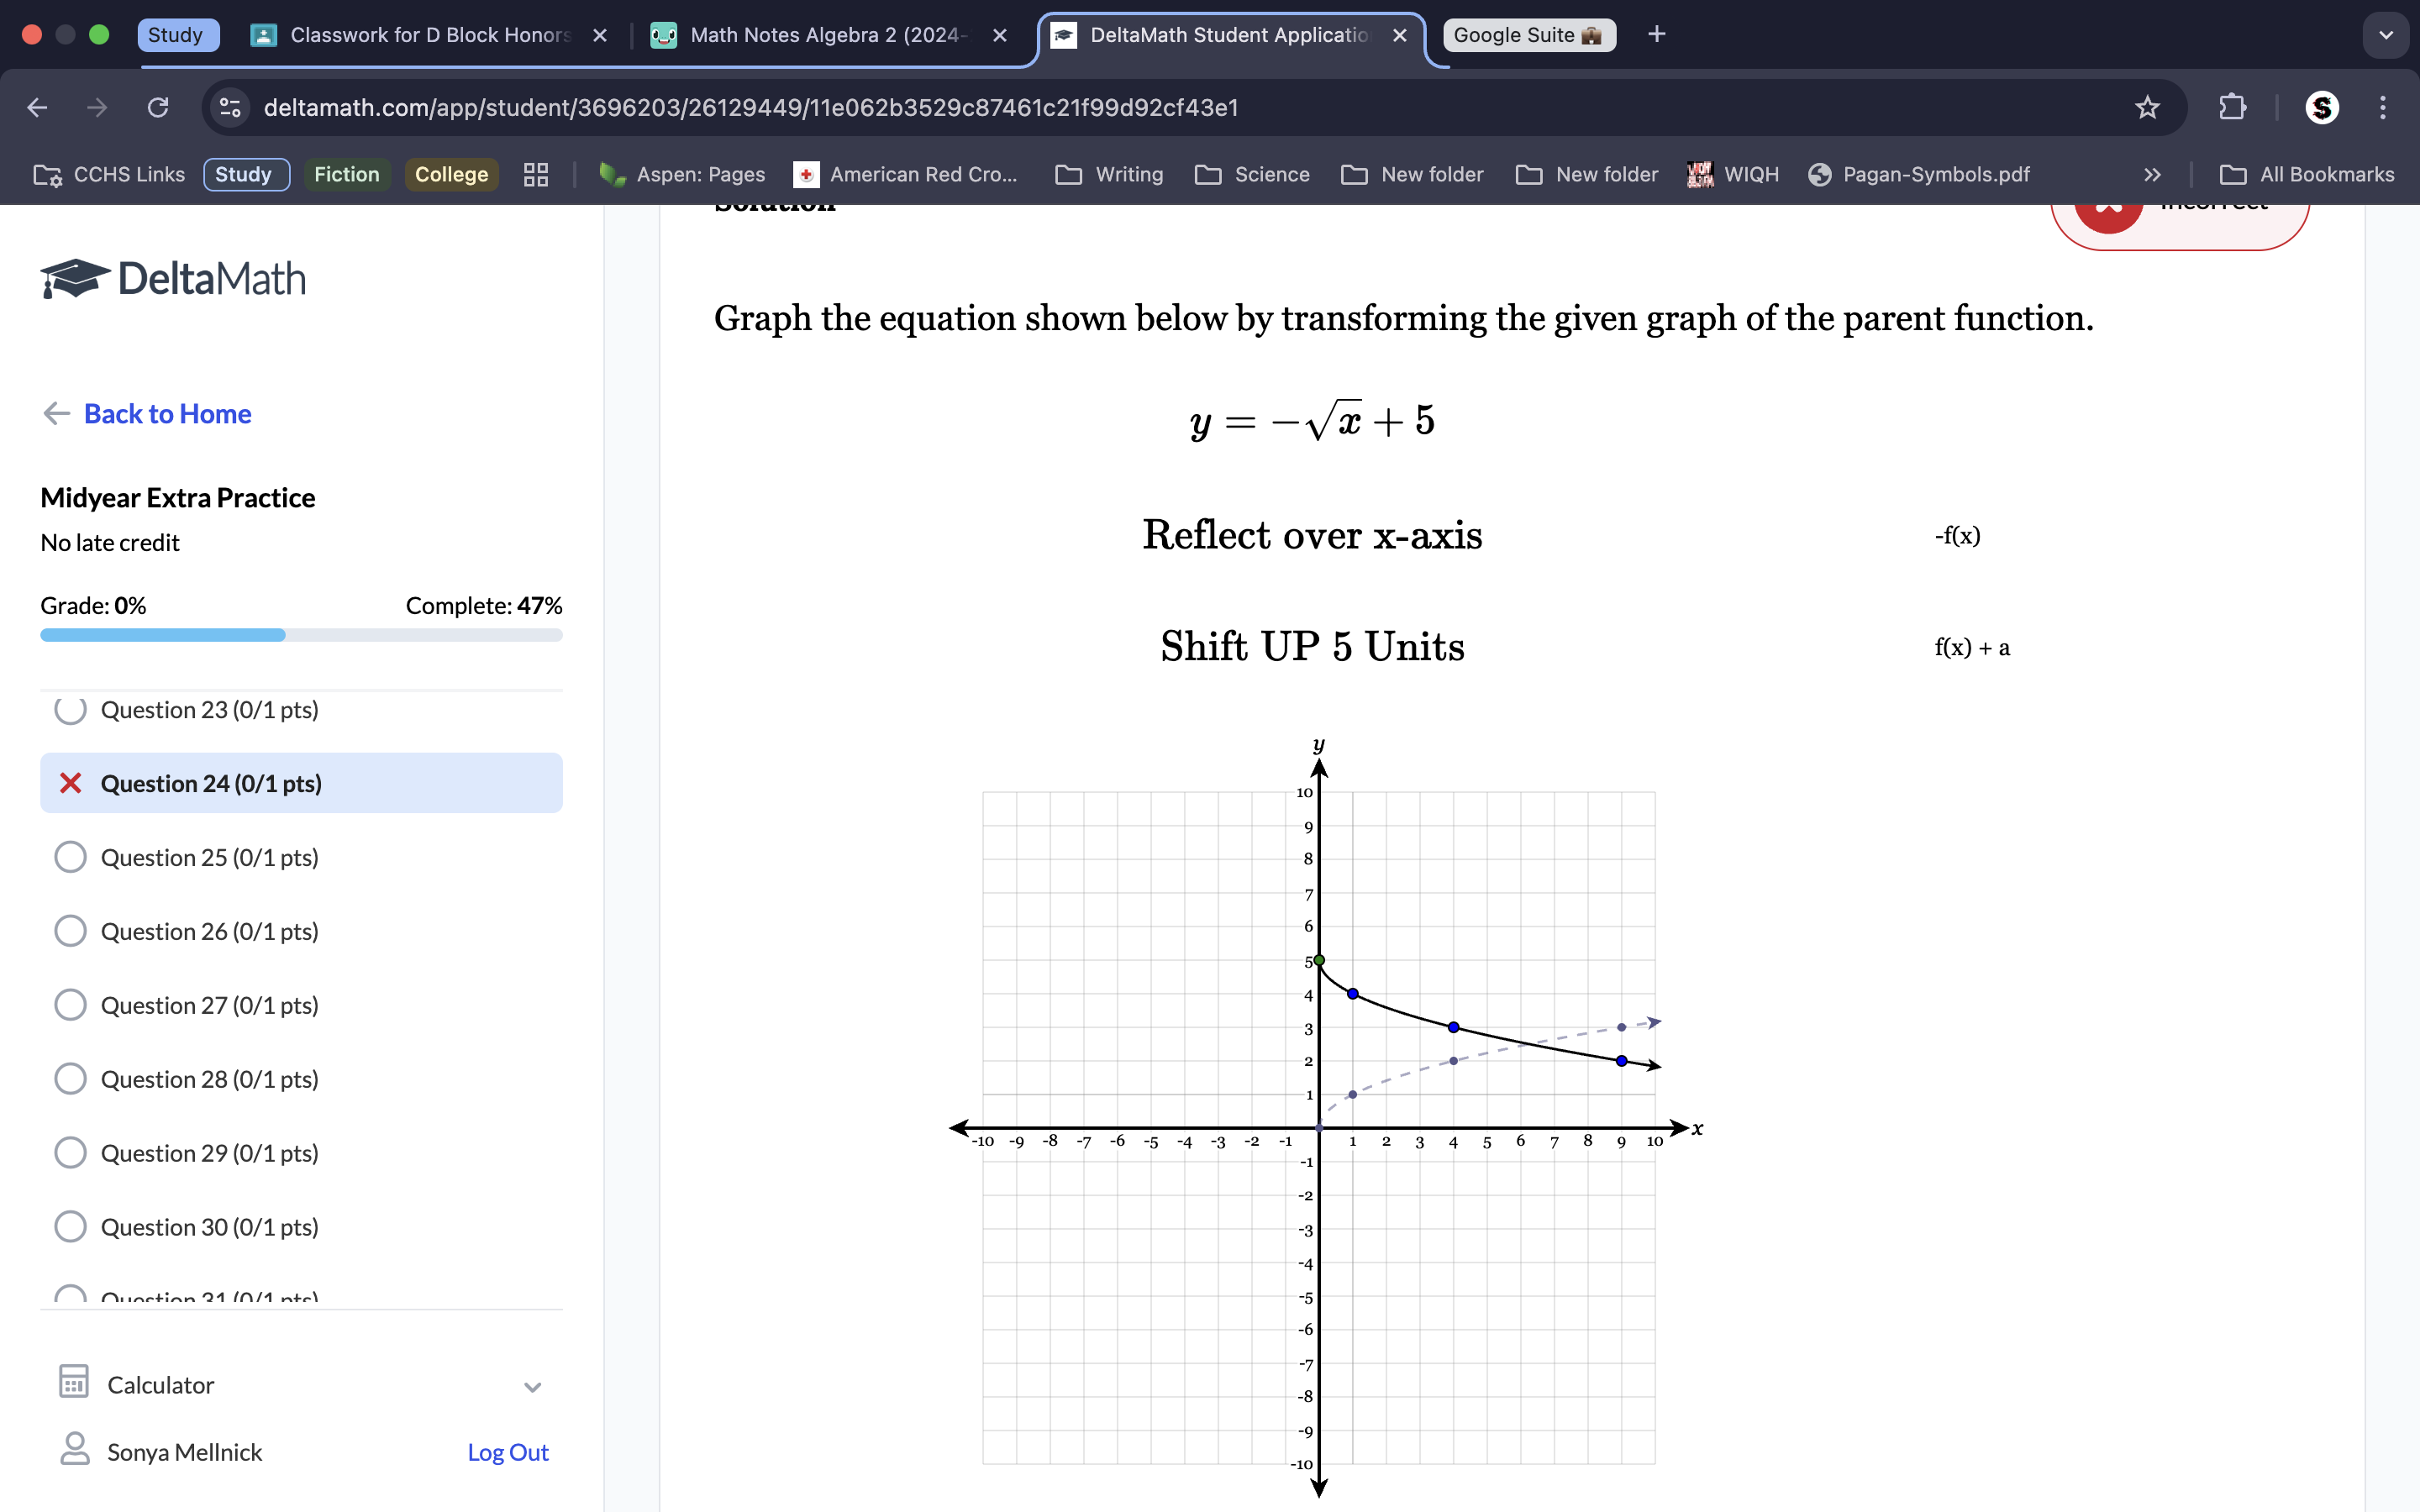
If the ‘-’ is on the outside, you reflect over the x-axis. Shift up 5.
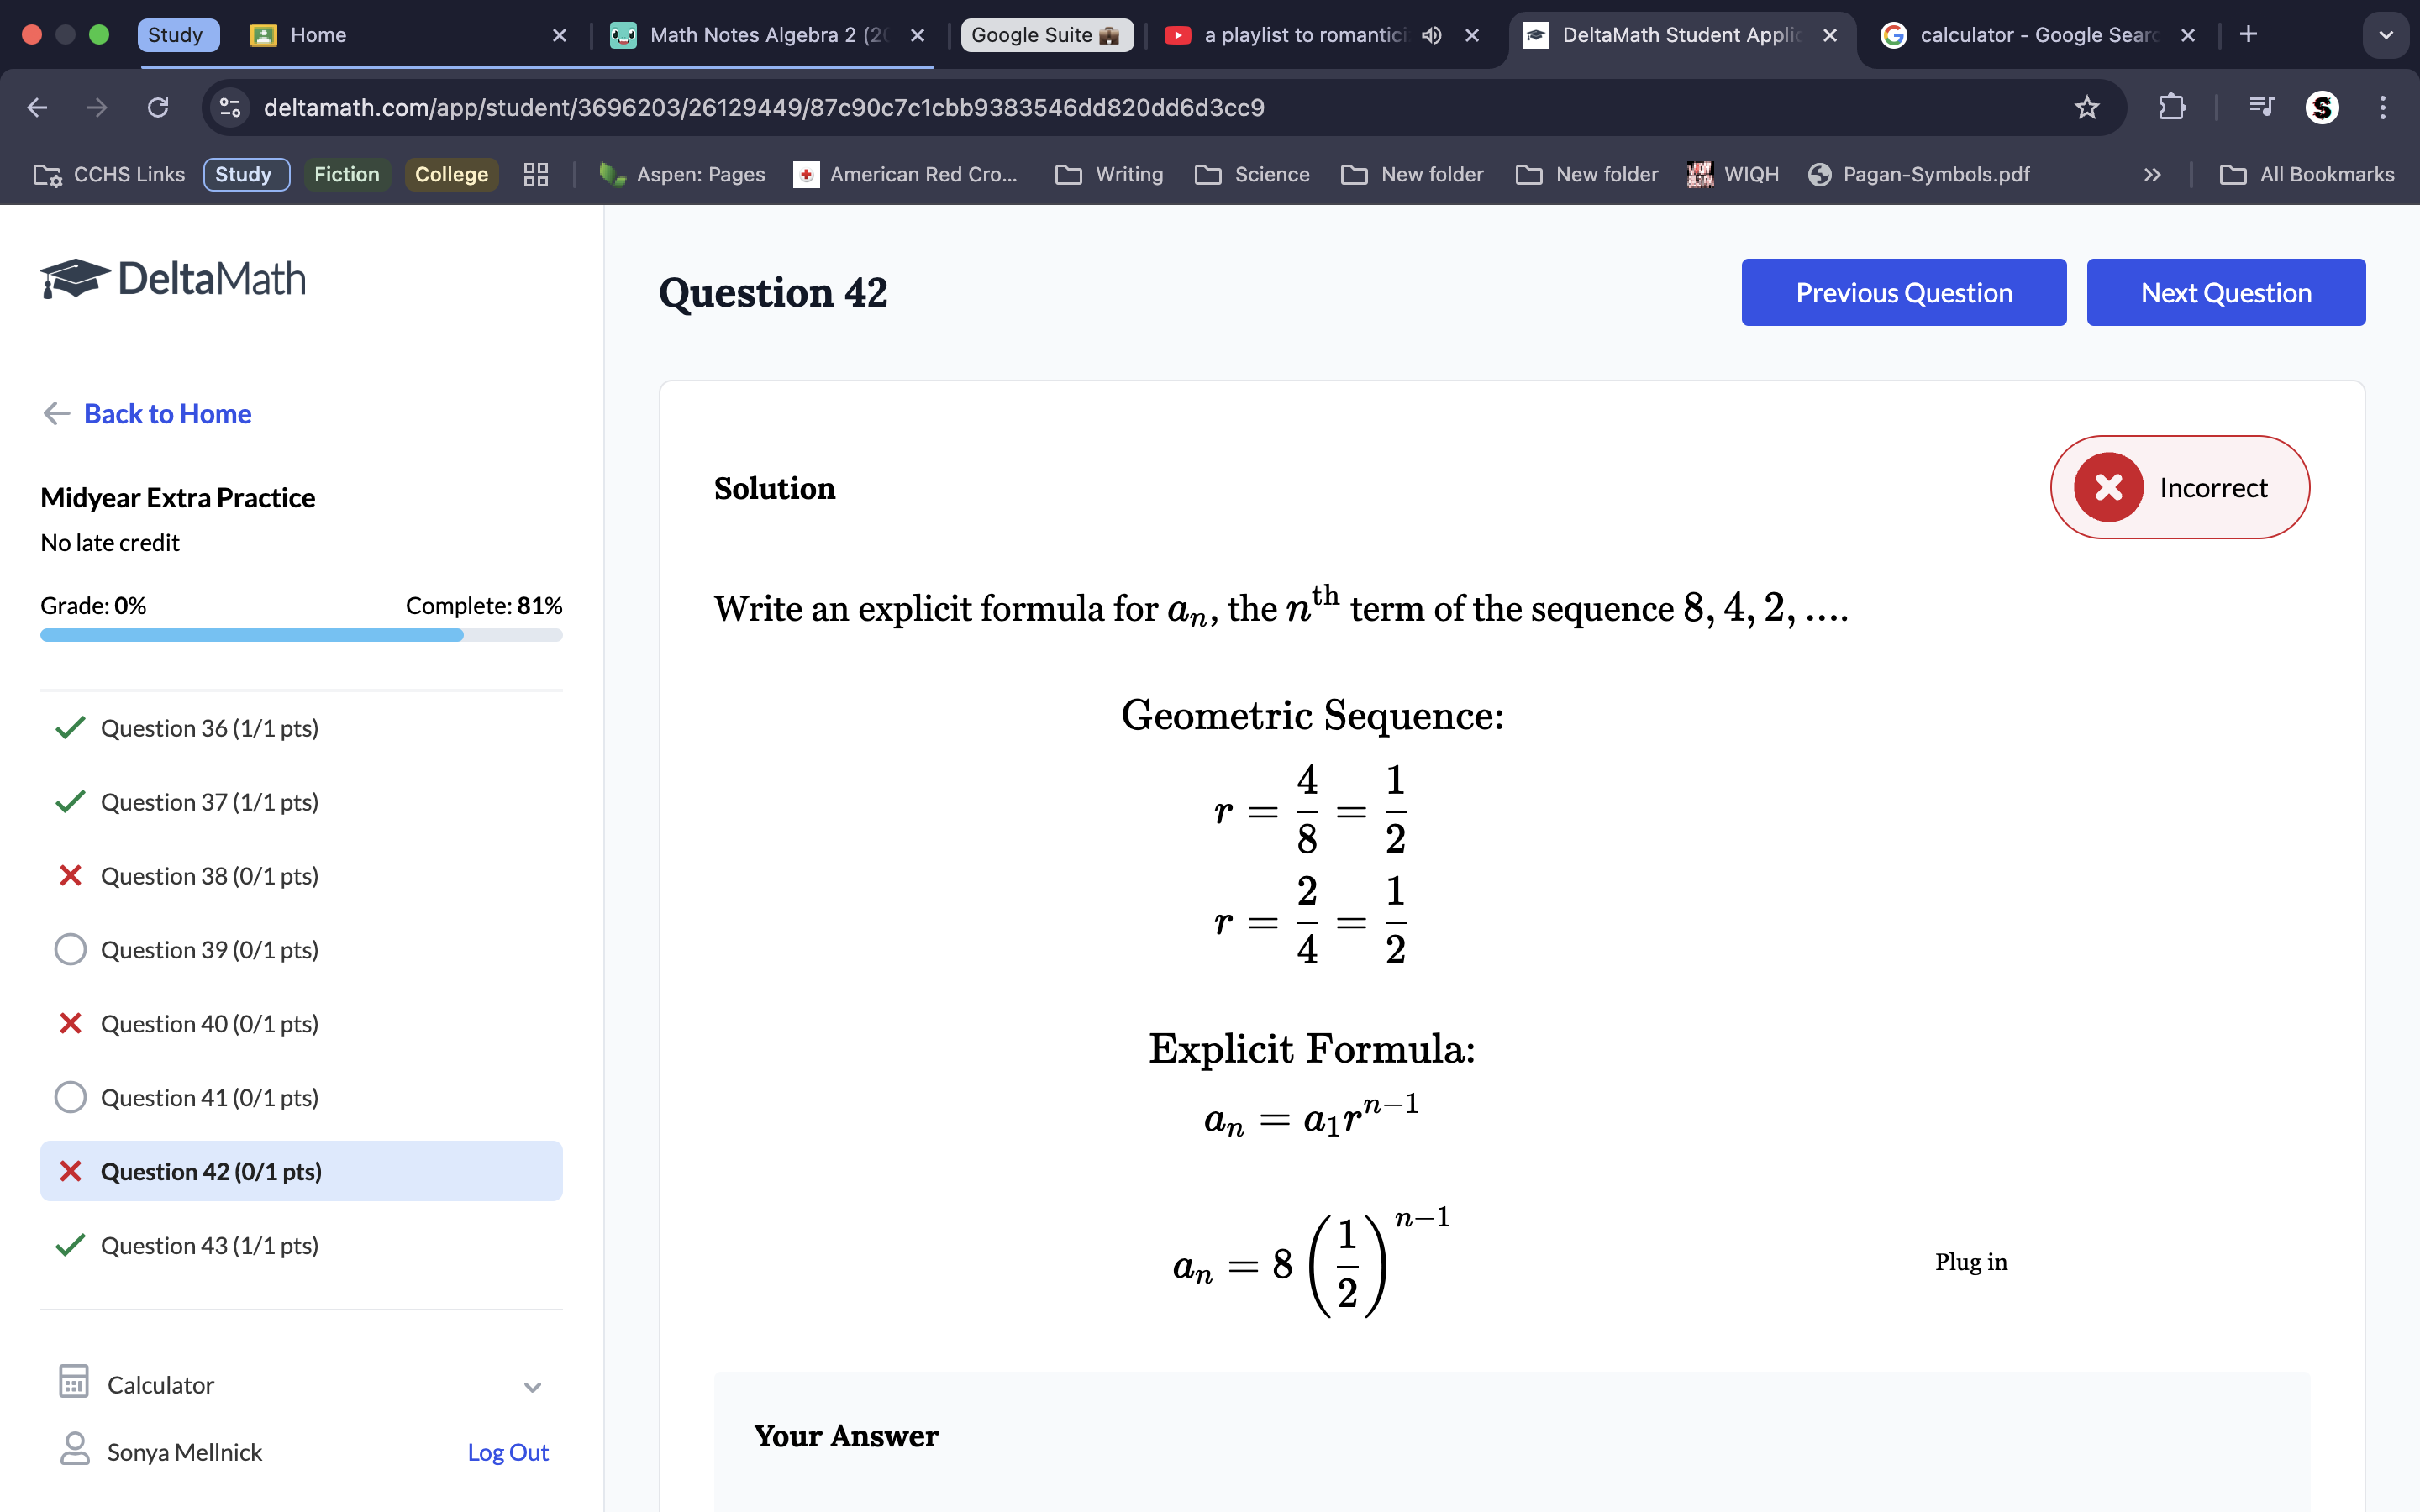
Remember that the geometric formula (explicit) is an=a1(r)n-1, there is no ‘+’.
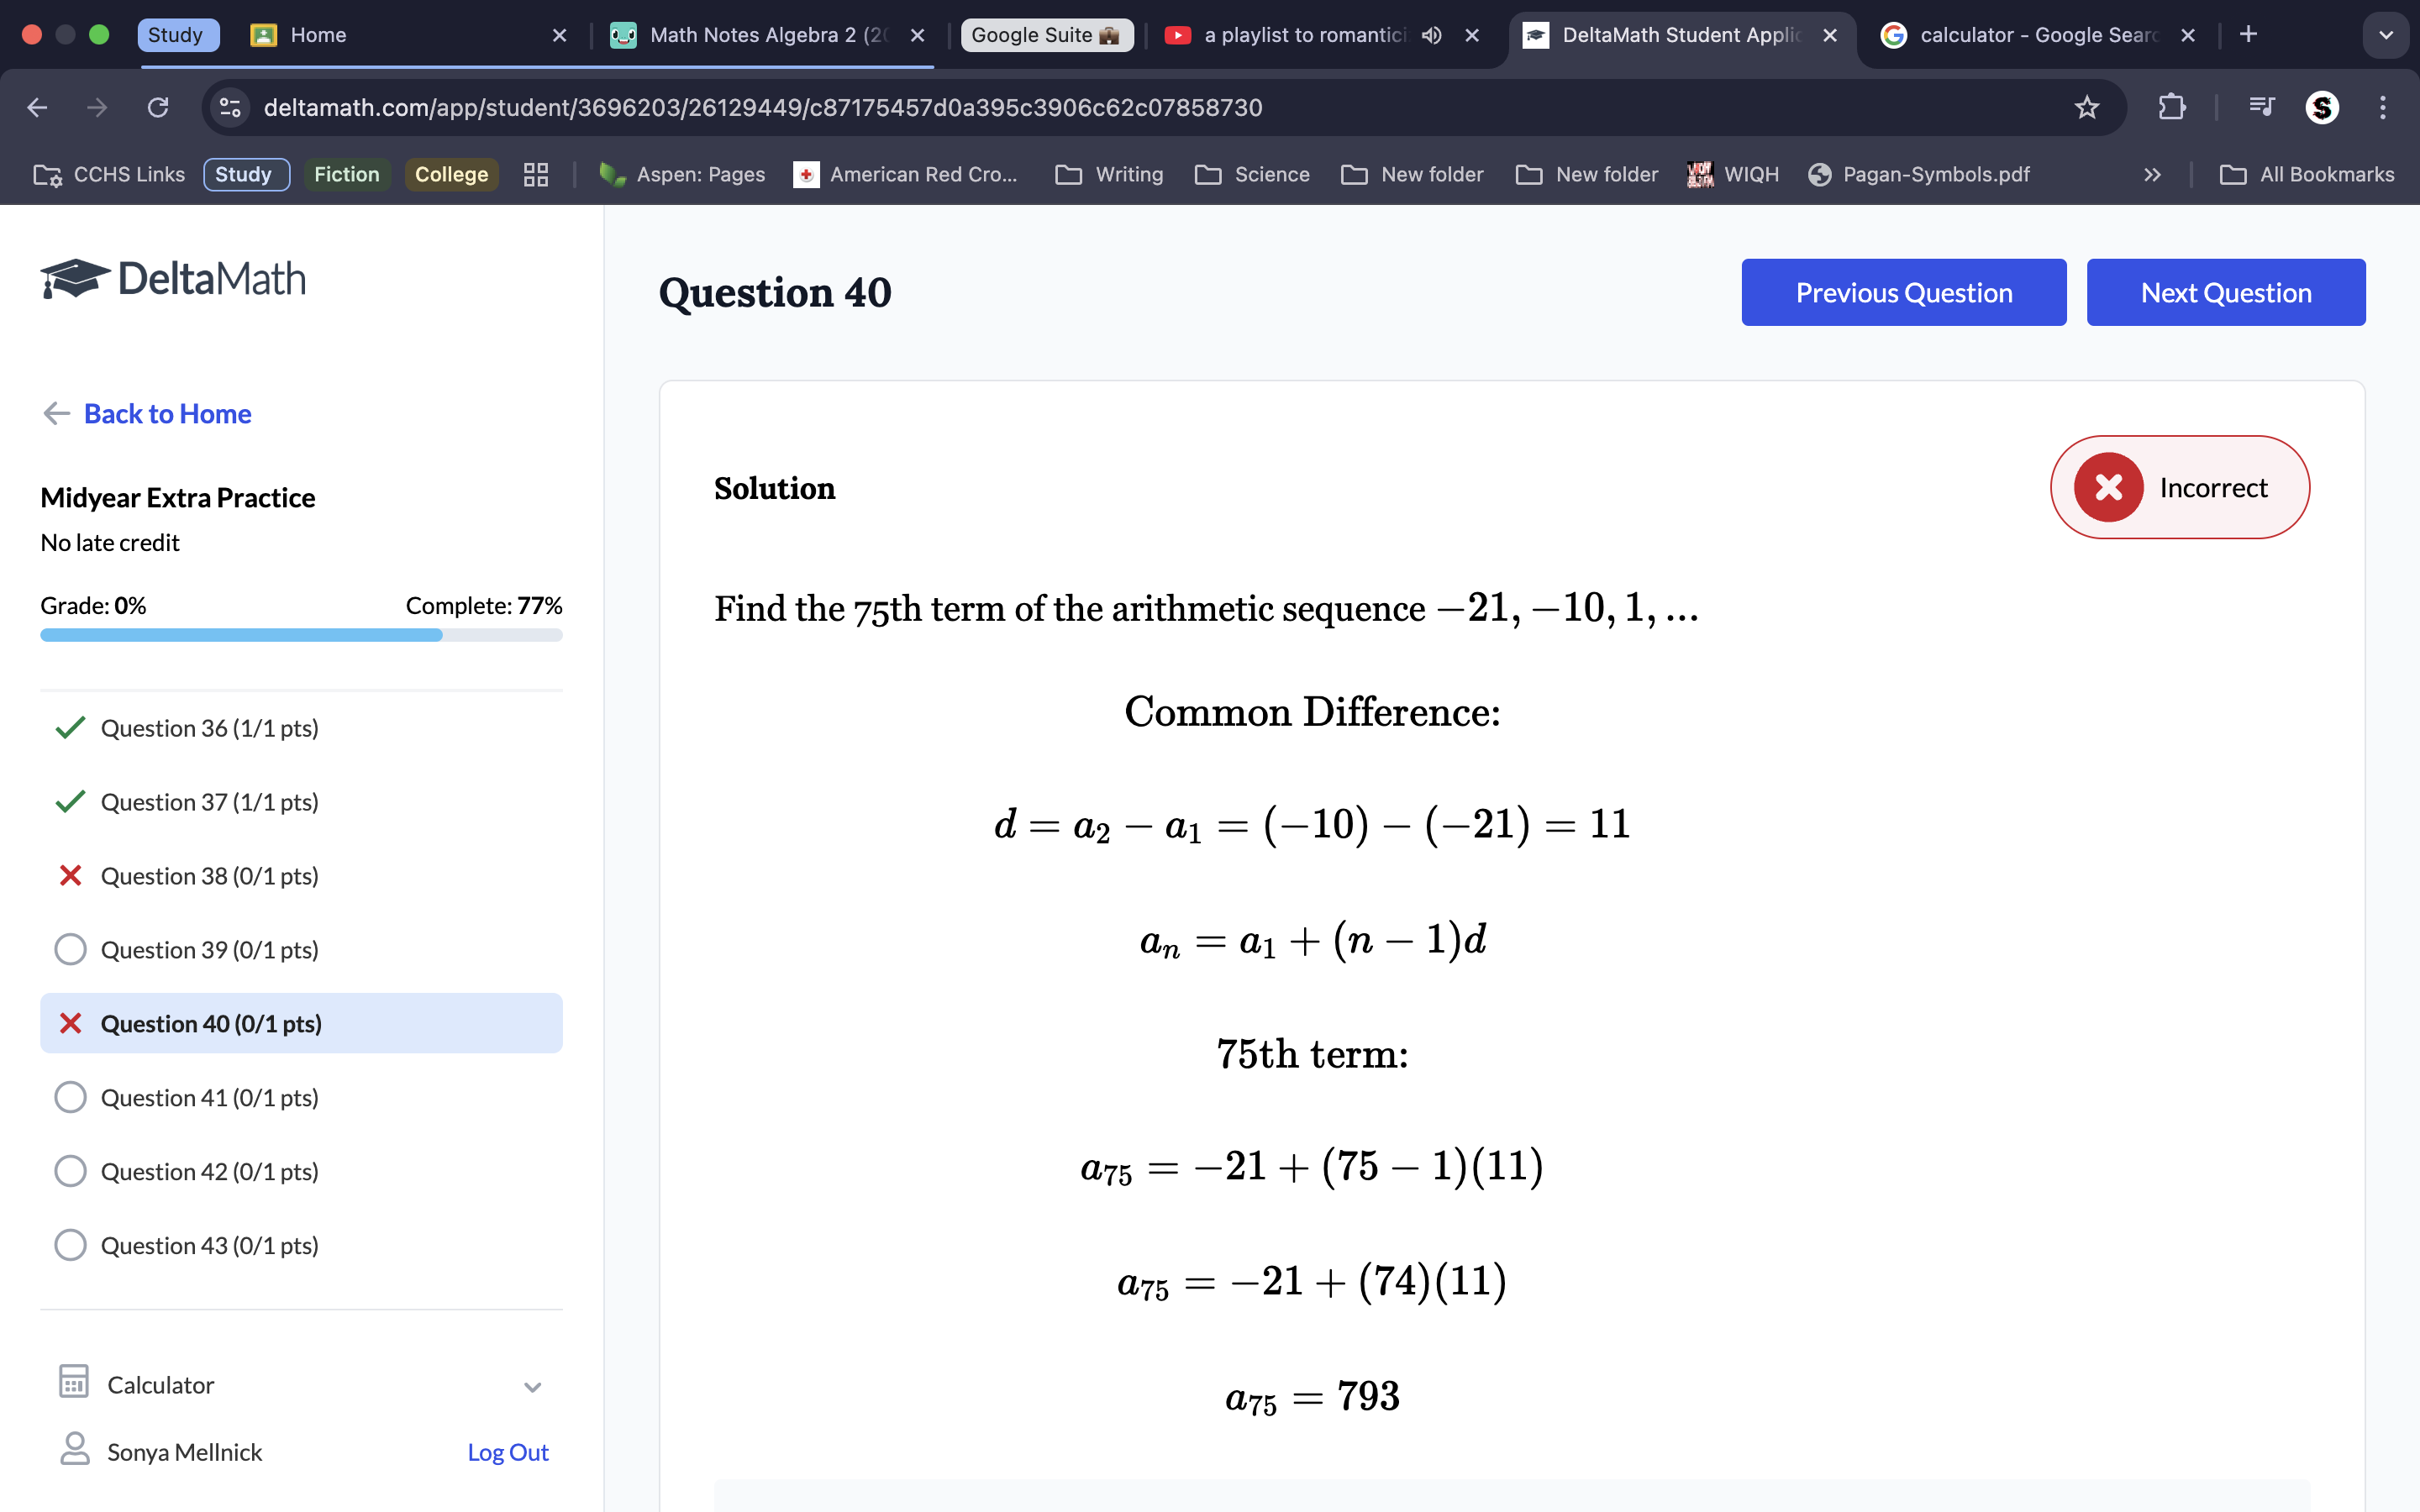
To find the 75th term, plug the 1st term, term number, and common difference (Which we know from the pattern is -10) into the explicit formula which is an=a1+(n-1)d. Check your common difference with the calculator.
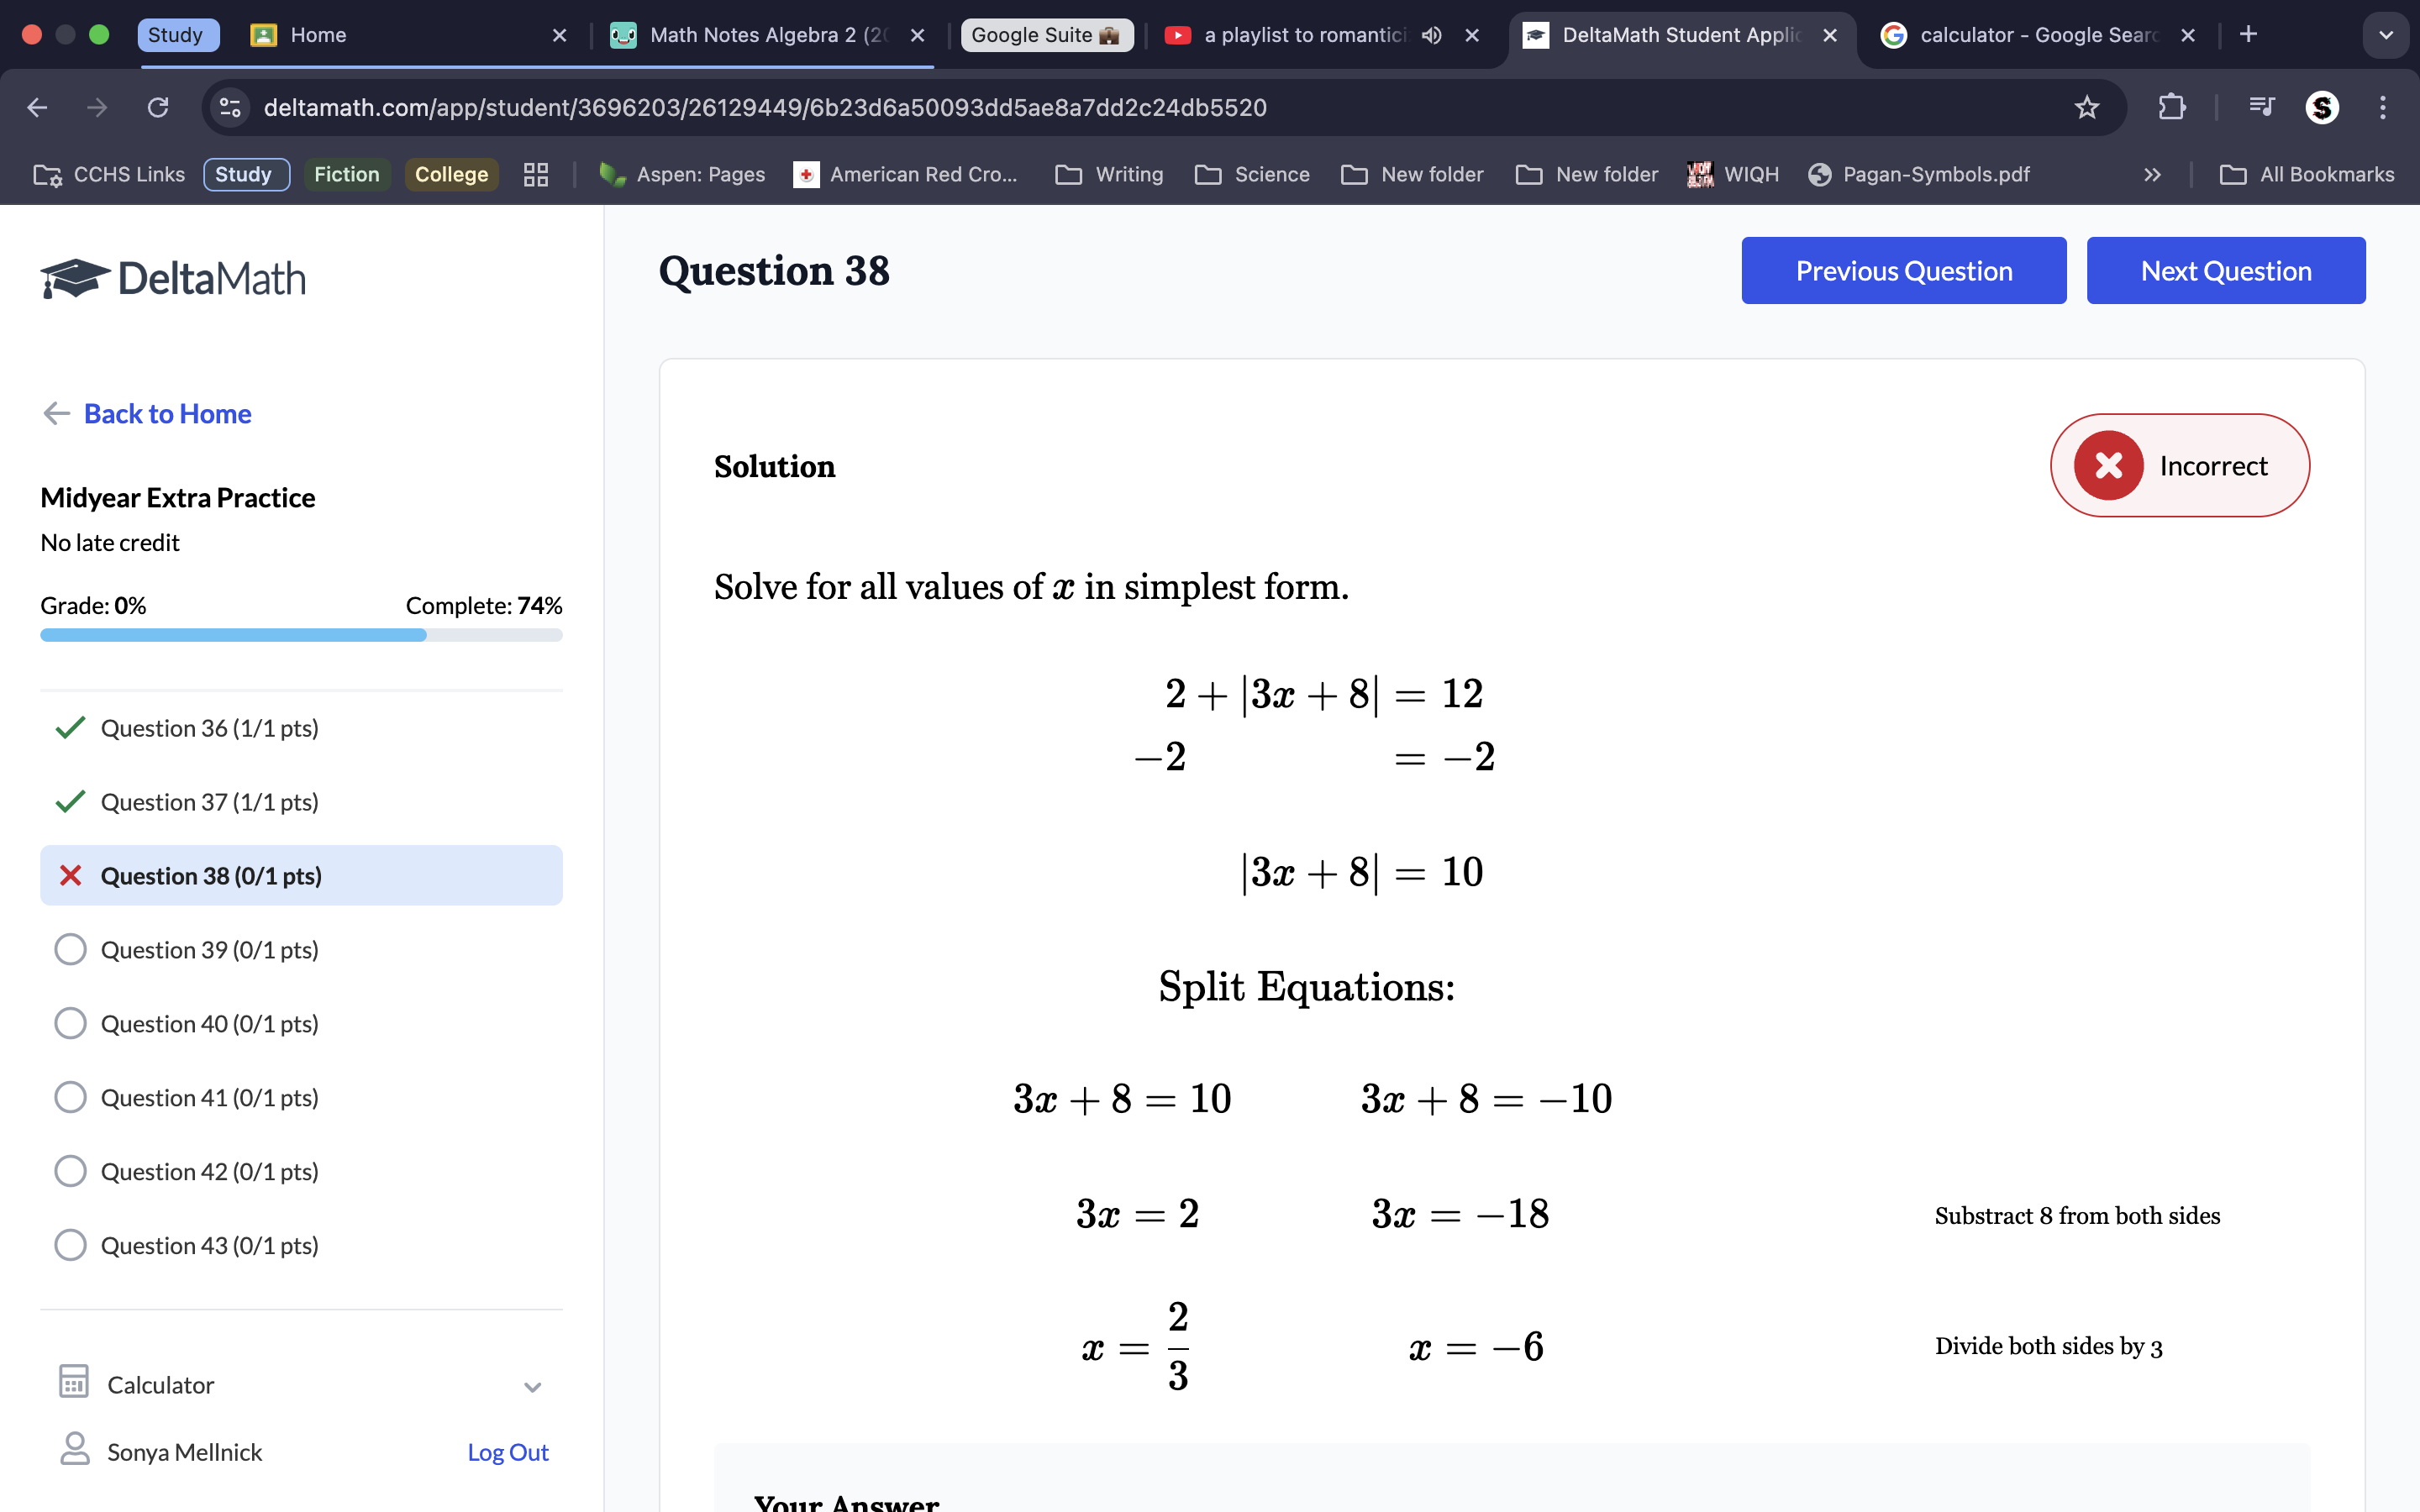
Absolute value equations always have 2 x-values. Begin to split the equation at the part where we go into the ‘parentheses’. Always check your answers by plugging the solution back into the original equation.
Make sure to keep track of your x and y values for your equation. Make sure to include the exponents.

Pay attention to if the slope is negative.
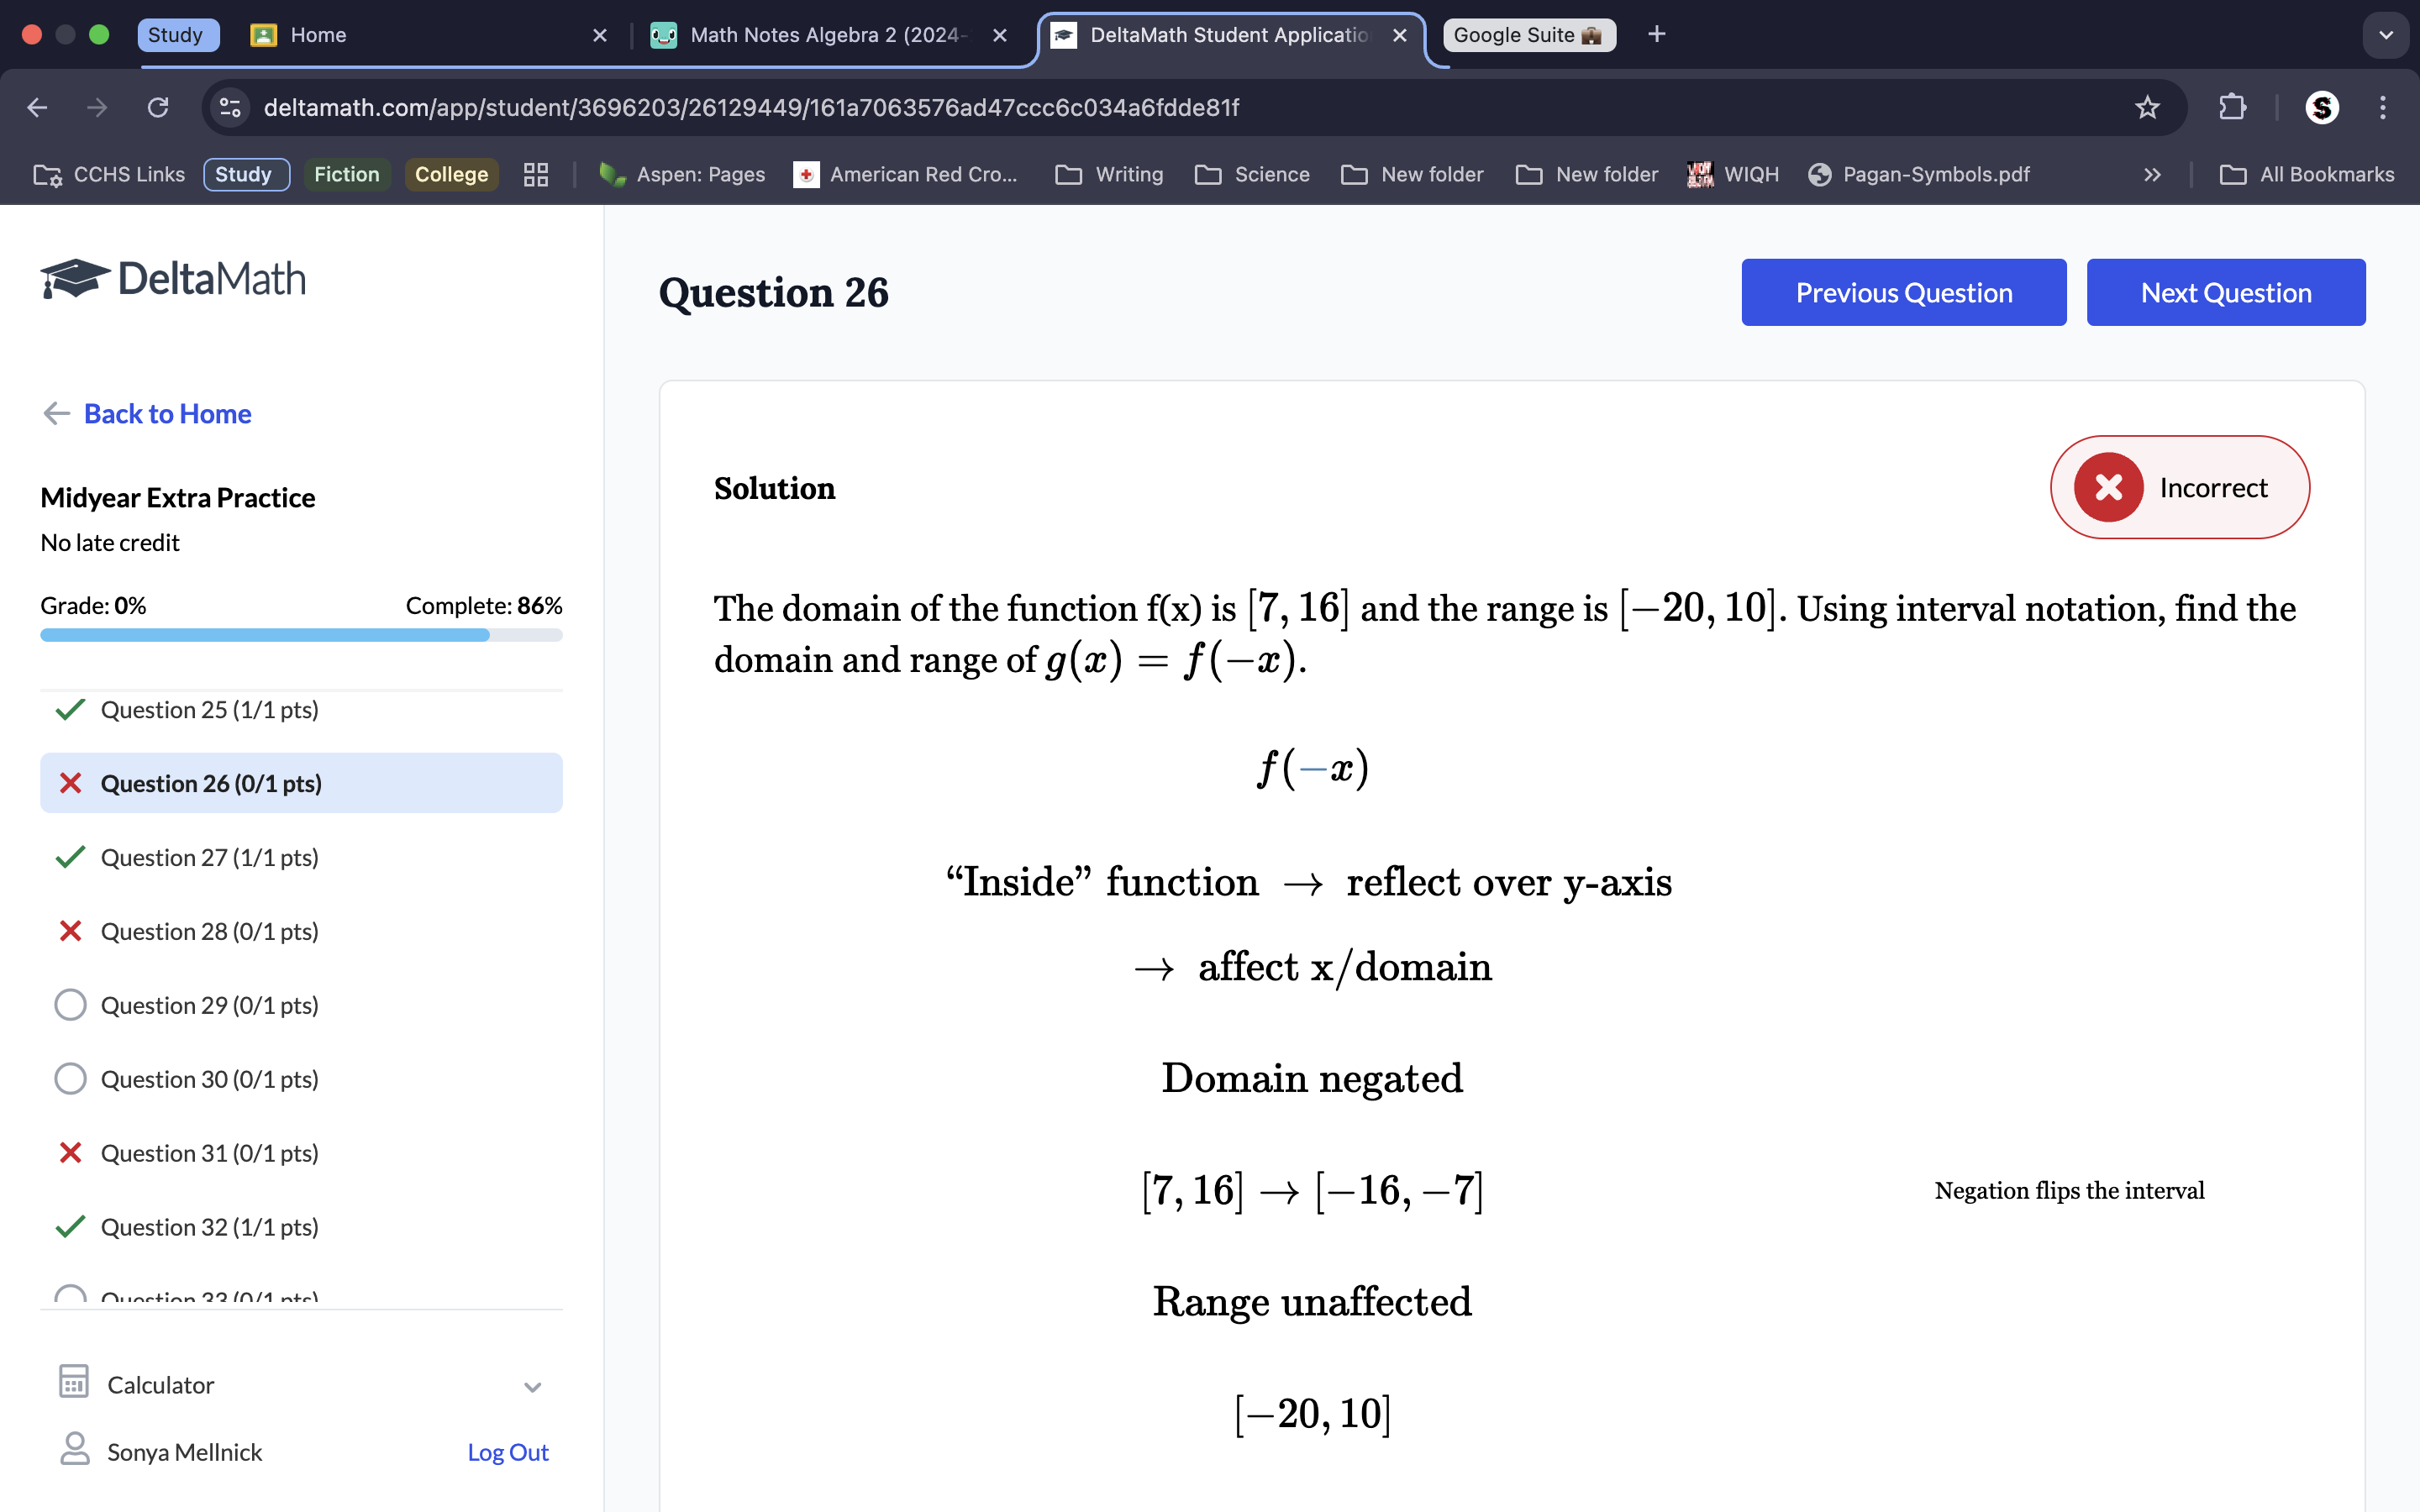
Because it’s asking for f(-x) we know it’s asking for a reflection over the y-axis, because if the ‘-’ is on the inside that automatically makes it a y-axis reflection. Therefore, the y axises don’t change, so neither does the range Because it reflects over the y-axis, only the x axises change. To reflect the x axises, make the inverse of each ‘x’ value on the domain. This makes the domain values the opposite of their original values. Range stays unaffacted. Remember to switch your x’s around for the inverse.
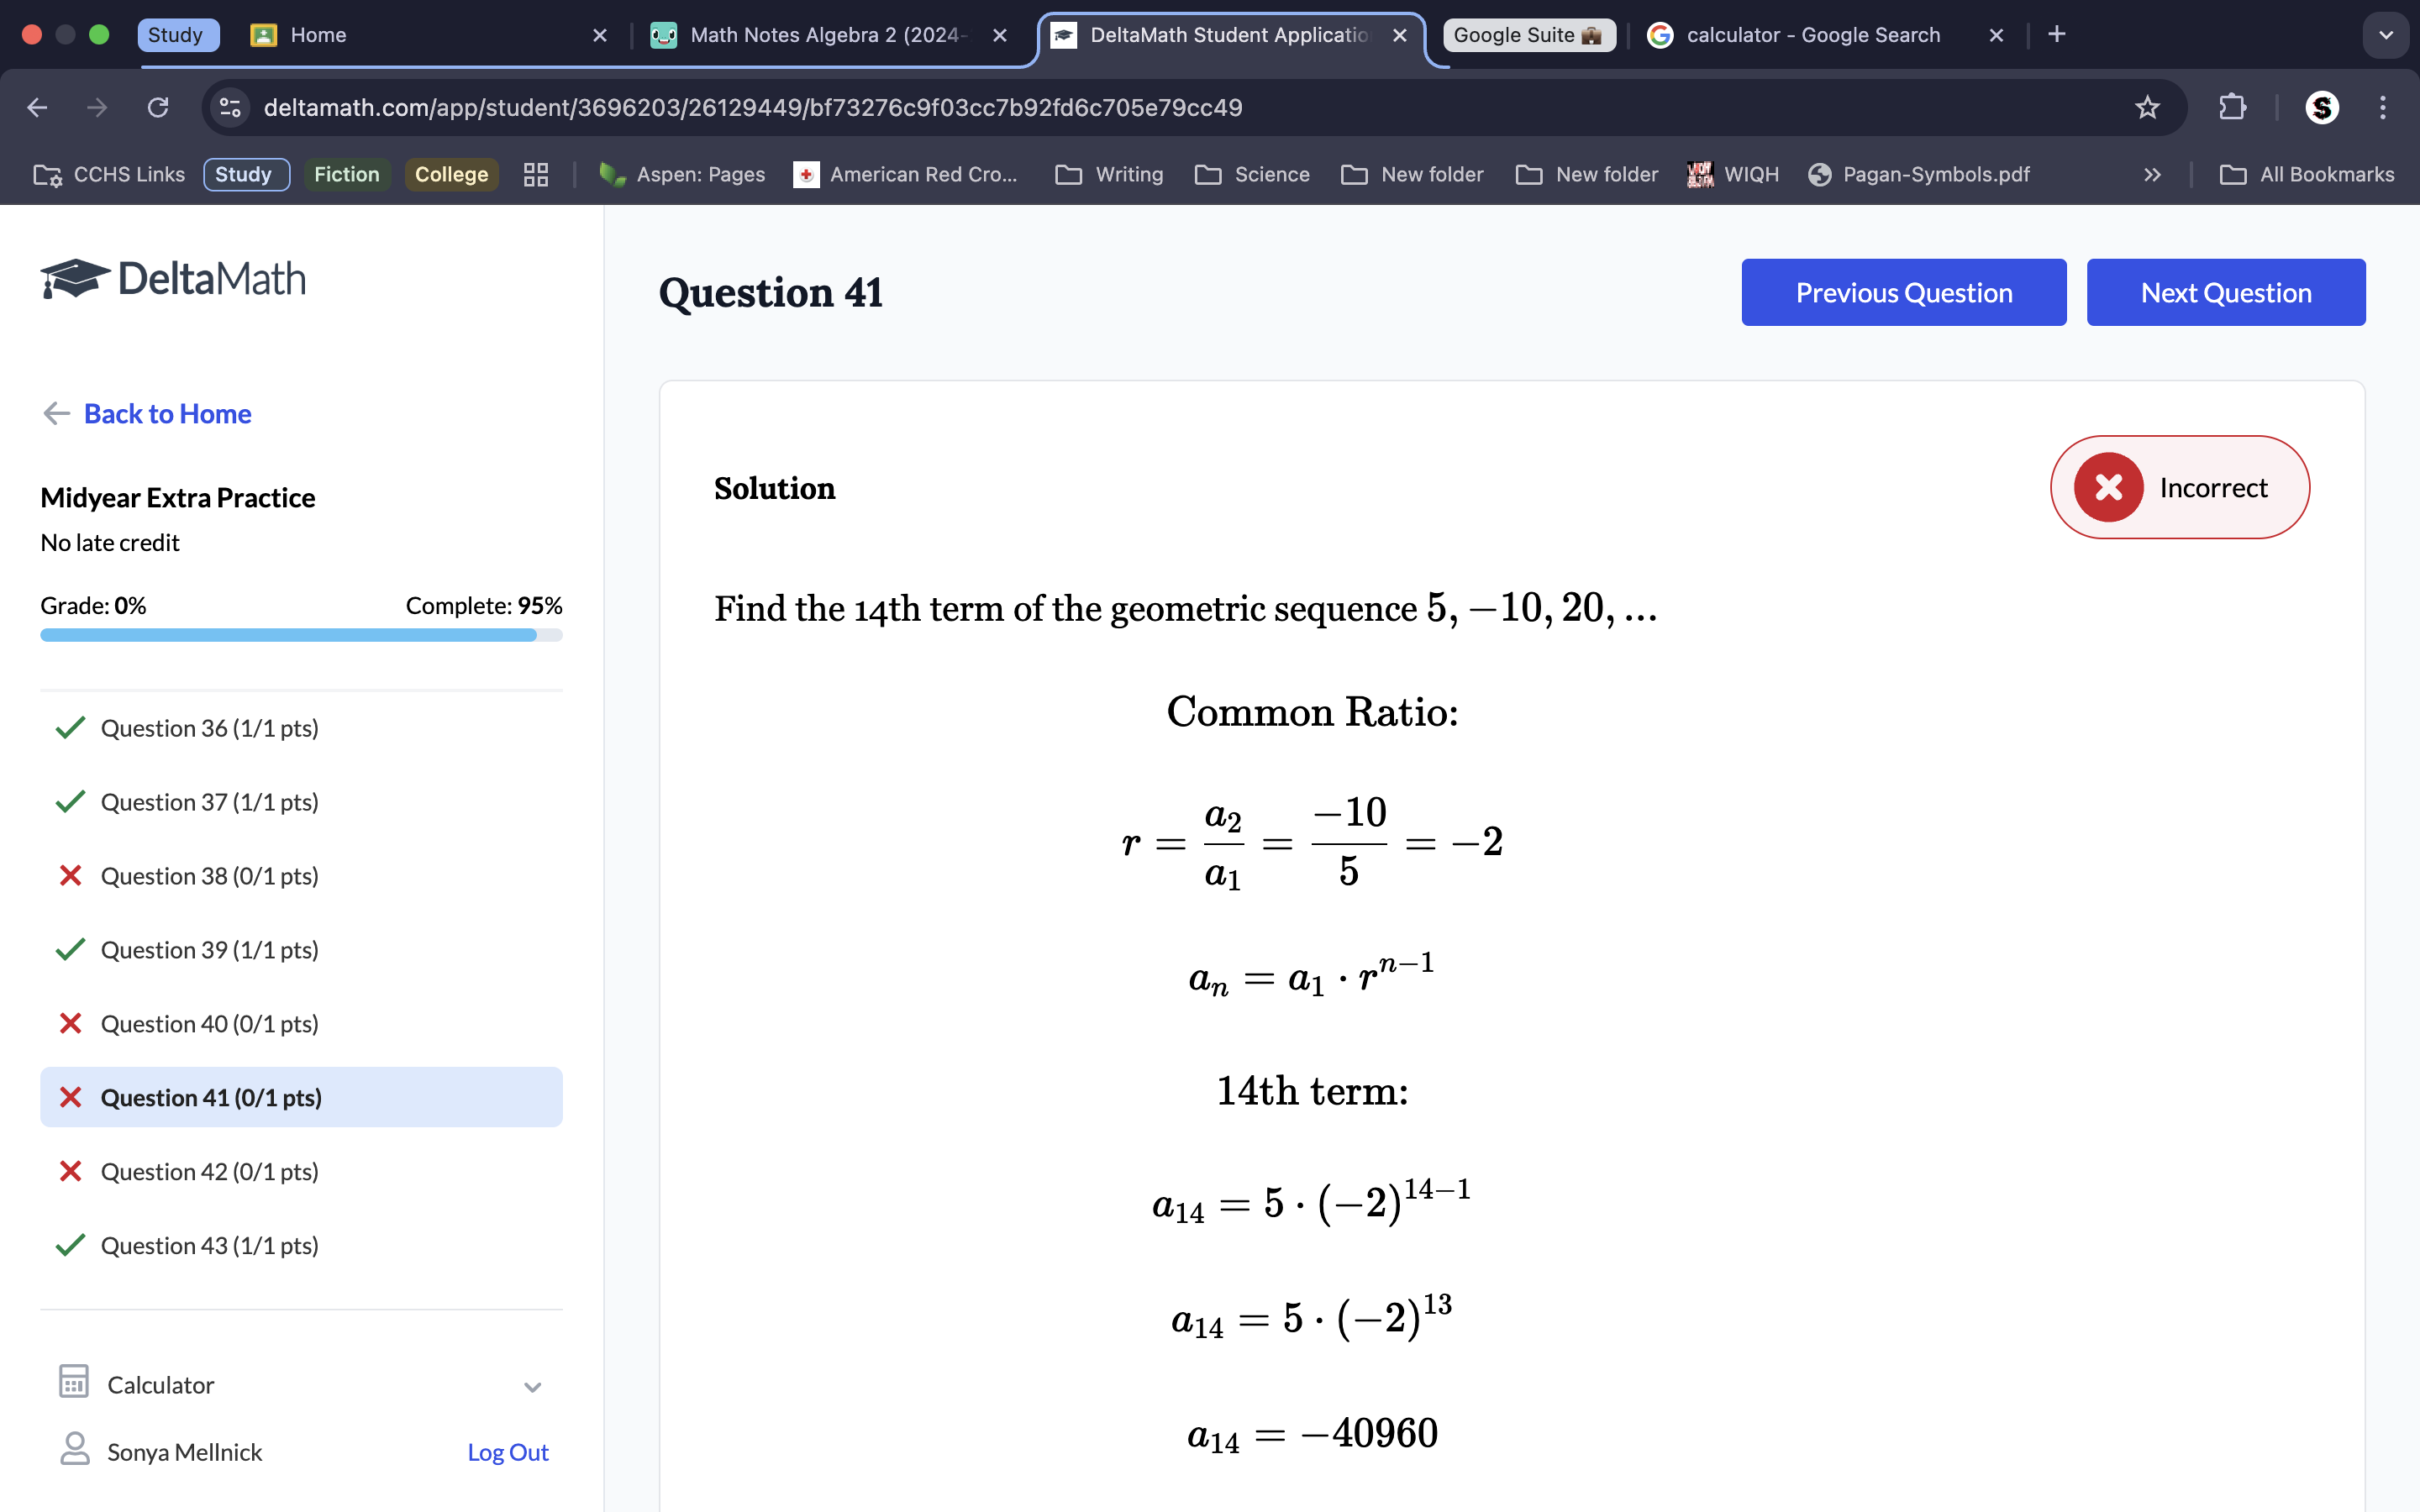
Multiply by 5, don’t add it. The Explicit geometric formula is a1=a1•(r)n-1
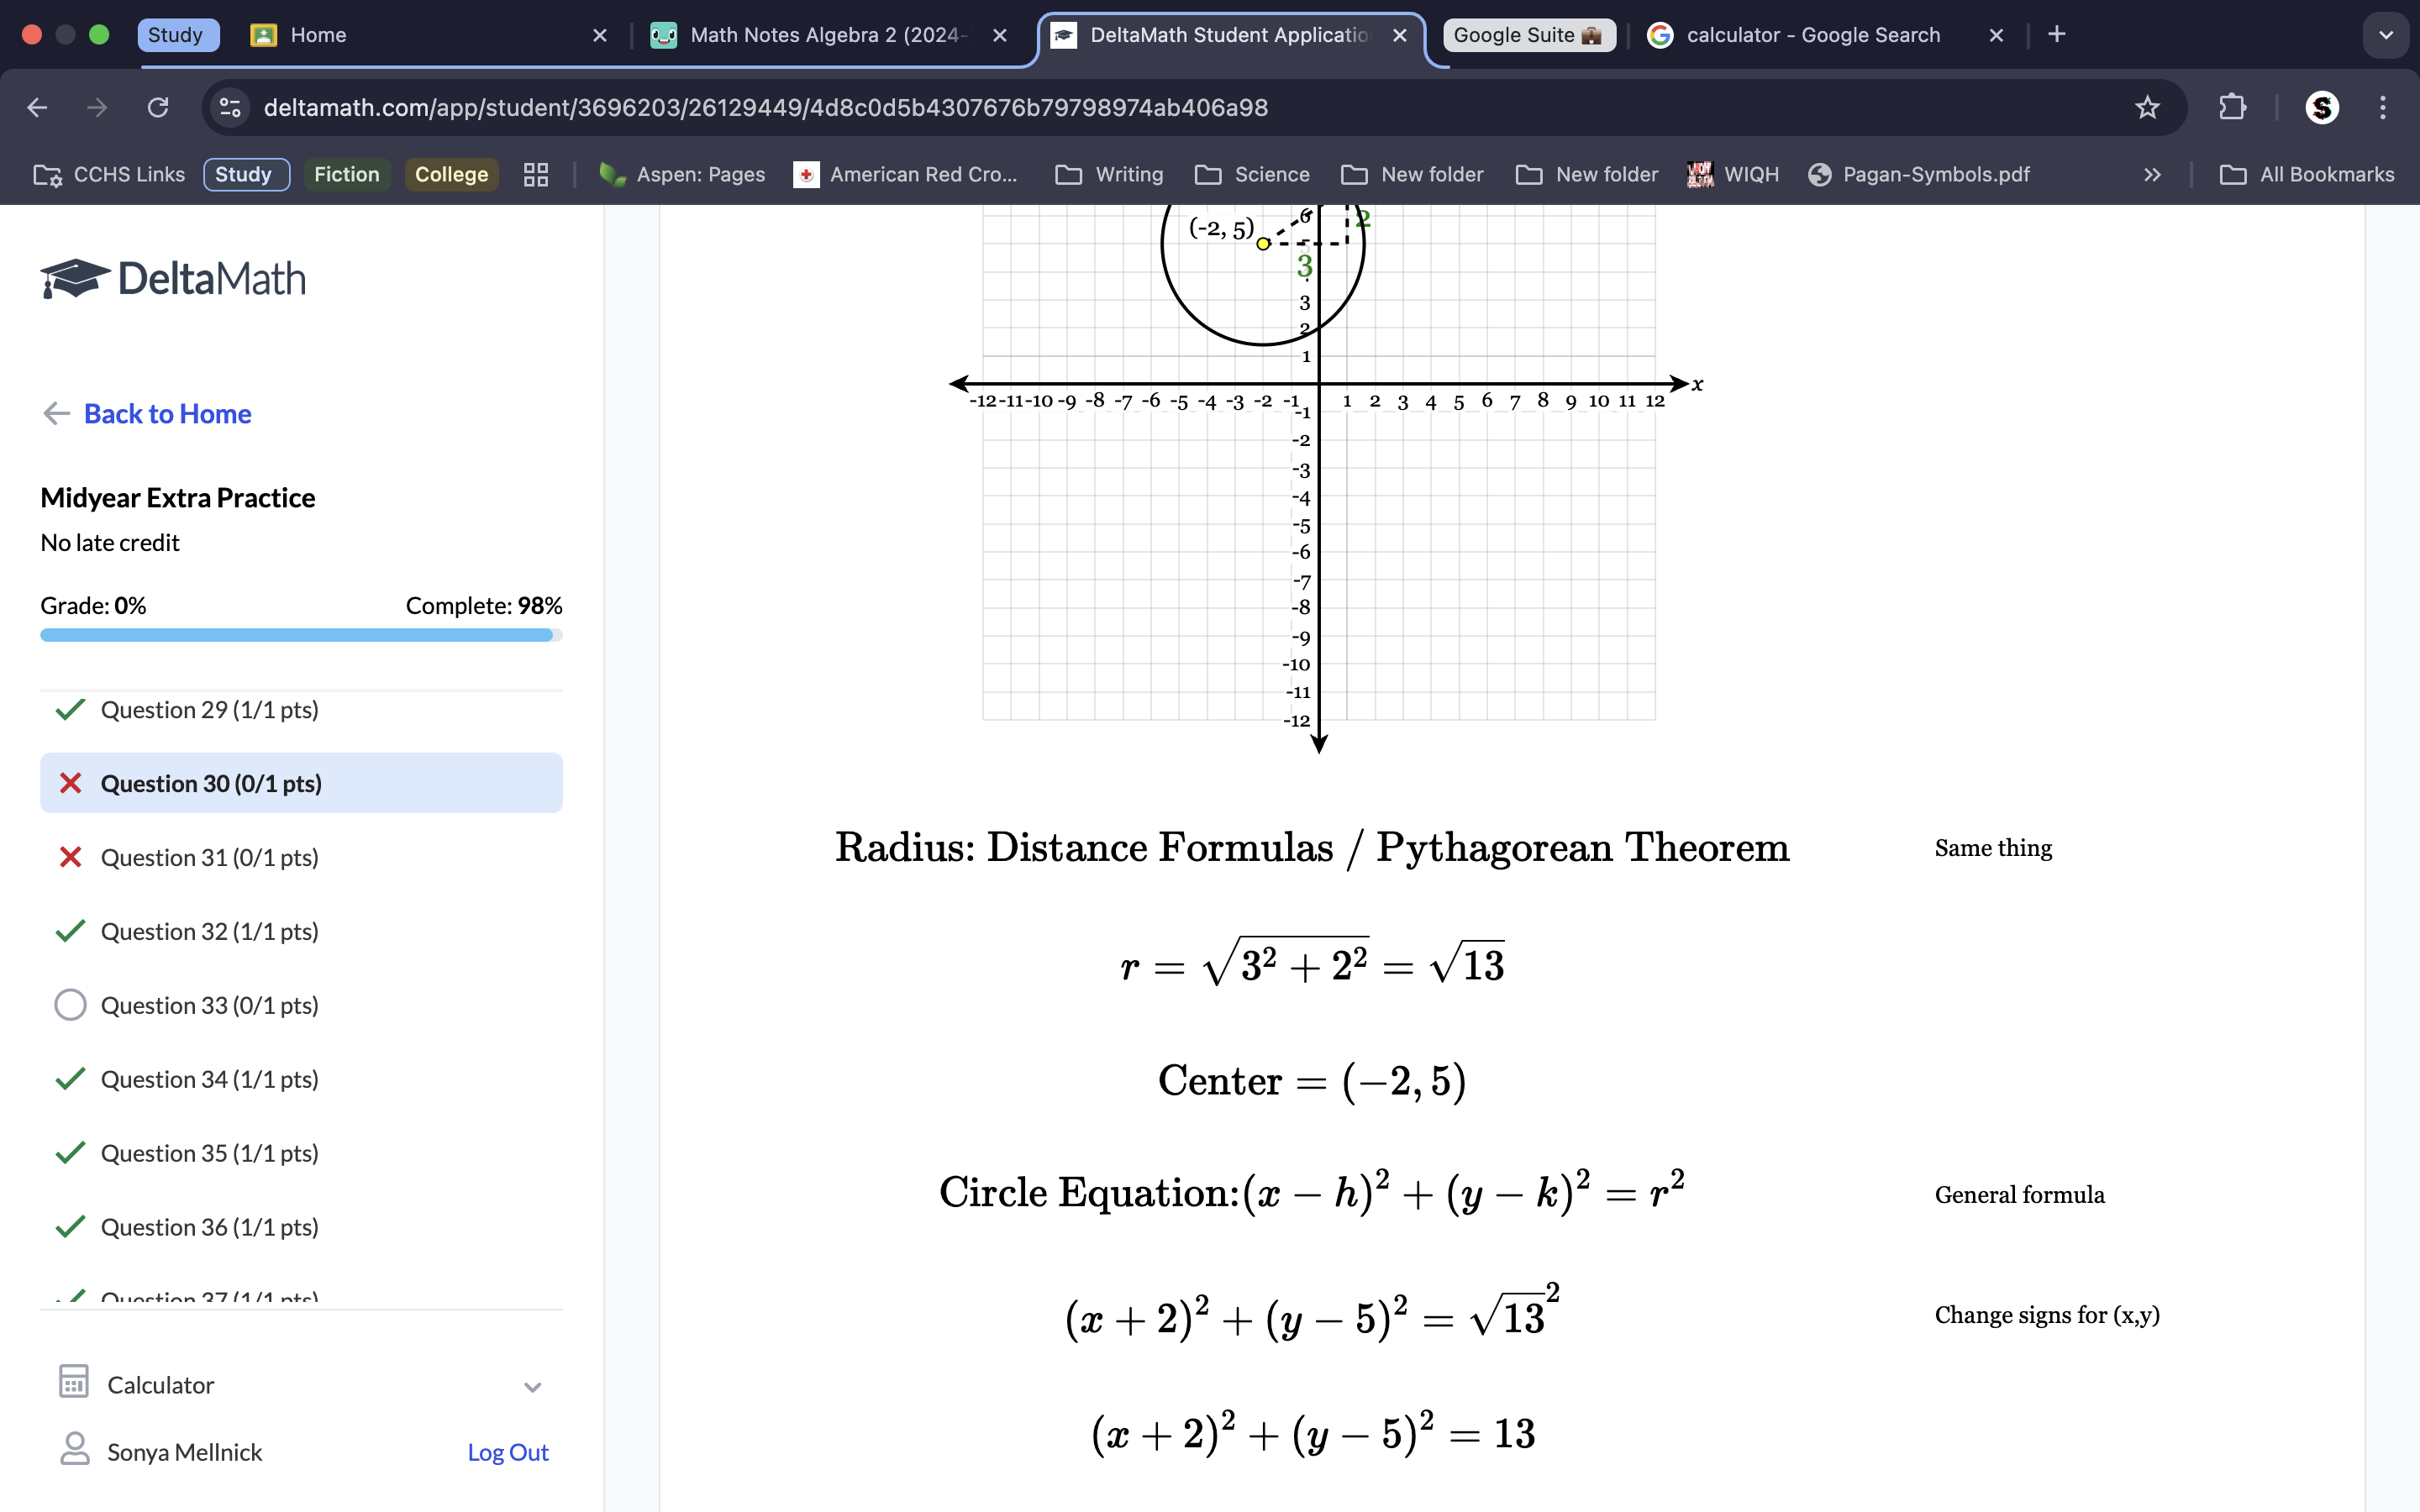
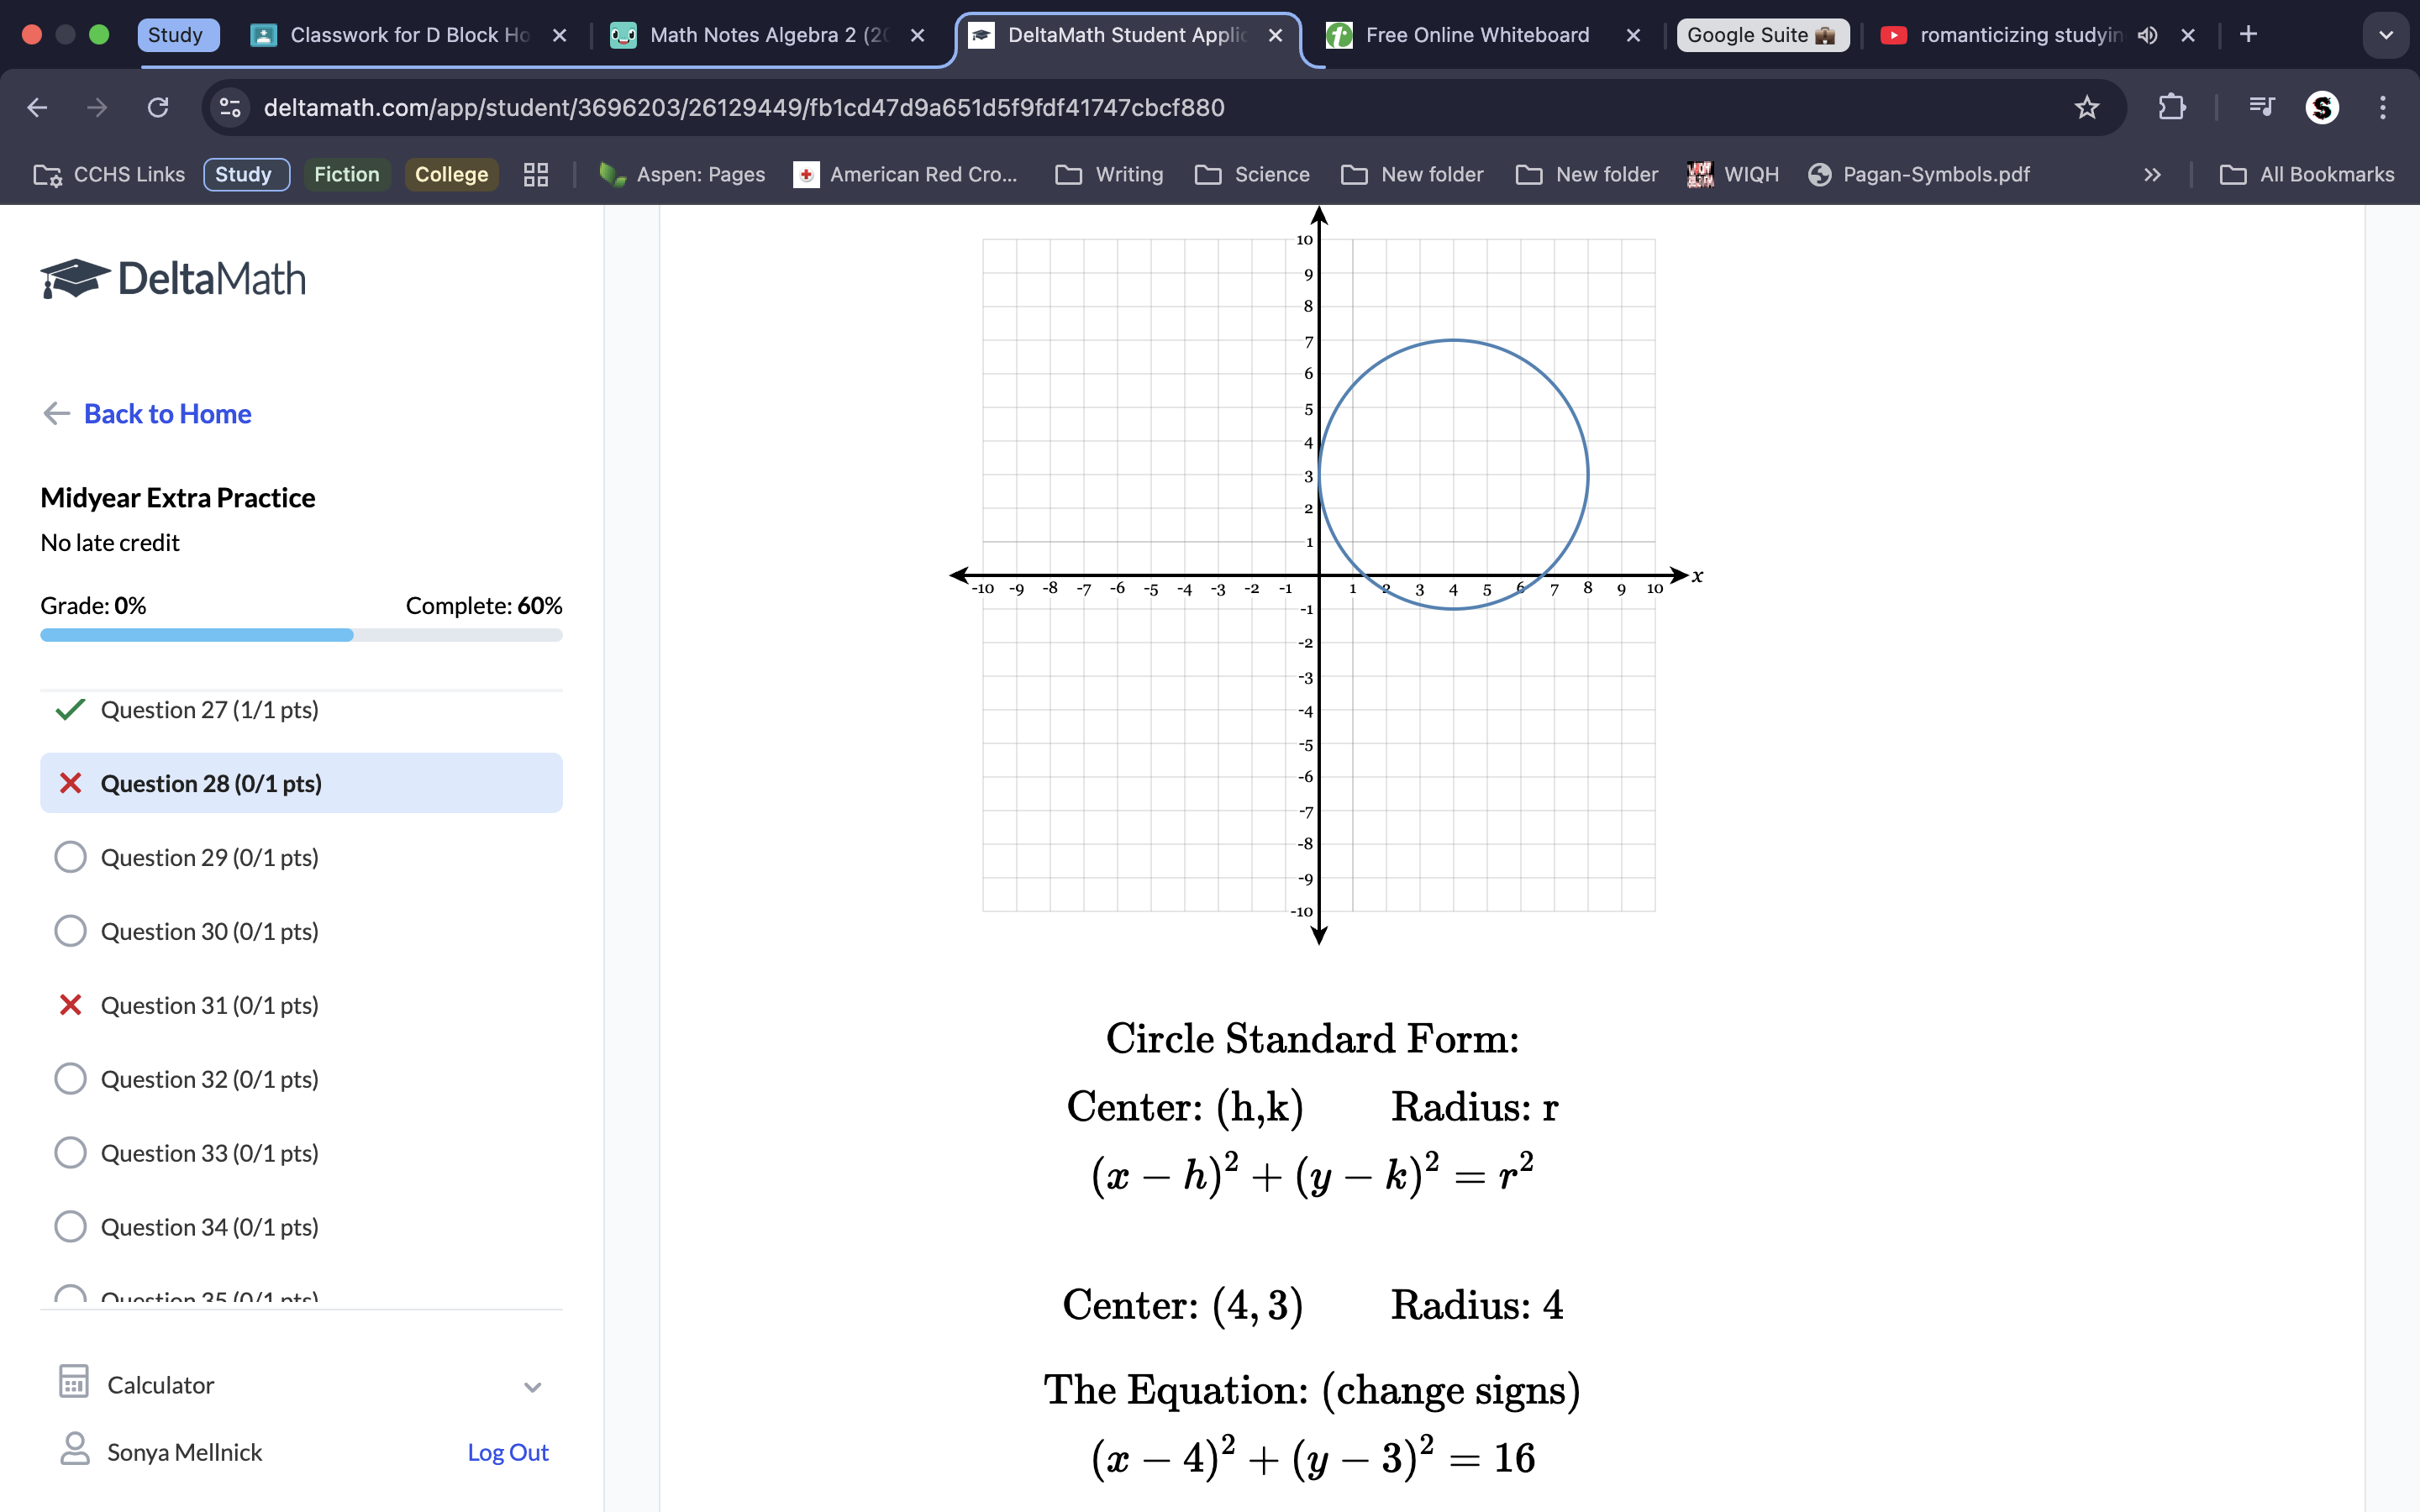
Use the pythagorean therom to get the radius, and remember that after the radius is square rooted (from the pythagorean therom) it gets squared again because it goes into the circle equation where it’s ‘=r2’ . Remember the exponents.
MIDTERMS:
Unit 1- 1.1-1.5 (Done)
Unit 2- 1.6-2.4 Day one
Unit 3- 2.4 Day two-3.2 Day one
Unit 4- 3.3-4.2