Unit 4.7: Financial Sector
The Loanable Funds Market
- Loanable Funds market (loans)::
- How much money in the form of loans consumers, businesses, and government are requiring
- Determined by expectation of return on investment
- Real interest rate::
- The “price of borrowing money”
- with loanable funds, use real instead of nominal b/c loans are usually taken over a longer period of time
- ^^Real interest rate = nominal interest rate - inflation rate^^
- Demand for loans
- Follows the law of demand like any other good/service (downsloping)
- Represents the amount of loans being demanded by consumers, producers, and government
- Supply of loans
- Follows the law of supply like any other good/service (upsloping)
- In a closed economy:
- ^^Supply in closed economy = national savings^^
- ^^national savings = public + private savings^^
- In an open economy
- ^^Supply in open economy = national savings + net capital inflow^^ (money coming in from foreign investors)
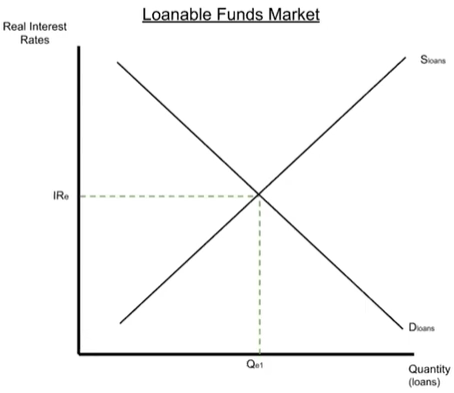
- Equilibrium
- Occurs when the interest rate is set where quantity supplied = quantity demanded
Disequilibrium in the loanable funds market
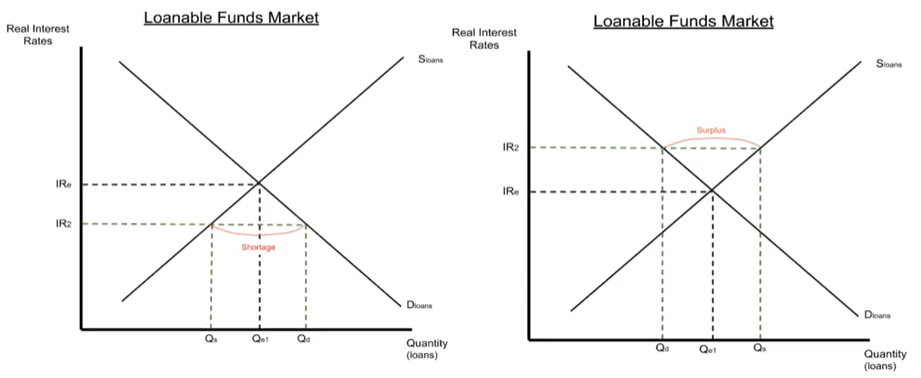
- Left graph:
- Real interest rate is below the equilibrium
- Shortage of loans
- demand will go up and supply will go down
- borrowing will be more cheap (high demand)
- less payoff for saving
- People won’t keep as much money in the bank so the amount available to loan out decreases (low supply)
- Must increase interest rate from IR2 to IRe
- Right graph:
- Real interest rate is above the equilibrium
- Surplus of loans
- demand will go down and supply will go up
- borrowing will be more expensive (low demand)
- more payoff for saving
- People will keep more money in the bank so the amount available to loan out increases (high supply)
- Must decrease interest rate from IR2 to IRe
Changes in ^^demand^^ of loanable funds: shifted by changes in return on investment
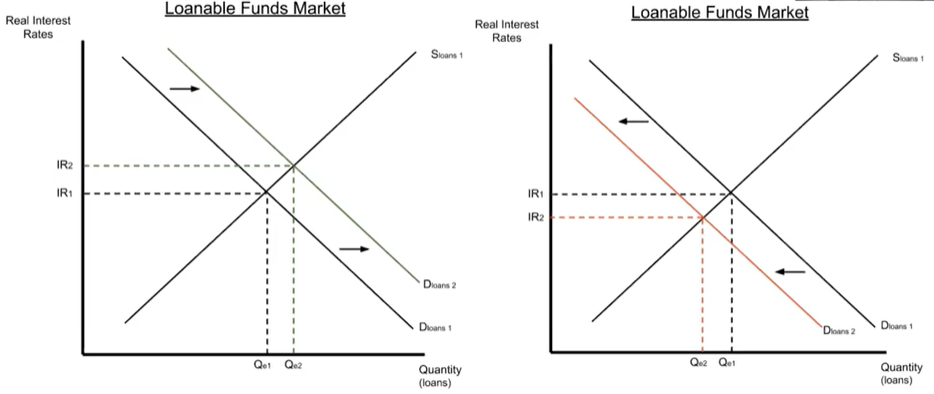
- Left graph:
- Higher expected return on investment, economy doing well, higher income, etc
- Demand for loans increases (shifts right)
- Equilibrium interest rate increases
- Right graph:
- Lower expected return on investment, recession, people losing jobs, etc
- Demand for loans decreases (shifts left)
- Equilibrium interest rate decreases
Changes in ^^supply^^ of loanable funds: shifted by changes in savers’ behavior
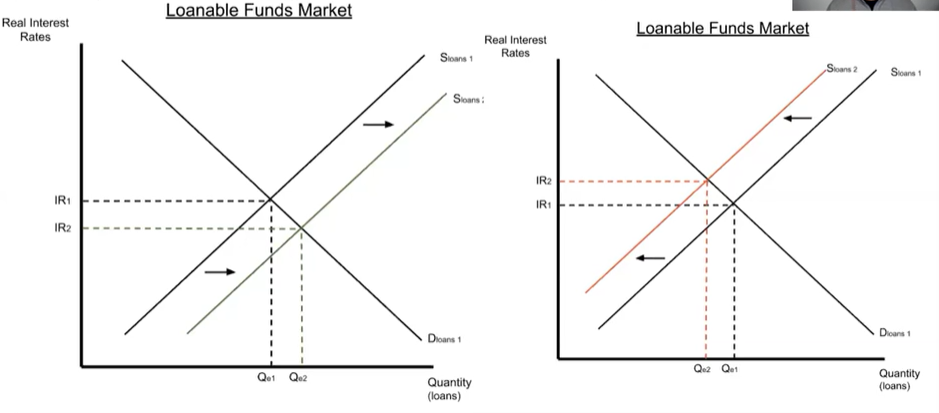
- Saving refers to people keeping their money in banks instead of spending it
- Left graph:
- Saving increases
- supply for loans increases (shifts right)
- Equilibrium interest rate decreases
- Right graph:
- Saving decreases
- supply for loans decreases (shifts left)
- Equilibrium interest rate increases