QMS Module 1
RAN OUT OF PRACTICE TESTS, SORRY :(
Introduction to Quality Management and Improvement
Quality
relating to one or more desirable characteristics that a product or service should have
an important consumer decision factor in selecting competing products and services
understanding it is the key to business success, growth, and enhanced competitiveness
increased quality provides a substantial return on investment
Garvin’s Dimensions of Quality
Performance
Reliability
Durability
Serviceability
Aesthetics
Features
Perceived Quality
Conformance to Standards
Dimensions of Service Quality
Responsiveness
Professionalism
Attentiveness
Quality’s Traditional Meaning: Fitness for use; focuses on products/services meeting user requirements
Two Aspects of Quality
Quality of design - how a product is planned and made to stand out.
Quality of conformance - how well the product matches its original design.
Quality’s Modern Meaning: It is inversely proportional to variability; quality improves when there is less unwanted variability in the product’s key characteristics.
Quality Engineering Terminology
Critical-to-Quality (CTQ) Characteristics: Elements of a product that determine how well it meets user or consumer expectations.
Types of Quality Characteristics
Physical
Sensory
Time Orientation
Quality Engineering: involves operational, managerial, and engineering activities designed to ensure that the quality characteristics of a product meet the required levels and that variability is minimized.
Statistical methods are essential for describing and managing variability in quality improvement efforts.
Types of data:
Variable data - discrete data
Attribute data - continuous measurements
Specifications: these define the desired measurements and performance levels for a specific quality characteristic of a product or service.
Nominal or Target value: The ideal or desired value for a quality characteristic set by design engineers.
Specification Limits:
Upper Specification Limit
Lower Specification Limit
Over-the-wall approach: A traditional design method where engineers set specifications without fully considering manufacturing processes or variability.
Concurrent Engineering: A team approach to design, with specialists in manufacturing, quality engineering, and other disciplines working together with the product designer at the earliest stages of the product design process.
A Brief History of Quality Control and Improvement
Early Development in Quality (Pre-1900s)
Fredrick W. Taylor
Introduced scientific management principles.
Focused on task division, enhancing productivity and quality.
Impact: Standardization of work methods.
Frank and Lillian Gilbreth
Extended work on motion study and work design.
Issue: Early emphasis was more on productivity than quality.
Walter A. Shewhart (1924)
Developed the statistical control chart.
Significance: Marked the formal beginning of statistical quality control.
Harold F. Dodge and Harry G. Romig (Late 1920s)
Developed acceptance sampling as an alternative to 100% inspection.
Widespread use in Western Electric by the 1930s.
Growth During WWII
Expanded use of statistical quality control in manufacturing
The American Society for Quality Control was created in 1949
They promoted quality improvement techniques in various industries
Advancements in the 50s-60s
The emergence of reliability engineering
The introduction of designed experiments in the 1950s, these were initially applied in the chemical industry and strengthened the US chemical industry’s competitiveness
Global Influence and Japanese Methods
1970s-1980s
Western companies realized Japanese competitors used designed experiments since the 1960s.
Applications in process improvement, new product design, and reliability enhancement
These resulted in those methods being adopted in the West
Global Influence and Japanese Methods
Post-1980s Growth
There was a profound increase in the use of statistical methods for quality and business improvement in the US, which helped their automobile industry from the brink of collapse
Management frameworks began to emerge for implementing quality improvement
Statistical Methods for Quality Control and Improvement
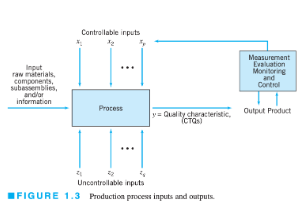
Process as a System

Inputs: Controllable factors (x1, x2, ... xp): Process variables (e.g., temperatures, pressures, feed rates).
Uncontrollable factors (z1, z2, ... zq): Environmental factors, raw material properties.
Output: Quality characteristic (y) – A measure of process and product quality.
Control Charts
Control charts are used as a primary SPC technique
They plot the averages of measurements of a quality characteristic in samples taken from the process vs. time or sample number
Components include:
Center line (CL): represents the expected average value of the quality characteristic
Upper control limit (UCL) and lower control limit (LCL): these define the boundaries within which the process should operate if there are no unusual variations
Designed experiments
Designed experiments systematically vary controllable input factors to understand their impact on output quality characteristics. This helps in identifying key variables affecting process performance and product quality.
Types of designed experiments:
Factorial Design Types
Two-Factor Example (2^2): Four combinations of low and high levels for two factors.
Three-Factor Example (2^3): Eight combinations for three factors, arranged in a cube.
Benefits:
Reducing variability
Improving quality
May lead to performance breakthroughs
Acceptance Sampling
The inspection and classification samples from a larger batch to decide if the whole lot should be accepted or rejected
Types of acceptance sampling:
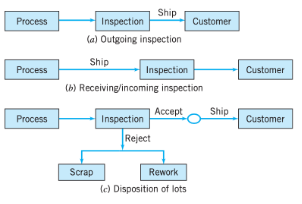
Outgoing: Conducted post-production, before shipping.
Incoming: Applied to batches received from suppliers.
Rectifying: Involves scrapping, recycling, reworking, or replacing rejected units.

Evolution of Quality Techniques
Early Stage: Reliance on acceptance sampling and inspection.
Intermediate Stage: Increased use of sampling inspection with the realization that quality can’t be solely inspected into products.
Advanced Stage: Emphasis on process improvement through Statistical Process Control (SPC) and designed experiments.
Management Aspects of Quality Improvement
3 Main Activities of QMS
Quality Planning
Involves identifying customers, both internal and external, and identifying their needs
Products or services that meet or exceed customer expectations must be developed
It prevents wasted resources on defects, complaints, and failures
Quality Assurance
The set of activities that ensures the quality levels of products and services are properly maintained and that supplier and customer quality issues are properly resolved
Key components include:
Documentation:
Policy
Procedures
Work instructions and specifications
Records
Document control
Quality Control and improvement
SPC and designed experiments are major tools of this
Quality Philosophy and Management Strategies
Key Figures in Quality Management
W. Edwards Deming (1900-1993)
Background: Educated in engineering and physics at the University of Wyoming and Yale University.
Influences: Greatly influenced by Walter A. Shewhart, known for developing the control chart.
Career: Worked at Western Electric, held government positions, and contributed significantly during WWII.
Impact on Japan: Post-war consultant to Japanese industries, advocating for statistical methods, which fueled Japan’s industrial growth. The Deming Prize was established in his honor.
Philosophy: Emphasized that quality improvement is primarily the responsibility of management, not the workforce; critiqued traditional American management practices.
Deming’s 14 Points (Summarized, sir’s PowerPoint as reference)
Long term focus
Commit to quality
Prevent problems; don’t rely on mass inspections
Choose suppliers over quality, not price
Focus on continuous improvement
Train your people
Help, don’t micromanage
Create a safe environment for your employees; drive out fear
Encourage teamwork; break down barriers between departments
Avoid empty slogans
Stop using quotas
Remove obstacles
Educate everyone
Leadership should commit to the past 13 points
Deming’s 7 Deadly Diseases of Management
Lack of constancy of purpose
Emphasis on short-term profits
Performance evaluation issues
Management mobility
Running a company of visible figures alone
Excessive medical costs
Excessive legal damage rewards
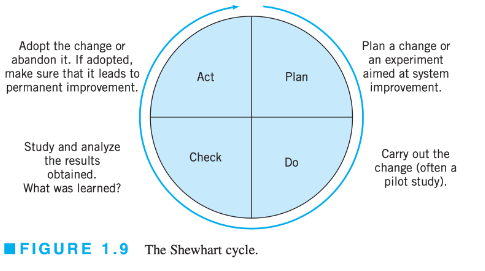
The Shewhart Cycle (PDCA)

Deming’s Obstacles
Automation as a solution
Copying existing solutions
“Our problems are different”; ignoring universal principles
Outdated education
Poor use of statistics
Relying on inspection
Quality as a departmental task
Blaming workers
False starts
The fallacy of zero defects
Inadequate Prototype Testing
External Help Misconception
Joseph M. Juran (1904-2008)
Pioneer in Quality Management: Key figure in the development of quality control and improvement, influenced by Walter A. Shewhart.
Career Highlights: Chief industrial engineer at Western Electric, simplified processes during WWII, and led NYU’s Department of Administrative Engineering. A key influencer in Japan's industrial rise.
Major Contributions: Co-authored the Quality Control Handbook and founded the Juran Institute.
Juran Trilogy: Focuses on three pillars—Planning, Control, and Improvement—emphasizing project-based quality improvement, either through continuous or breakthrough efforts.
Armand V. Feigenbaum (1920-2014)
Concept of Total Quality Control: Introduced in his 1951 book Total Quality Control, which greatly influenced early quality management practices in Japan.
Three-Step Approach: Emphasized quality leadership, quality technology (statistical methods and technical tools), and organizational commitment.
Organizational Focus: Advocated for a systems approach to quality improvement, highlighting the importance of management commitment and a structured process for successful implementation.
19-Step Improvement Process: Proposed a detailed framework for quality improvement, with statistical methods as a key component. Initially suggested centralizing technical expertise in a specialized department.
Total Quality Management (TQM)
A strategy for implementing and managing quality improvement activities on an organizational basis
Began in the 1980s with Deming and Juran’s philosophies as a focal point
Key elements of TQM include:
Customer focus
Workforce engagement
Supplier Improvement
Integration with business goals
Quality Systems and Standards
The International Standards Organization (ISO)
Founded in 1946 in Geneva, Switzerland
They establish standards for quality systems; the ISO 9000 series is their most widely adapted, it includes:
ISO 9000: Fundamentals and Vocabulary
ISO 9001: Quality Management System Requirements
ISO 9004: Quality Management System - Guidelines for performance improvement
The ISO 9000 series is also an American National Standards Institute and an ASQ Standard
The ISO Certification Process involves selecting a registrar, preparing for audits, and ensuring compliance with the standard’s clauses (e.g., management responsibility, resource management)
Challenges of ISO Certificatio:
Heavy emphasis on paperwork and documentation
Lack of emphasis on variability reduction and process improvement
Other ISO certified organizations have still faced challenges despite being certified
ISO certification has been criticized for being costly without much actual impact on quality improvement, which suggests that companies might benefit more from focusing on internal quality standards
Malcolm Balridge National Quality Award (MBNQA)
Established by the US Congress is 1987
Given annually to recognize US organizations for performance excellence
Administered by the National Institute of Standards and Technology (NIST)
Categories of award:
Manufacturing
Service
Small Business
Healthcare
Education
Six Sigma
A quality methodology developed by Motorola in the 1980s as a response to customer demand
Focuses on reducing variability in key product quality characteristics to the level where failure or defects are extremely unlikely
Three Sigma Quality
Specification limits are three standard deviations from the mean; probability of producing a product within specifications is 0.9973, which corresponds to 2,700 ppm defective
Six Sigma Quality
The probability that any specific unit of a hypothetical product is non-defective is 0.2 ppm
However, predictions can only be made of process performance when the process is stable or mean and standard
The Link Between Quality and Productivity
Producing high-quality products is challenging in today’s rapidly evolving industrial environment. Technology advances in fields like electronics, metallurgy, and biotechnology complicate product design and manufacturing.
Challenges in Balancing Quality and Productivity
Rapid technological advancements require:
the quick integration of new technologies for competitive advantage
the optimization of processes for economy, efficiency, productivity, and quality
Without focusing on all dimensions, companies face higher costs and reduced productivity
Quality Costs
Financial controls in business management often overlook quality costs.
Why do quality costs matter?
Products are becoming more complex because of technological advances
There is more awareness of life-cycle costs (maintenance, spare parts, failures)
Quality engineers can communicate better with management using cost metrics
Categories of quality cost:
Prevention costs: costs associated with avoiding defects
New products review
Product or process design
Process control
Burn-in
Training
Quality data acquisition
Appraisal costs
Inspection or testing of incoming materials
Product inspections throughout production
Calibration and maintenance of testing equipment
Internal failure costs
Scrap
Rework
Retesting
Downtime
Yield Losses
External failure costs
Complaint adjustments
Returned products
Warranty changes
Liability costs
Indirect costs
Quality costs can range from 4% to 40% of sales depending on the
industry.
Prevention and appraisal investments reduce internal/external failure
costs.
Pareto analysis can be used to identify key areas for quality improvement.