pV Graphs
Equation - U = Q - W
The equation ( U = Q - W ) relates internal energy (U), heat added to the system (Q), and work done by the system (W).
Mind Map: pV Graphs and Relevant Information
Main Branches
1. Definition of pV Graphs
Pressure-Volume (pV) representation
Visualizes thermodynamic processes
Relationship between pressure (p) and volume (V)
2. Types of Processes
Isothermal Process
Constant temperature
Hyperbolic curve
Adiabatic Process
No heat exchange
Steeper curve than isothermal
Isobaric Process
Constant pressure
Horizontal line
Isochoric Process
Constant volume
Vertical line
3. Area Under the Curve
Represents work done (W)
Positive area: work done by the system
Negative area: work done on the system
4. First Law of Thermodynamics
Equation: ΔU = Q - W
ΔU: Change in internal energy
Q: Heat added to the system
W: Work done by the system
Implications of pV graphs on ΔU
Work done affects internal energy changes
Heat transfer influences system state
5. Key Concepts Deduced from pV Graphs
Work Calculation
Area under the process curve
Heat Transfer Analysis
Relationship between Q and W
Internal Energy Changes
Understanding system behavior during processes
6. Applications of pV Graphs
Engine cycles (e.g., Carnot, Otto)
Refrigeration cycles
Understanding real gases vs. ideal gases
Conclusion
pV graphs are essential tools in thermodynamics, providing insights into work, heat transfer, and internal energy changes during various processes.
Basic analysis of a pV graph:
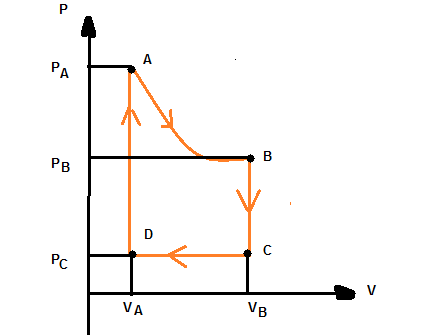
AB: Isometric Process
isometric Process - temperature remains constant.
Pressure increases
Volume Decreases
Temperature is constant
Transfer of heat in/out system so slow, thermal equilibrium is maintained
Work done by system
Since U = 0, W = Q
Effects on U = Q - W:
Internal Energy (U): For an ideal gas, internal energy depends only on temperature. Since temperature is constant, ( U ) does not change. = 0
Heat (Q): Heat must be added to the system to maintain constant temperature as pressure increases and volume decreases. So, +ve
Work (W): Work done on the system is positive when volume decreases.
+ve
Thus, in this scenario, ( Q ) must equal ( W ) to keep ( U ) constant.
BC: Isochoric Process
Isochoric Process - Volume remains constant
Volume Constant, W = 0
Pressure Decreasing
Temperature Constant
Heat flows out the system, so Q = -ve
No work done so U = Q
Therefore as Q = -ve, U = -ve
CD: Isobaric Process
Isobaric Process - Pressure remains constant
Pressure constant
Volume decreasing
Temperature decreasing
Gas contracting so work being done on system, W = -ve
Heat flows out, Q = -ve
Since temperature is decreasing, U = -ve
DA: Isochoric Process
Isochoric Process - Volume remains constant
Volume Constant, W = 0
Pressure increasing
Temperature Constant
Heat flows into the system, so Q = +ve
No work done so U = Q
Therefore as Q = +ve, U = +ve
Adiabatic Process
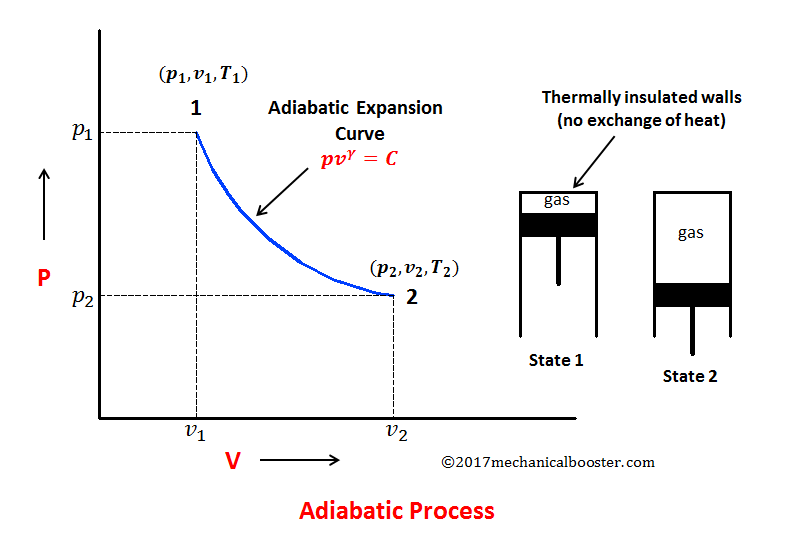
Adiabatic Process - heat exchange is zero
Volume Increases,
Pressure decreases
Temperature Increases
The adiabatic equation describes these relationships:
PVγ = constant
Since an adiabatic process has no heat transfer (Q = 0), the equation simplifies to:
ΔU = −W
If work is done on the gas (compression), internal energy increases, leading to a rise in temperature.
If work is done by the gas (expansion), internal energy decreases, causing a drop in temperature.
This shows that in an adiabatic process, all energy changes come from work done, not from heat exchange.