Investment risk
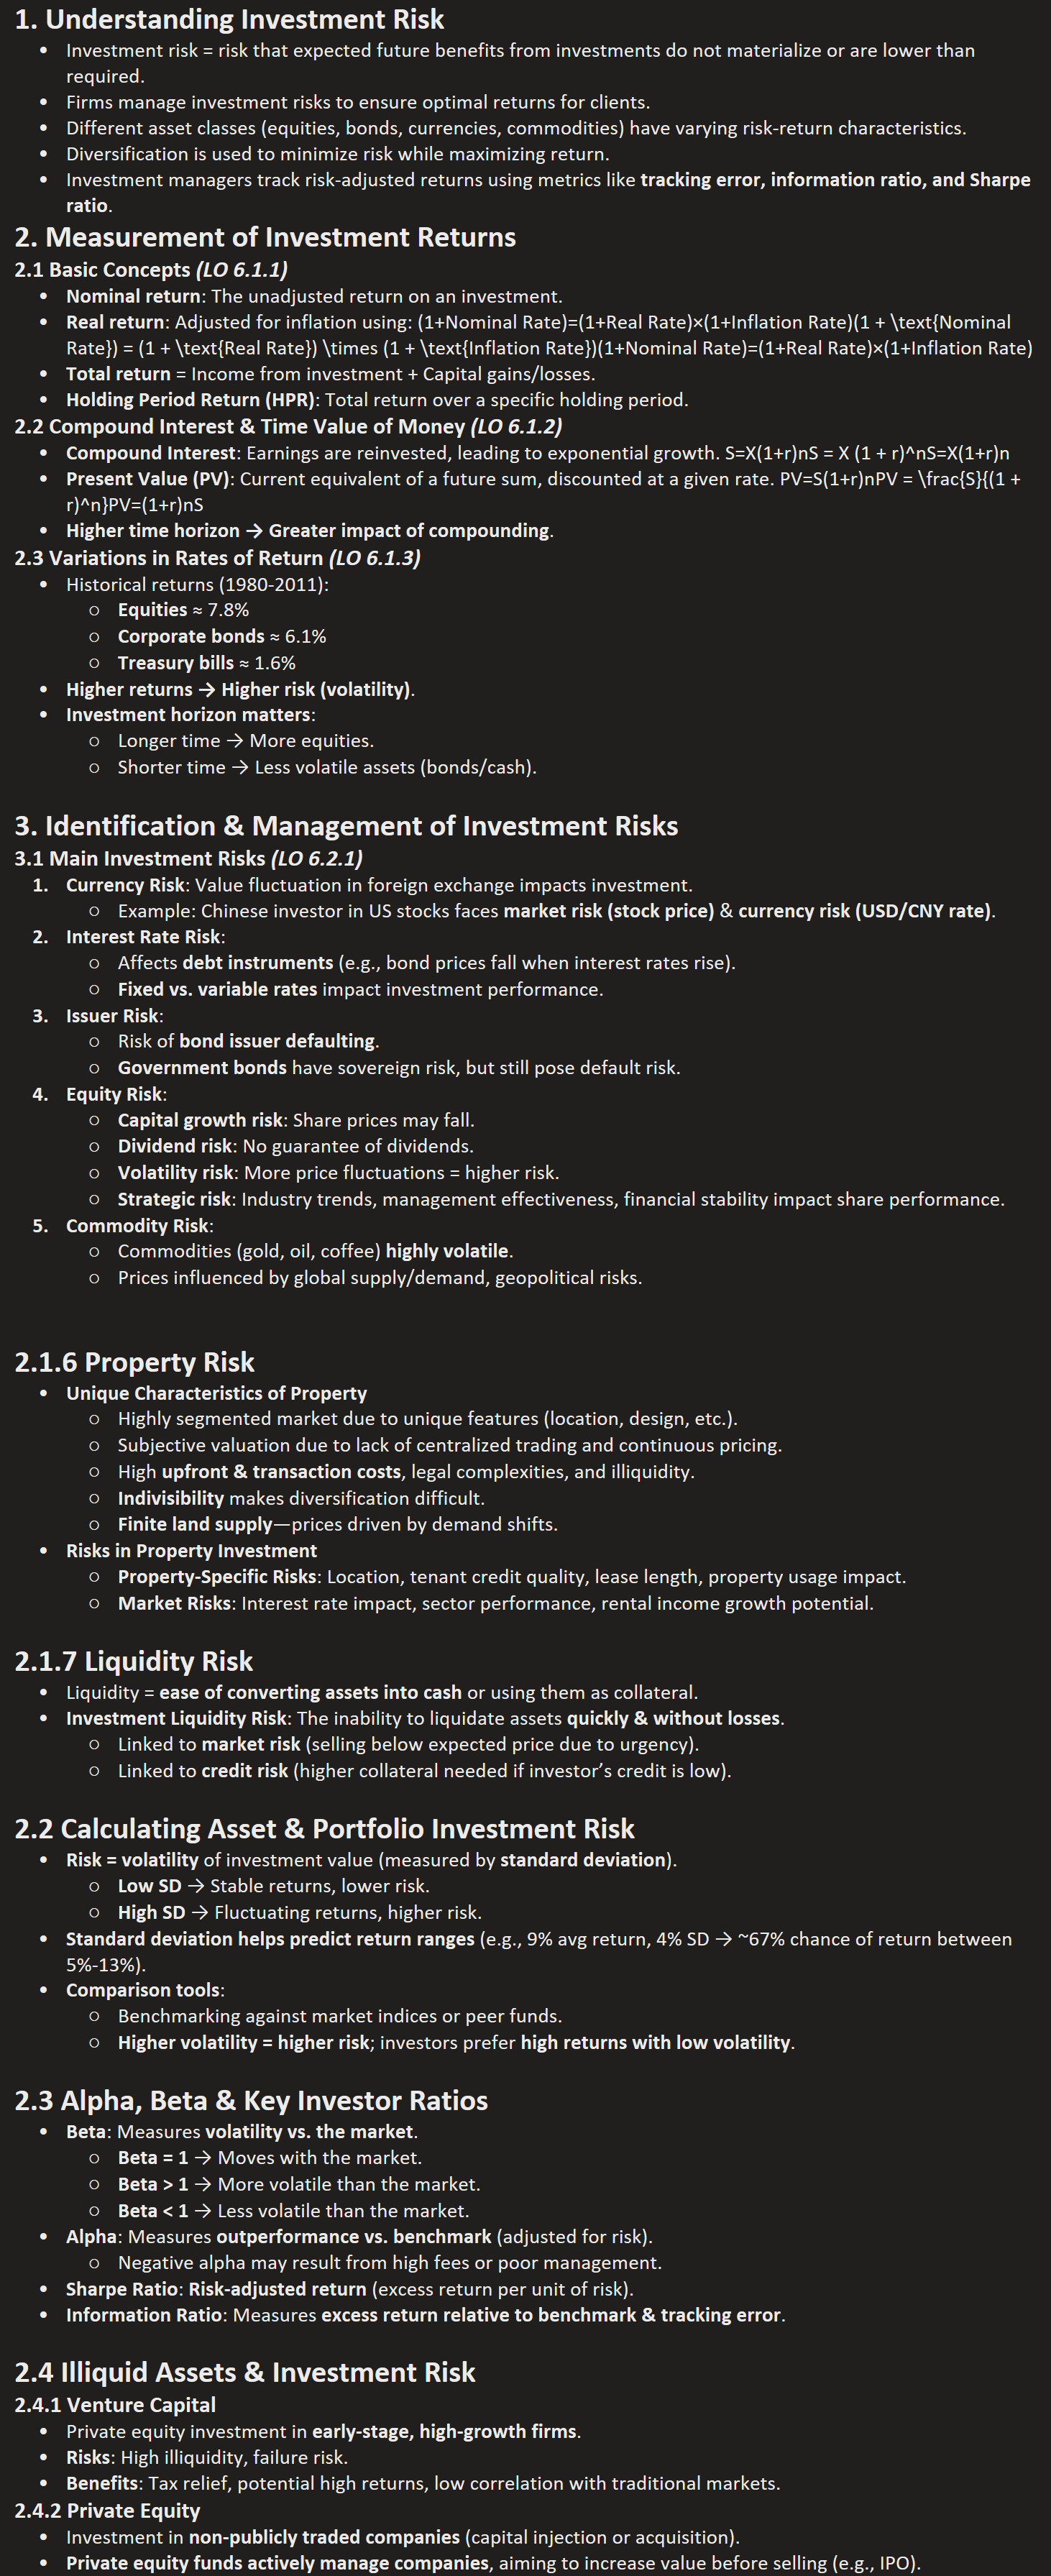
1. Understanding Investment Risk
Investment risk = risk that expected future benefits from investments do not materialize or are lower than required.
Firms manage investment risks to ensure optimal returns for clients.
Different asset classes (equities, bonds, currencies, commodities) have varying risk-return characteristics.
Diversification is used to minimize risk while maximizing return.
Investment managers track risk-adjusted returns using metrics like tracking error, information ratio, and Sharpe ratio.
2. Measurement of Investment Returns
2.1 Basic Concepts (LO 6.1.1)
Nominal return: The unadjusted return on an investment.
Real return: Adjusted for inflation using: (1+Nominal Rate)=(1+Real Rate)×(1+Inflation Rate)(1 + \text{Nominal Rate}) = (1 + \text{Real Rate}) \times (1 + \text{Inflation Rate})(1+Nominal Rate)=(1+Real Rate)×(1+Inflation Rate)
Total return = Income from investment + Capital gains/losses.
Holding Period Return (HPR): Total return over a specific holding period.
2.2 Compound Interest & Time Value of Money (LO 6.1.2)
Compound Interest: Earnings are reinvested, leading to exponential growth. S=X(1+r)nS = X (1 + r)^nS=X(1+r)n
Present Value (PV): Current equivalent of a future sum, discounted at a given rate. PV=S(1+r)nPV = \frac{S}{(1 + r)^n}PV=(1+r)nS
Higher time horizon → Greater impact of compounding.
2.3 Variations in Rates of Return (LO 6.1.3)
Historical returns (1980-2011):
Equities ≈ 7.8%
Corporate bonds ≈ 6.1%
Treasury bills ≈ 1.6%
Higher returns → Higher risk (volatility).
Investment horizon matters:
Longer time → More equities.
Shorter time → Less volatile assets (bonds/cash).
3. Identification & Management of Investment Risks
3.1 Main Investment Risks (LO 6.2.1)
Currency Risk: Value fluctuation in foreign exchange impacts investment.
Example: Chinese investor in US stocks faces market risk (stock price) & currency risk (USD/CNY rate).
Interest Rate Risk:
Affects debt instruments (e.g., bond prices fall when interest rates rise).
Fixed vs. variable rates impact investment performance.
Issuer Risk:
Risk of bond issuer defaulting.
Government bonds have sovereign risk, but still pose default risk.
Equity Risk:
Capital growth risk: Share prices may fall.
Dividend risk: No guarantee of dividends.
Volatility risk: More price fluctuations = higher risk.
Strategic risk: Industry trends, management effectiveness, financial stability impact share performance.
Commodity Risk:
Commodities (gold, oil, coffee) highly volatile.
Prices influenced by global supply/demand, geopolitical risks.
2.1.6 Property Risk
Unique Characteristics of Property
Highly segmented market due to unique features (location, design, etc.).
Subjective valuation due to lack of centralized trading and continuous pricing.
High upfront & transaction costs, legal complexities, and illiquidity.
Indivisibility makes diversification difficult.
Finite land supply—prices driven by demand shifts.
Risks in Property Investment
Property-Specific Risks: Location, tenant credit quality, lease length, property usage impact.
Market Risks: Interest rate impact, sector performance, rental income growth potential.
2.1.7 Liquidity Risk
Liquidity = ease of converting assets into cash or using them as collateral.
Investment Liquidity Risk: The inability to liquidate assets quickly & without losses.
Linked to market risk (selling below expected price due to urgency).
Linked to credit risk (higher collateral needed if investor’s credit is low).
2.2 Calculating Asset & Portfolio Investment Risk
Risk = volatility of investment value (measured by standard deviation).
Low SD → Stable returns, lower risk.
High SD → Fluctuating returns, higher risk.
Standard deviation helps predict return ranges (e.g., 9% avg return, 4% SD → ~67% chance of return between 5%-13%).
Comparison tools:
Benchmarking against market indices or peer funds.
Higher volatility = higher risk; investors prefer high returns with low volatility.
2.3 Alpha, Beta & Key Investor Ratios
Beta: Measures volatility vs. the market.
Beta = 1 → Moves with the market.
Beta > 1 → More volatile than the market.
Beta < 1 → Less volatile than the market.
Alpha: Measures outperformance vs. benchmark (adjusted for risk).
Negative alpha may result from high fees or poor management.
Sharpe Ratio: Risk-adjusted return (excess return per unit of risk).
Information Ratio: Measures excess return relative to benchmark & tracking error.
2.4 Illiquid Assets & Investment Risk
2.4.1 Venture Capital
Private equity investment in early-stage, high-growth firms.
Risks: High illiquidity, failure risk.
Benefits: Tax relief, potential high returns, low correlation with traditional markets.
2.4.2 Private Equity
Investment in non-publicly traded companies (capital injection or acquisition).
Private equity funds actively manage companies, aiming to increase value before selling (e.g., IPO).
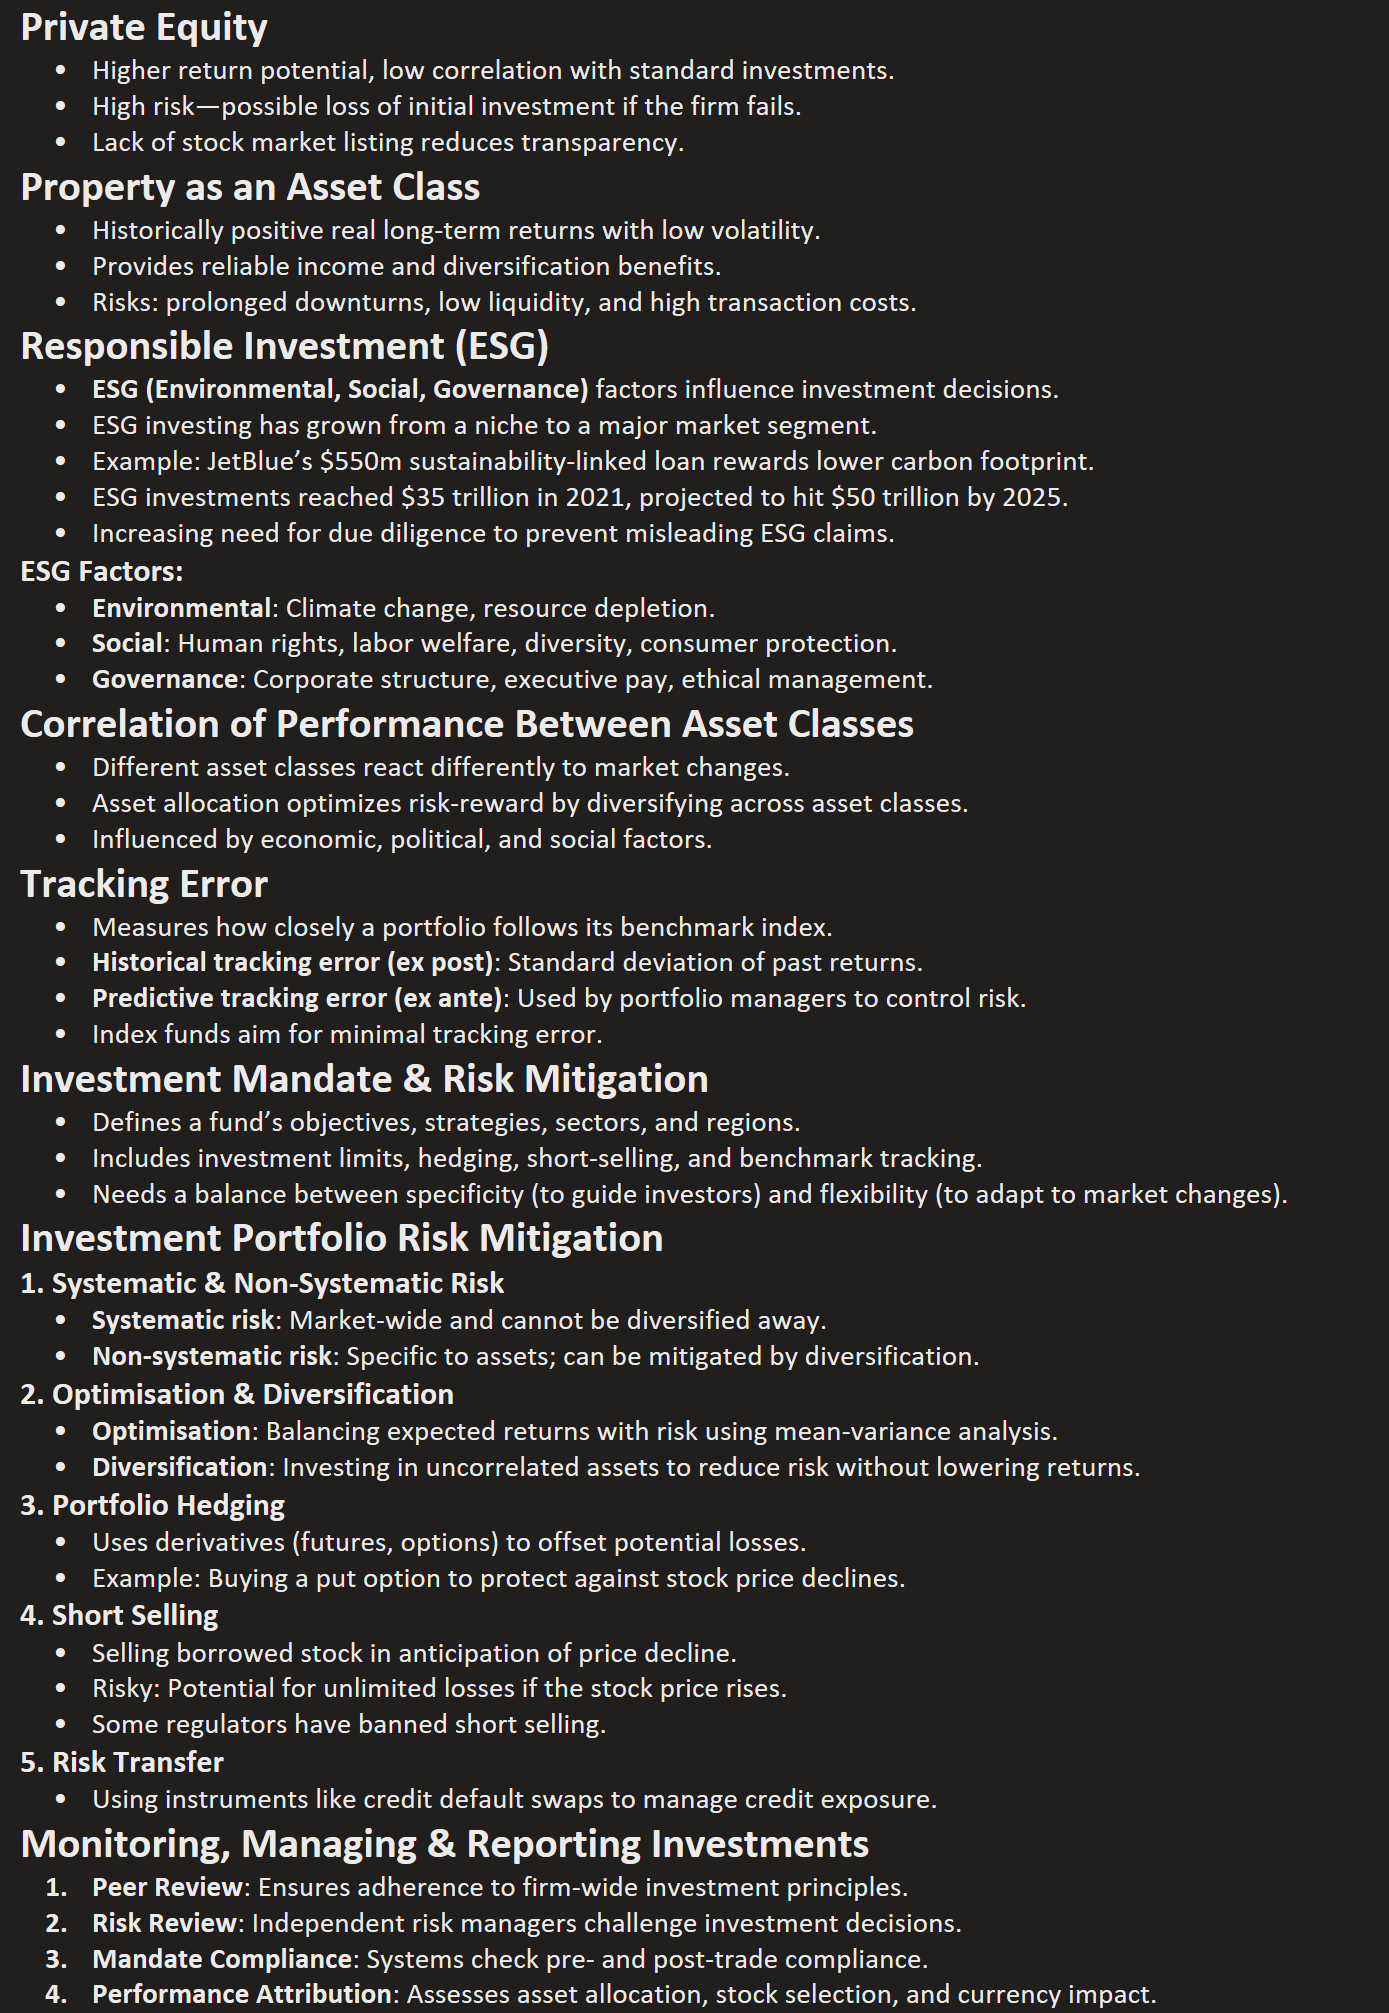
Private Equity
Higher return potential, low correlation with standard investments.
High risk—possible loss of initial investment if the firm fails.
Lack of stock market listing reduces transparency.
Property as an Asset Class
Historically positive real long-term returns with low volatility.
Provides reliable income and diversification benefits.
Risks: prolonged downturns, low liquidity, and high transaction costs.
Responsible Investment (ESG)
ESG (Environmental, Social, Governance) factors influence investment decisions.
ESG investing has grown from a niche to a major market segment.
Example: JetBlue’s $550m sustainability-linked loan rewards lower carbon footprint.
ESG investments reached $35 trillion in 2021, projected to hit $50 trillion by 2025.
Increasing need for due diligence to prevent misleading ESG claims.
ESG Factors:
Environmental: Climate change, resource depletion.
Social: Human rights, labor welfare, diversity, consumer protection.
Governance: Corporate structure, executive pay, ethical management.
Correlation of Performance Between Asset Classes
Different asset classes react differently to market changes.
Asset allocation optimizes risk-reward by diversifying across asset classes.
Influenced by economic, political, and social factors.
Tracking Error
Measures how closely a portfolio follows its benchmark index.
Historical tracking error (ex post): Standard deviation of past returns.
Predictive tracking error (ex ante): Used by portfolio managers to control risk.
Index funds aim for minimal tracking error.
Investment Mandate & Risk Mitigation
Defines a fund’s objectives, strategies, sectors, and regions.
Includes investment limits, hedging, short-selling, and benchmark tracking.
Needs a balance between specificity (to guide investors) and flexibility (to adapt to market changes).
Investment Portfolio Risk Mitigation
1. Systematic & Non-Systematic Risk
Systematic risk: Market-wide and cannot be diversified away.
Non-systematic risk: Specific to assets; can be mitigated by diversification.
2. Optimisation & Diversification
Optimisation: Balancing expected returns with risk using mean-variance analysis.
Diversification: Investing in uncorrelated assets to reduce risk without lowering returns.
3. Portfolio Hedging
Uses derivatives (futures, options) to offset potential losses.
Example: Buying a put option to protect against stock price declines.
4. Short Selling
Selling borrowed stock in anticipation of price decline.
Risky: Potential for unlimited losses if the stock price rises.
Some regulators have banned short selling.
5. Risk Transfer
Using instruments like credit default swaps to manage credit exposure.
Monitoring, Managing & Reporting Investments
Peer Review: Ensures adherence to firm-wide investment principles.
Risk Review: Independent risk managers challenge investment decisions.
Mandate Compliance: Systems check pre- and post-trade compliance.
Performance Attribution: Assesses asset allocation, stock selection, and currency impact.