Economics HL Unit 3
Equality and Equity
Equity → income inequalities are needed to create incentive
Equality → equal distribution of income (minimizing income gap)
Market is unable to achieve equity
Equity → concept/idea of fairness; normative, means different things to different people
inequity is not inequality → distribution of wealth, income, or human opportunity
National Income Accounting
used to measure amount of economic activity in a country
money value of all goods and services produced in a year
can be measured through things like GDP
output method
actual value of all finished goods and services produced each year
prevents double counting
measures level of economic activity
income method
calculates the value of all factor incomes earned in the economy
sum of wages and salaries (labour), rent (land), interest (capital), profits (enterprise) → factors of production
national income (Y) → households receive factor incomes for output produced
expenditure method
total value of all spending
total spending on all newly produced goods and services
comprising C, I, G, and (X-M)
C → spending by individuals and households (largest component)
I → spending by all firms (gross fixed capital formation)
G → spending of the public sector
(X-M) → import expenditure
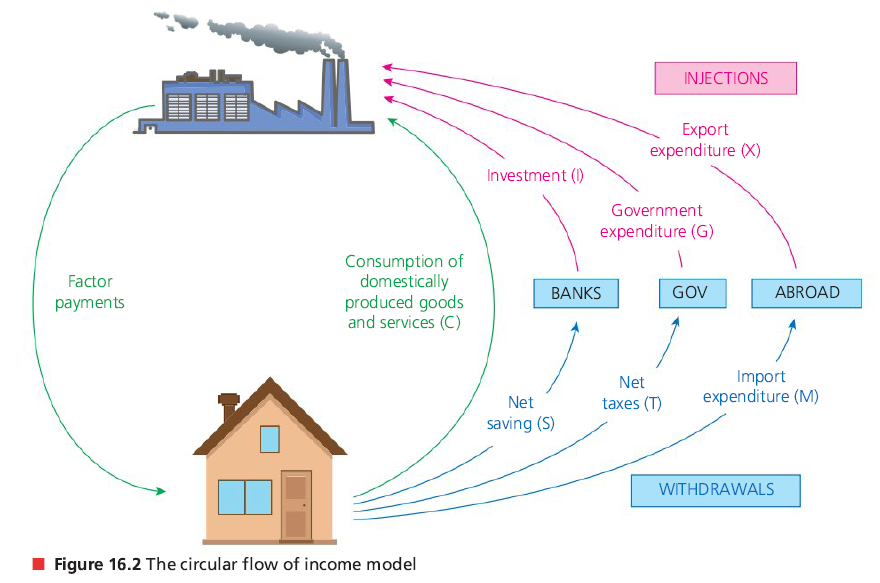
Circular flow of income
injections → add money to increase size (inc. in G, I, X)
leakages → remove money to reduce size (inc. in savings, tax, import)
Gross National Income (GNI)
GNI = GDP + (income earned abroad) - (income sent abroad)
Aggregate Demand (AD)
AD is the total demand for all goods and services in an economy at any given average price level
value often calculated using expenditure approach
AD = C+I+G+(X-M)
if AD has increased, economic growth has occured (and vice versa)
a 1% increase in C or G is much more significant than a 1% increase in (X-M)
AD curve is downward sloping
whenever there is a change in average price level, there is movement along the AD curve
if there is a change in any non-price determinants of AD, the AD curve shifts
increase in the non-price determinants results in a rightward shift
at every price level, real GDP has increased
Factors of Aggregate Demand
consumption (C)
consumer confidence →
interest rates ←
wealth →
income taxes ←
level of household debt ←
expectations of future price levels →
investment (I)
interest rates ←
business confidence →
technology →
business taxes ←
level of corporate debt ←
government spending (G)
political priorities
economic priorities
net exports (X-M)
income of trading partners →
exchange rates ←
trade policies
Real GDP and GNI
adjusted for inflation
calculated using a price deflator (GDP deflator)
converts current prices to constant prices
Real GDP = (nominal GDP / GDP deflator) * 100
Real GNI = Real GDP + net income earned abroad
Real GDP per capita = Real GDP / population
Real GNI per capita = Real GNI / population
purchasing power parity (ppp)
used to calculate relative purchasing power of different currencies
shows number of units of a country’s currency that are required to buy a product in the local economy, as $1 would buy the same product in the USA
Business Cycle
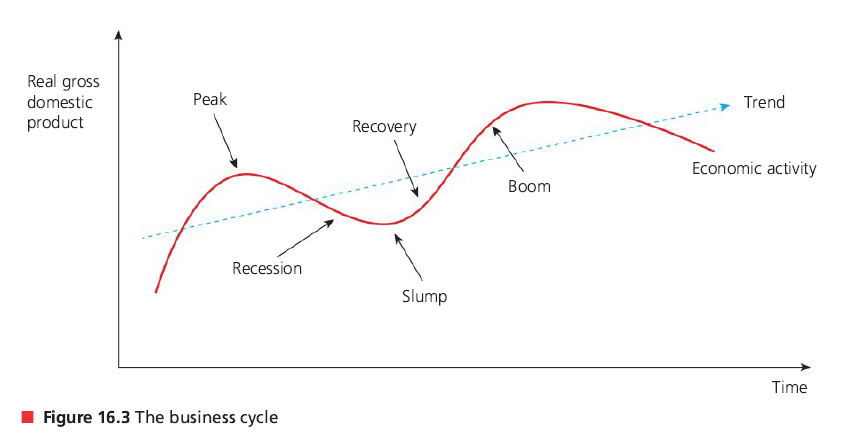
Recession
two or more consecutive quarters (6 months) of negative economic growth
increasing/high unemployment
increasing negative output gap and spare production capacity
low confidence for firms and households
low inflation
increase in government expenditure (great budget deficit)
Boom
increasing/high rates of economic growth
decreasing unemployment, increasing job vacancies
reduction of negative output gap or creation of positive output gap
spare capacity reduced/eliminated
high confidence = riskier decisions
increasing rates of inflation → usually demand-pull
Alternative Measures of Well-being
OECD Better Life Index → 11 factors
Housing
Jobs
Income
community
education
environment
civil engagement
health
life satisfaction
safety
work-life balance
The Happiness Index → 14 factors (scale from 0-10)
business and economic
citizen engagement
communications and technology
diversity (social issues)
education and families
emotional well-being
environment and energy
food and shelter
government and politics
law and order (safety)
health
religion and ethics
transportation
work (employment)
The Happy Planet Index → 4 factors
well-being → how citizens feel about their life overall (0-10)
life-expectancy → number of years a person is expected to live
inequality of outcomes → inequalities of people in a country (well-being, etc.)
ecological footprint → impact a person has on an environment
Aggregate Demand (AD) Curve
negative relationship between price levels and real GDP
wealth effect
when price levels increase, real value of wealth decreases, decreasing consumer confidence thus reducing demand/output
interest rate effect
increase in price levels leads to a fall in output demanded due to interest rates increasing because of an increased need for money
international trade effect
rising price level causes a fall in exports and a rise in imports due to domestic price increasing but others stay the same
Short Run (SR) and Long Run (LR)
SR in macroeconomics in the period of time when prices of resources are rougly constant/inflexible, in spite of changes in the price level
LR in macroeconomics is the period of time where prices of all resources (labour/wages) are flexible and change with changes in the price level
wages account for the largest part of the firm’s costs of production
SRAS - short run aggregate supply
profitability causes positive relationship between price levels and real GDP (increase in price = increase in output) and with unchanging resource prices, profits increase
Determinants of SRAS:
costs of factors of production
indirect taxes/potential subsidies/supply shocks
LRAS - long run aggregate supply
Monetarist/Neoclassical model
price mechanism
competitive market equilibrium
economy as a harmonious system (automatically tends to full employment)
LRAS is vertical due to changing resource prices
located at Yp (potential GDP) at the full employment level of real GDP
in the LR, economy produces potential GDP, which is independant of the price level
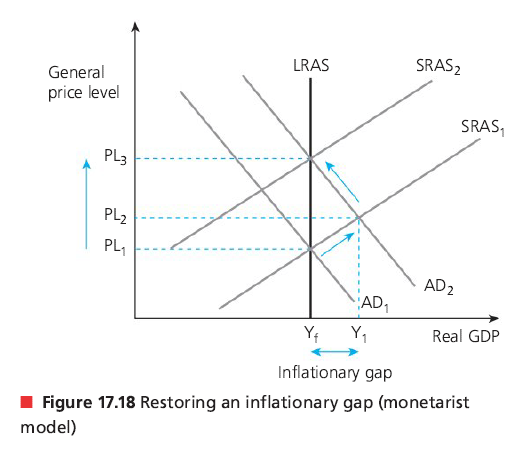
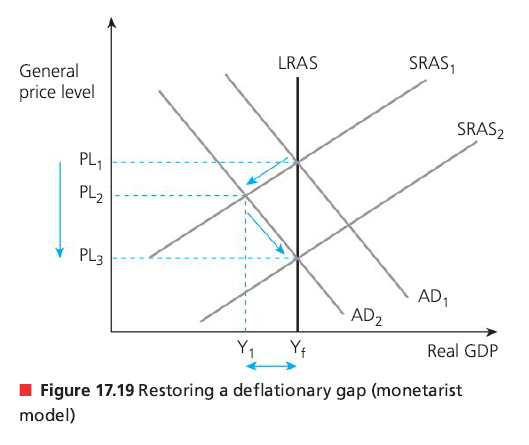
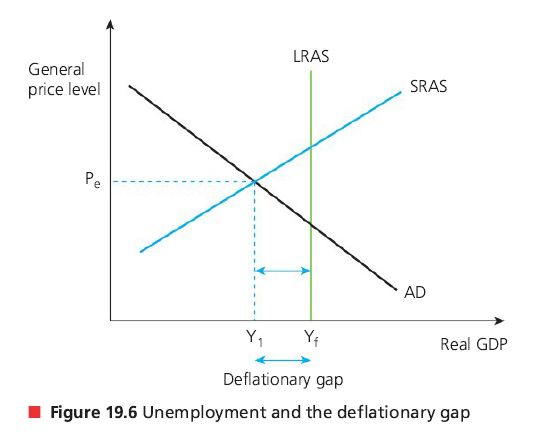
inflationary/deflationary gap - difference between SR and LR equilibrium
inflationary → SR>LR
deflationary → SR<LR
market corrections → either SRAS or AD curve shifts (different price levels, same GDP)
inflationary gap:
deflationary gap:
Keynesian model
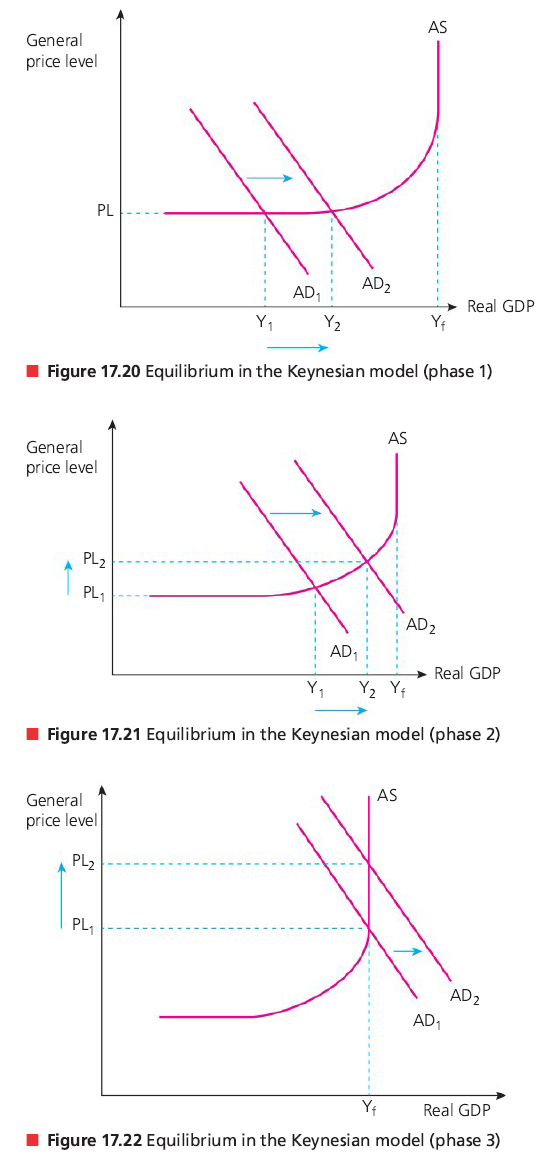
equilibrium at different sections means different things (where AD=AS)
Ymax is where there is full employment
economy can be below full employment level, even in the long run
section 1 → AS is perfectly elastic as there is spare capacity (any increase in demand has no direct impact on general price levels)
section 2 → AS is relatively price elastic (upward sloping) as there is pressure of scarce resources as the economy grows
section 3 → AS is perfectly inelastic as there is no longer any spare capacity (all factor resources are fully employed)
any increase in AD beyond full employment level is inflationary
Shifts of the AS curve
Short run
costs of factors of production / indirect taxes
labour costs - wages/salaries account for a significant portion
raw material costs - increase means increase in costs of production
exchange rate - rise means domestic firms can buy imports at a lower price
interest rates - borrowing
bureaucracy and administration - legal procedures and policies
Long run
changes in economy’s quantity of factors of production
improvements in technology
increases in efficiency
changes in institutions
reductions in natural rate of employment
Long Run Equilibria
full employment is not zero unemployment (unemployment always exists)
frictional → certain number of people are in between jobs
seasonal → redundancies are caused by cyclical factors in the year
structural → skills mismatch in certain industries
Monetarist/Neoclassical model
occurs at full employment level of output (potential output)
Keynesian model
increase in AD increases national output without changing the general price level
increased demand for scarce resources and labour shortages cause general price levels to rise as national output increases
full employment level of output
firms compete for highly limited resources
general price increases but GDP is at its max
Macroeconomic objectives
economic growth
low unemployment
inflation
Economic Growth
maximization of the factors of production → quality + quantity
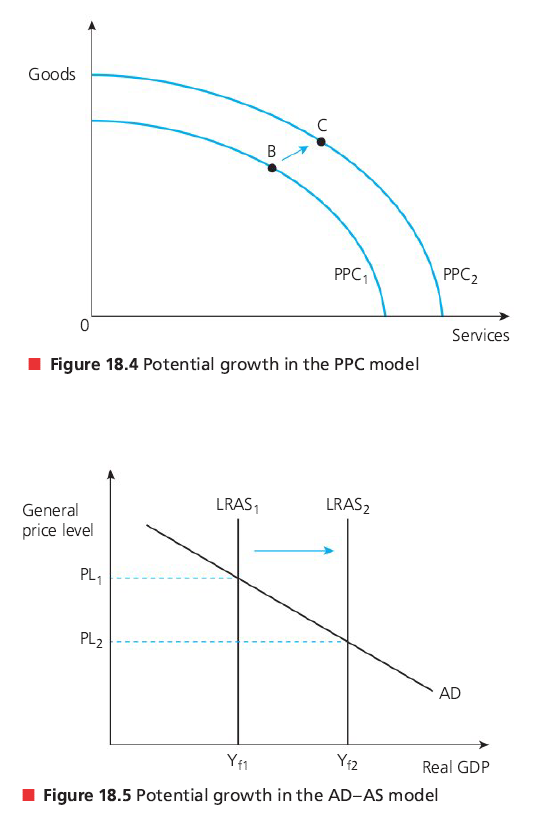
long-term economic growth
above potential level → something is wrong
short-term economic growth
actual output → current level fo real GDP
represented by any point on PPF diagram
actual growth → rate at which actual moves towards potential
short-term → below full level of unemployment
annual percentage change of a country’s output
short-run economic growth
increase in AD (rightrward shift) → Keynesian + Monetarist
increase in SRAS (rightward shift) → Monetarist
long-run economic growth
increase in potential output
achieves both economic growth and full employment
shift of the AS → monetarist + Keynesian
measurements of economic growth
nominal: rate of change in monetary value of GDP
real: accounts for inflation
Consequences of economic growth
living standards
generally leads to higher living standards
higher real income per capita
reduction/elimination of absolute poverty (not able to purchase essential goods)
raises consumption → encourages investment in capital → sustains growth
increased tax revenues (for taxes on expenditure/income) enable government to fund more merit goods
increased consumer spending → higher sales revenue (firms) → greater profits
spending on demerit goods increase → in long run, causes social welfare loss
risk of inflation increases → excessive aggregate demand → negative consequences
environment
creates negative externalities that cause problems to the environment
creates market failures caused by resource depletion
damages social and economic well-being in the long run
resource depletion not always sustainable → intergenerational equities
green GDP → adjustment of a country’s GDP to take into account environment degradation
income distribution
often generates greater disparities in distribution of income/wealth
not everyone benefits from economic growth
example: rich get richer, poor get relatively poorer
greater tax revenues = government redistribution of income/wealth in the economy
Low Unemployment
employment - use of factors of production in the production process
use of labour resources
governments want all available and willing to be employed
formal sector employment → officially recorded employment → workers paying income taxes and contributing to the country’s official GDP
unemployment → exists when forces of demand and supply are in disequilibrium
people are available and willing, seeking work but cannot find a job
inefficiency, non-use of scarce resources in the production process
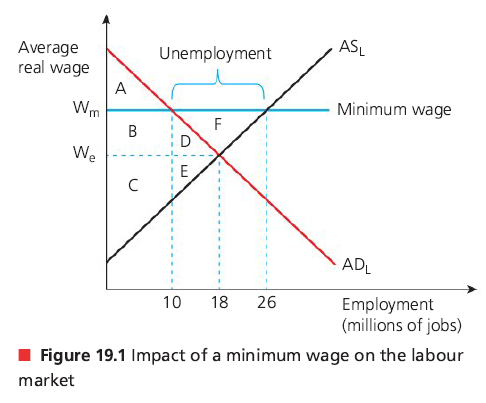
ADL → aggregate demand for labour
ASL → aggregate supply for labour
those who are able and willing to work at the prevailing market equilibrium wage rate (Wc)
A = employer surplus, B+C = employee surplus, D+E = welfare loss, F = welfare supply
complements economic growth → higher employment = greater national expenditure
raises economic well-being and living standards
increases tax revenues for government expenditure on education/healthcare/infrastructure
prevents workers from leaving the country to find better opportunities (brain drain)
Measuring unemployment and unemployment rate
using number of people officialy unemployed as a percentage of the workforce per time period
unemployment rate = (number of employed / labour force) * 100
labour force - employed + self-employed + unemployed
difficulties of measuring unemployment
hidden unemployment / disguised unemployment → not included in the calculation
discouraged workers → unwilling to work but able to
voluntarily unemployed → not actively searching for work
Underemployment
people are inadequately employed → underutilization of labour force
although technically employed, the underemployed are not at their most efficient
cannot fully use their skills/abilities
Disparities
measure of unemployment ignores disparities such as:
regional → different regions have different rates of unemployment
ethnic → ethnic minority groups struggle more to find a job (higher unemployment)
age → unemployment rates are higher for the young/old
gender → females face a higher rate of unemployment
Cyclical Unemployment
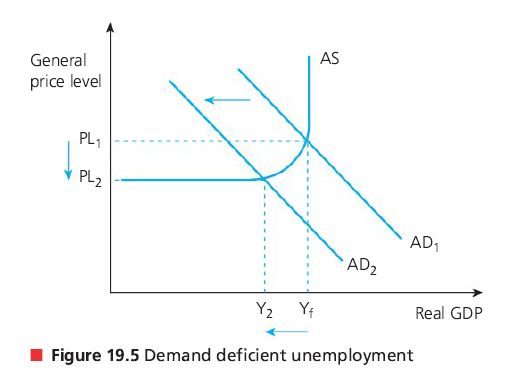
unemployment derived from a downturn in the business cycle (recession)
lack of aggregate demand → fall in national real output → job losses
also referred to as demand deficient unemployment
most severe type of unemployment
results in mass job losses
firms try to control costs, protect profitability, and prevent business failure
represented through a deflationary gap / recessionary gap / negative output gap
difference between full employment and actual level of output (short-run)
closing the gap reduces cyclical unemployment
Natural Rate of Unemployment
equilibrium rate of unemployment
calculating level of unemployment when labour market is in equilibrium
NRU: no involuntary unemployment
some voluntary → some poeple remain out of a job
NRU = structural + seasonal + frictional
Costs of unemployment
personal costs
stress (depression, suicide)
low self-esteem
poverty
family breakdowns
social costs
crime / anti-social behaviour
indebtedness
social deprivation
economic costs
loss of GDP → negative economic growth
loss of tax revenues
increased cost of unemployment benefits
loss of income for individuals
greater disparities in distribution of income and wealth
Low and Stable rate of Inflation
inflation → sustained rise in general price level over time
people spend more to get the same amount
reduces purchasing power and country’s international competitiveness
price stability → general price levels remain broadly constant
net zero inflation, but a low and stable rate
Measuring rate of inflation
consumer price index (CPI) - change in average consumer prices over time
measured on a monthly basis but reported for a twelve month period
collects price data from a range of retail locations
assigns statistical weights (volume + value of quantities purchased)
Limitations of the CPI
atypical households → CPI measures the ‘average’ household
regional/international disparities → prices vary between countries + average household
different income earners → CPI measures average; high income less affected by inflation
changes in product quality → CPI ignores quality
different patterns of consumption → difficult to apply statistical weights in historical data
time lags → due to huge amount of data needed to construct the CPI
volume / value of quantities purchased → uses quantities purchased instead of percentage of income
Causes of inflation
Keynesian - increase in aggregate demand
Monetarist - money supply
demand-pull → AD must be controlled
example: deflationary fiscal policy → prevents rise in consumption and investment
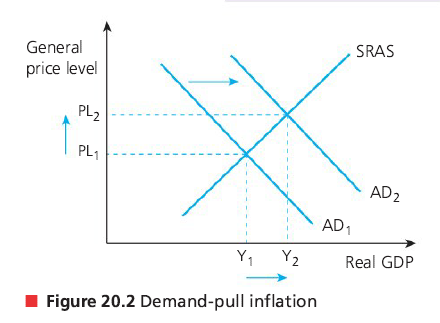
higher levels of AD
drives up general price levels
excessive aggregate demand (AD increases faster than AS)
might be due to higher GDP per capita, lower unemployment, increase in exports, lower interest rates, cuts in income tax
shown by AD1 → AD2
cost-push → rise in general price level
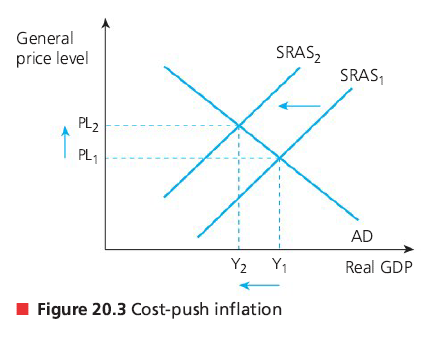
higher costs of production
shift from SRAS1 → SRAS2
increase in general price levels
reduces national output
higher production costs = raised prices
Costs of a high inflation rate
diminishes ability of money to function as a medium of exchange
uncertainty → reducing consumer and business confidence levels (lowers long run economic growth)
redistributive effects → costs are not equally distributed (ex: people with fixed income)
savings → real value of savings decrease over time (borrowers, lenders)
export competitiveness → exports become more expensive
economic growth → lowers expected real rates of return on capital investments
inefficient resource allocation → higher costs of production
shoe leather costs → customers spend more time looking for the best deals
REUSER → redistributive effects, export competitiveness, uncertainty, savings, economic growth, resource allocation
Causes of deflation
deflation → persistent fall in general price levels over time (inflation rate is negative)
either continual decline in AD or increase in SRAS
Benign deflation → positive effect as economy can produce more (rightwards shift of the SRAS curve) → boosts rational output + employment without raising general price level
deflation can be caused by lower production costs, higher productivity, or higher efficiency
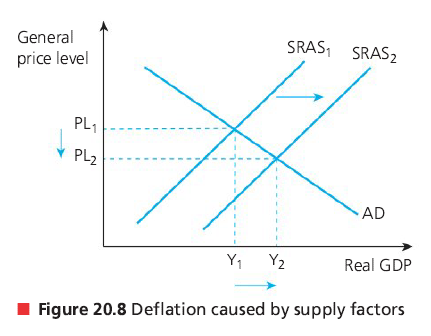
Benign deflation - SRAS1 → SRAS2
also called non-threatening deflation
greater number and variety of goods and services
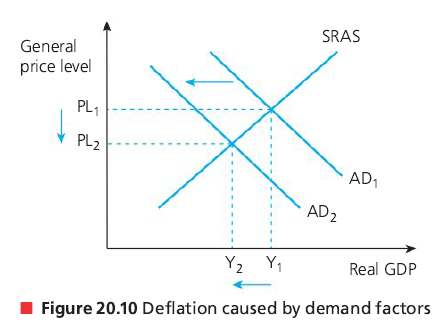
malign deflation → negative effect (leftwards shift of AD)
AD1 → AD2
associated with recessions and unemployment
harmful to the economy as there is a fall in real GDP
Disinflation
fall in the rate of inflation but prices are still rising
occurs when inflation rate is negative
leads to deflation if not controlled
shown by smaller proportional increase in average prices
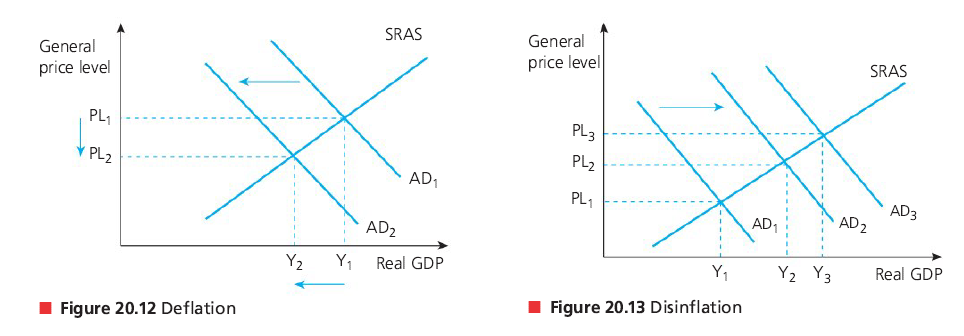
Costs of deflation (malign)
uncertainty → increase in value of debts reduces confidence levels
redistributive effects → fall in value of assets and wealth
deferred consumption → postpones consumption (deflationary spiral)
cyclical unemployment / bankruptedness → falling prices/wages = falling AD/confidence
increase in real value of debt
inefficient resource allocation
policy ineffectiveness
Sustainable level of government (national) debt
budget deficit → value of government spending exceeds its revenue (G>T) per time period
government debt = accumulated budget deficits over the years
sustainable level - debt is affordable → paid in the long term
Measurement of government debt
uses percentage of GDP (debt to GDP ratio)
different from nominal/absolute value of debt
Costs of government debt
debt servicing costs - loan repayment plus interest rates incurred in the debt
credit ratings - measure of borrower’s ability to repay a loan
future taxation / government spending - austerity measures
budget deficits are not sustainable in the long run, there must be budget surpluses (G<T) to balance it out
Potential conflict between macroeconomic objectives
low unemployment and low inflatioon
high economic growth and low inflation
high economic growth and environmental sustainability
high economic growth and equity in income distribution
Low unemployment and low inflation
more employment = inflationary pressures
low unemployment creates demand-pull inflation due to increase in AD
full employment creates cost-push inflation due to wage inflation
short run Philips curve (SRPC) shows relationship between inflation and unemployment
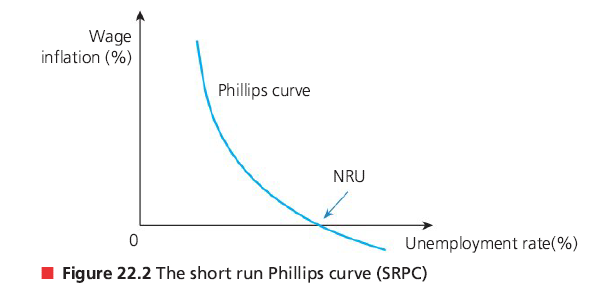
demonstrates opportunity cost, either low unemployment or low inflation
trade-off only exists in the short run
stagflation → employment / GDP falls as there is inflation
stagflation and short run Philips curve
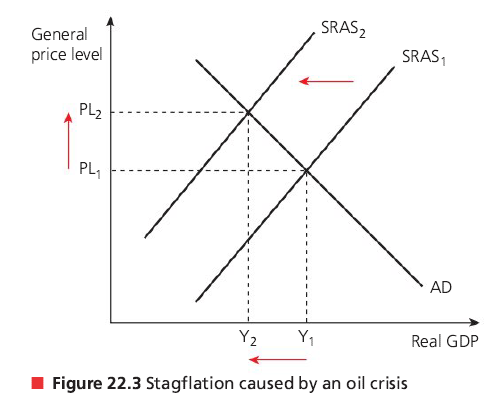
increased natural rate of unemployment
stagflation creates a worse trade-off between low unemployment and low inflation
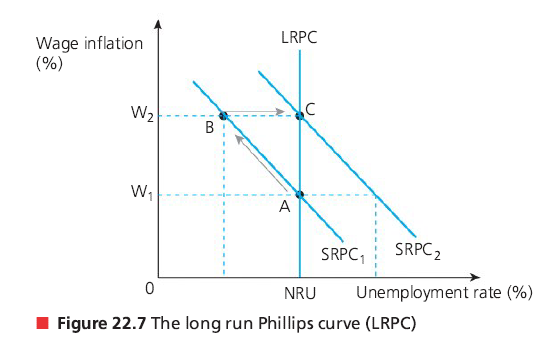
long-run Philips curve (LRPC) is vertical at the natural rate of unemployment (NRU) → no trade-off
attempts to reduce NRU will be inflationary in the long run ((A→B) will cause (B→C))
the increase in costs of production shifts SRPC reverting the unemployment rate back to NRU
High economic growth and low inflation
economic growth → increase in AD in a country
if AD rises faster than AS, there is demand-pull inflation
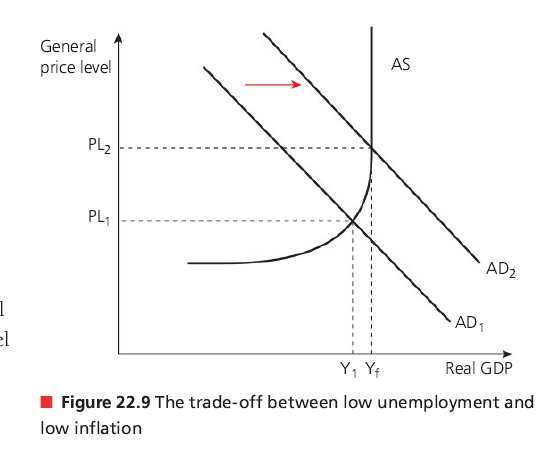
increase in price levels caused by increase in AD
graph also represents trade-off between low unemployment and low inflation
cost-push inflation can also occur due to the full employment level being reached
firms try to attract the more scarce skilled labour, leading to wage inflation
monetary policy → reduces inflation by raising interest rates or increasing economic growth by cutting interest rates
conflict in use of interest rates, therefore conflict in objectives
sustainable economic growth can exist with low/stable rate of inflation
AS increases with AD
when inflation rises too quickly, it harms consumption and investment
controlled inflation can be helpful for economic growth (increases certainty)
high economic growth leads to an inflationary gap
High economic growth and environmental sustainability
as an economy grows, increased levels of production and consumption can create negative externalities that harm the environment
increased consumption of demerit goods (ex: cigarettes)
increased carbon footprint from increased income because of economic growth
environmentally sustainable economic growth is possible
use of green technologies and renewable energy sources
High economic growth and equity in income distribution
rapid economic growth leads to greater disparities in the distribution of the wealth/income in a country
widening the gap between the rich and the poor
although everyone in the country benefits from economic growth, not everyone benefits in the same way
minimum wage builds less wealth than billionaires
economic growth increases tax revenues, allowing the government to use the revenues to re-distribute income
so long as the tax system is progressive and equitable, there is not necessarily a conflict between economic growth and distribution of wealth
Unequal distribution of income/wealth
income
imbalances of income distributions → very few members of the society enjoying a high concentration of the nation’s income
to compare nations → GDP per capita or GDP in terms of purchasing power parity
wealth
imbalances in the spread of a country’s wealth → very few members account for a disproportionately large proportion of the wealth in a society
wealth → accumulation of assets with a monetary value
Factors that influence difference in wealth
economic factors → high national debt
natural resources → increases GDP per capita
environment → reduces wealth (ex: floods, droughts, etc.)
physical factors → reduces wealth (ex: hot/dry climates)
social factors → limits ability to produce wealth (ex: education)
political factors → determines economic prosperity (ex: war)
Measuring economic inequality
income inequality → relative share of national income earned by given percentages of a population (deciles / quintiles)
uses Lorenz curve and Gini coefficient
Lorenz curve
graphical representation of income/wealth distribution in a country
shows proportion of overall income/wealth accounted by each quintile or decile
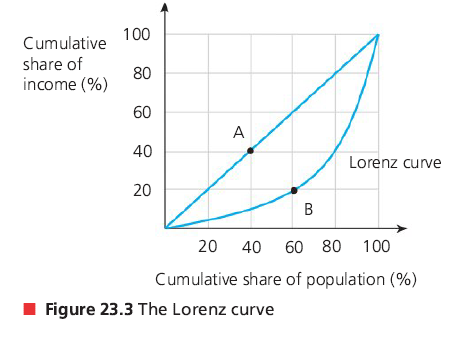
this example shows that the bottom 60% of the population holds 20% of the wealth (B)
means the top 40% holds 80% of the wealth
data is cumulative → adds up to 1/100%
Gini coefficient
measures income/wealth inequality by calculating a numerical value of the Lorenz curve
G is between 0 and 1
the higher the value, the greater inequality
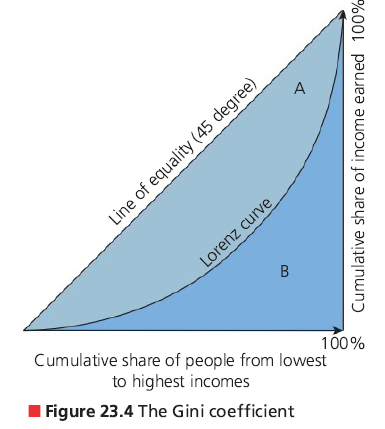
A = shaded area, B = area under Lorenz curve
Gini coefficient = A/(A+B)
line of equality has a 45° angle
Poverty
condition of an individual, household, or community/country being extremely poor
not having money to meet basic human needs
food, clothing, shelter, healthcare, education
absolute poverty → unable to afford basic needs for survival
relative poverty → income/consumption level below social norm within a country
differs from country to country
Measuring poverty
international poverty lines (poverty threshold) → minimum level of income to afford basic needs for human survival (below $1.90 a day)
does not take into account access to sanitation/water/electricity
a more accurate measure would be a national poverty line
line value depends on the country (higher national income = higher poverty line)
multidimensional poverty index (MPI)
uses health, education, and standards of living
considers multiple factors that reduce quality of life
ex: sanitation, child mortality rate, average years of school
Minimum Income Standards (MIS)
lowest amount of income needed for an acceptable standard of living
varies by a country’s people’s standards and economic state
helps people live in a socially acceptable way
in the UK, MIS is used for:
calculating the living wage (minimum wage)
quantitative benchmark for NGO/charities to determine who is in need
calculating costs of bearing/raising a child
helps governments determine level of social security and transfer payments
Difficulties in measuring poverty
how would the national poverty line of very poor countries translate to the IPL?
relative poverty is highly subjective
a permanently low income creates a poverty trap
PPP highly differs with location
Causes of economic inequality and poverty
inequality of opportunity
different levels of resource ownership
different levels of human capital
discrimination (gender, race, etc.)
unequal status and power
government tax and benefit policies
globalization and technological change
market-based supply-side policies
Impact of high income/wealth inequality
brings possibility of higher income for those who work hard which creates incentives for people to work harder → improving labour effort
prospect of earning higher incomes encourages people to invest in education and skill development → imporves labour productivity
entrepreneurial instincts are encouraged as a result of potential to earn higher profits
greater incentives and wealth creation can lead to a higher savings ratio
can be used to fund investments which creates an increase in the economy’s long-term growth and development
creates more social tensions in the form of demonstrations, protests, political unrest, and crime which leads to less investment and labour participation rates
more government spending on transfer payments to sustain the economy
adds to government debt, not directly to the national income
discourages workers from joining labour foce and entrepreneurs from investing
increases voluntary unemployment
affects standard of living
affects social stability
Taxation
progressive tax → higher incomes = higher percentage of tax paid
tax threshold → workers earn a certain amount of income per year before they can be taxed
proportional taxes → percentage of tax paid stays the same irrespective of taxpayer’s income
also called flat rate taxes
regressive taxes → those with a higher ability to pay are charged a lower rate of tax
used to combat inequality in wealth and income
Monetary policy
control and use of interest rates and money supply to influence level of AD and economic activity
overseen by the central bank or designated money authority
interest rates → price of money
Functions of a central bank
executor of monetary policy
government’s bank
banker’s bank
sole issue of legal tender (bank notes or coins)
lender of last resort
credit control
Goals of monetary policy
low and stable rate of inflation (inflation targeting)
inflation target rate → transparent goal to help control inflation
low unemployment
lower interest rates = economic activity increases = increase in AD
reduces borrowing costs so consumer confidence increases
reduce business cycle fluctuations
lower interest rates in a downturn and higher interest rates in booms
promote a stable economic environment for long-term growth
greater degree of certainty and confidence
external balance (imports = exports)
influence the exchange rate
lower interest rates = reducing exchange rate
Money creation
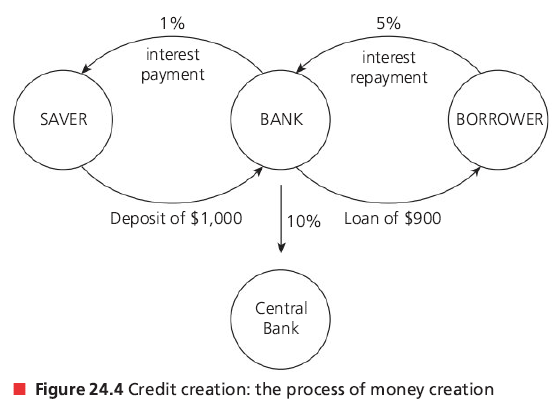
credit creation → banks create money from deposits of savers and borrowers
minimum reserve ratio → limit on amount commercial banks can lend
to limit growth in money supply
money multiplier = 1/reserve ratio (how much deposit increases money supply)
if the central bank wants to limit economic activity and suppress inflationary pressures, the minimum reserve ratio is increased to limit growth in money supply
Tools of monetary policy
Open Market Operations (OMO)
buying/selling of government securities by a country’s central bank
government securities - type of public sector debt to finance government
sale of bonds with promise to repay borrowed money with fixed rate of interest
government securities sold when money supply needs to fall
increased interest (return) rate attracts buyers/investors
contractionary monetary policy → withdraws money from economy
opposite is true (not sold but purchased by central banks)
Minimum Reserve Requirements (MRR)
commerical banks generally want to lend more to profit more, but the central banks require them to keep a certain percentage of their deposits at the central bank
called the minimum reserve ratio or minimum reserve requirement (MRR)
ensures the commercial banks have enough cash for their daily transactions
bank run → most customers withdraw all their cash deposits on any given day
raising MRR limits growth → 1/MRR = money multiplier
Changes in central bank Minimum Lending Rate (MLR)
official rate of interest charged by central bank or loans to commercial banks
also known as base rate, discount rate, and refinancing rate
influences interest rates from commerical banks for lending
if MLR increases, the lending rates increase too → contractionary
Quantitative Easing (QE)
central banks purchase corporate bonds to directly inject money into the economy
the institutions have “new” money and see an increase in liquidity
boosts money supply and promotes lending (increase in AD)
central bank creates money
central bank buys bonds from financial institutions
interest rates reduced
businesses/people borrow more money
businesses/people spend more and create jobs
boosts the eocnomy
Demand and Supply of money
interest rate → return for lenders or price for borrowing (price of money)
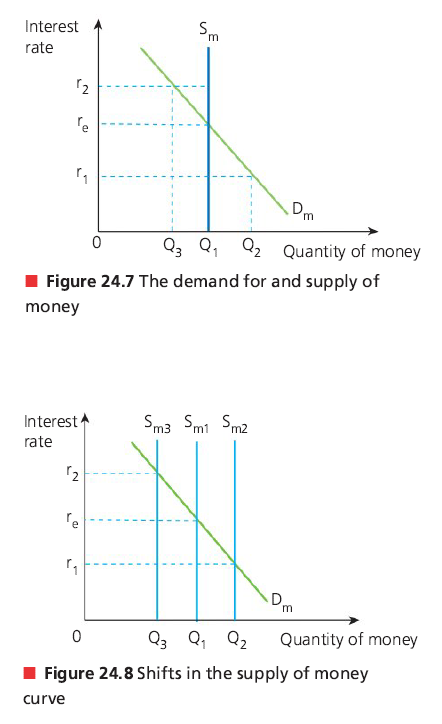
Dm → desire to hold money rather than saving it
Sm → total amount of money in the economy
supply is vertical because supply of money is fixed at any given time by central banks
opportunity cost of holding money varies directly with interest rate → fall in interest rates = reduction in opportunity cost of holding money
central banks consider these when deciding supply of money:
state of economy (ex: deflationary gap = reduction in interest rates)
rate of growth of nominal wages (ex: higher labour cost = higher prices = inflation)
business confidence levels (lower interest rates = more incentive for investment)
house prices (most valuable asset)
exchange rate
Real VS Nominal interest rates
interest rate → price of money (cost of credit or return on savings)
nominal interest rate → actual rate agreed on between bank and customer
real interest rate → accounts for inflation
real IR = nominal IR - inflation rate
IR = interest rate
Expansionary monetary policy (loose/easy)
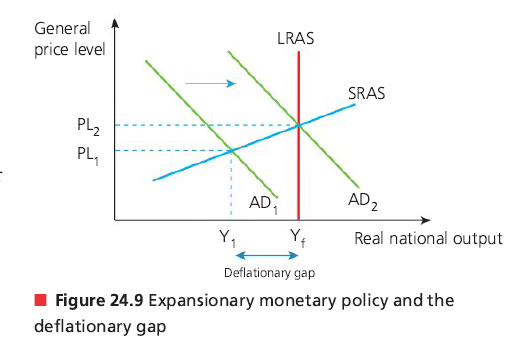
lower interest rates → shifts AD rightwards to close a deflationary gap
AD = C+I+G+(X-M)
C, I, G rise due to cheaper borrowing cost
(X-M) rise due to fall in exchange rate
Contractionary monetary policy (tight)
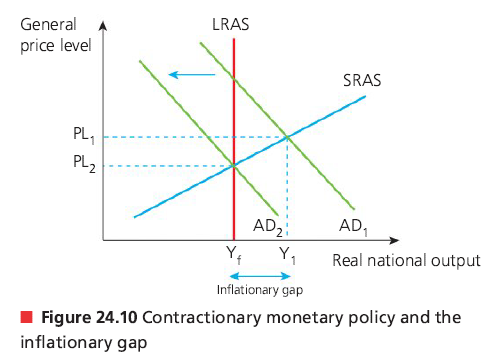
closes an inflationary gap by increasing interest rates
opposite of expansionary
Effectiveness of monetary policy
limited scope of reducing interest rates when close to zero
low consumer and business confidence
incremental + flexible + easily revertible
short time lags
Fiscal policy
use of taxation and government expenditure strategies to influence level of economic activity
to achieve low unemployment, sustainable economic growth, and low inflation
promotes long-term economic growth and low unemployment through:
government spending on physical capital goods (ex: machinery, buildings, vehicles)
government spending on human capital formation (ex: education, training)
provision of incentives for firms to invest (ex: tax breaks, tax incentives)
Sources of government revenue
taxation → direct and indirect
sale of goods/services from state-owned enterprises
privitization proceeds from sale of government assets
Taxation
government levy on income or expenditure
direct → imposed on income, wealth, or pfoits of individuals/firms
ex: on wages/salaries, inheritance, and company profits
indirect → expenditure taxes on spending of goods/serivces in economy
ex: GST/VAT
Sale of goods and services from state-owned enterprises
state-owned enterprises/nationalized industries → postal, airports, broadcasting
government odes not aim to earn profits so revenue sources go toward paying the costs of providing the good or service
Sale of government assets
selling government-owned assets/enterprises to shareholders in the private sector
hence the alternate name privitization
short-lived policy → limited amount of assets to be sold
Government expenditures
current → spending on goods and services consumed within the current year
also called consumption expenditure
for immediate operations and benefits
ex: wages/salaries, healthcare/education, subsidies, interest repayments
capital → long-term items of spending (public sector investments) that boosts economy’s productivity
spending large amount of money to increase nation’s capital stock
also called fixed capital formation
intended to create future benefits for all members of society
ex: physical infrastructure: roads, tunnels, harbours, airports, schools, hospitals
ideally, the government would borrow money only to fund capital expenditure
fund investment expenditure in the economy
transfer payments → welfare expenses from government to redistribute income
done through funding essential public services
ex: state education, housing, healthcare, social housing, postal services
no corresponding exchange of goods and services (unlike current/capital)
ex: unemployment benefits, state pensions, housing benefits, disability allowances
Goals of fiscal policy
low and stable rate of inflation
using taxation policies to promote price stability
ex: higher tax rates + running a budget surplus = reduction in C+I+G
low unemployment
prevents cyclical unemployment during recessions
reduction in tax rates and/or increasing government expenditure (G)
promote a stable economic environment for long-term growth
promotes long-term economic growth by enabling low taxation
reduce business cycle fluctuations
to reduce impacts of a recession, a budget deficit can be run (expenditure > revenue)
opposite is true with a budget surplus and higher tax rates for a boom
equitable income distribution
done by using high marginal tax rates in a progressive tax system
also can use transfer payments
external balance
X=M
ex: indirect taxers imposed on imports and/or government subsidies for domestic exporters will generally increase external balance: (X-M) → positive, increases GDP
opposite is true creating less external balance
Expansionary/reflationary fiscal policy
used to stimulate economy during a recession
by increasing government expenditure and/or lowering taxes
boosts consumption and investment → rightward shift in AD
Keynesian → no LRAS, believes government intervention is effective and needed
Monetarist → LRAS shows no change in real GDP but increase in price levels (vertical)
Contractionary fiscal policy
reduces economic activity by decreasing government spending and/or raising taxes
limits consumption (C) and investment (I)
used to reduce inflationary pressures during a boom → closes inflationary gap
Keynesian multiplier
shows any increase in value of injections results in proportionally larger increase in AD
any increase in any of the injections will increase value of the Keynesian multiplier
injections → stimulates further rounds of spending (spending → income for another person)
ex: government spends money on social housing, leads to many other industries benefitting
the initial money generates a far greater value of final output
leakages → reduce value of Keynesian multiplier: takes money out of the economy
negative multiplier effect → initial leakage leads to greater than proportionate fall in GDP
determinants of Keynesian multiplier: MPC, MPM, MPS, MPT
marginal propensity to consume (MPC) → proportion of increase in household income that is spent on goods and services rather than saved (MPC = ∆C + ∆Y)
marginal propensity to import (MPM) → proportion of increase in household income that is spent on imports rather than on domestically produced goods/services (MPM = ∆M + ∆Y)
marginal propensity to save (MPS) → proportion of increase in household income saved rather than spent on consumption or imports (MPS = ∆S + ∆Y)
marginal propensity to tax (MPT) → proportion of each extra dollar of income earned that is taxed by the government (MPT = ∆T + ∆Y)
Keynesian multiplier = 1/(1-MPC)
Keynesian multiplier = 1/(MPS+MPT+MPM)
MPC + MPS + MPT + MPM = 1
Effectiveness of fiscal policy
constriants on fiscal policy
political pressures
time lags
sustainable debt
crowding out
when increased government borrowing increases interest rates and creates a reduction in the private sector investment expenditure
G increases but I decreases
strengths of fiscal policy
targeting of specific economic sectors
government spending effective in deep recession
automatic stabilizers
progressive taxes and unemployment benefits
Supply-side policies
