Statistical Analysis Notes
Sensitivity/Recall (True Positive Rate)
Definition: The proportion of actual positives that are correctly identified by the model.
Formula: Sensitivity = (True Positives) / (True Positives + False Negatives)
Range: 0-1 true positives identified
Specificity (True Negative Rate)
Definition: The proportion of actual negatives that are correctly identified by the model.
Formula: Specificity = (True Negatives) / (True Negatives / False Positives)
Range: 0-1 true negatives identified
Accuracy
Definition: The proportion of true results (both true positives and true negatives) among the total number of cases examined.
Formula: Accuracy = (True Positives + True Negatives) / (Total Population)
Range: 0-1 correct predictions made
Precision
Definition: The proportion of positive identifications that were actually correct.
Formula: Precision = (True Positives) / (True Positives + False Positives)
Range: 0-1 true positive predictions
F-1 Score
Definition: The F1 Score is the harmonic mean of precision and recall, providing a balance between the two.
Formula: F-1 = (2 Precision * Recall) / (Precision + Recall)
Range: 0-1 effective positive identification
AUROC (Area Under the Receiver Operating Curve)
Definition: AUROC measures the ability of a model to distinguish between classes. It plots the true positive rate (sensitivity) against the false positive rate at various threshold settings.
Range: 0 to 1; a value of 0.5 indicates no discrimination (random guessing), while a value of 1 indicates perfect discrimination.
Interpretation of AUROC Values
0.5: No discrimination (random guessing).
0.7 - 0.8: Acceptable discrimination.
0.8 - 0.9: Excellent discrimination.
> 0.9: Outstanding discrimination.
SSIM (Structural Similarity Index Measure)
Definition: SSIM is used to measure the similarity between two images. It considers changes in structural information, luminance, and contrast.
Range: -1 to 1; a value closer to 1 indicates higher similarity.
Formula:

Where:
x and y are the two images being compared.
μx and μy are the mean intensities of images x and y.
σ2x and σ2y are the variances of the images x and y.
σxy is the covariance between x and y.
C1 and C2 are small constants added to avoid instability when the denominators are close to zero. Typically, C1 =(K1L)2 and C2 = (K2L)2 where:
L is the dynamic range of the pixel values (e.g., 255 for 8-bit images).
K1 and K2 are small constants, often set to 0.01 and 0.03 respectively.
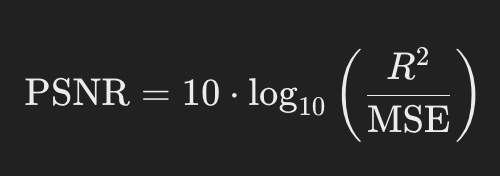
PSNR (Peak Signal-to-Noise Ratio)
Definition: PSNR is a measure of the peak error between two images. It is often used in image compression and processing.
Theoretical Range: PSNR values typically range from 0 to ∞ (infinity).
dB = Decibals, above 30 dB are high quality
0 dB: Indicates that the reconstructed image is completely different from the original (maximum distortion).
Higher Values: As the PSNR value increases, the quality of the reconstructed image improves.
Formula:

where R is the maximum possible pixel value and MSE is the Mean Squared Error between the two images.
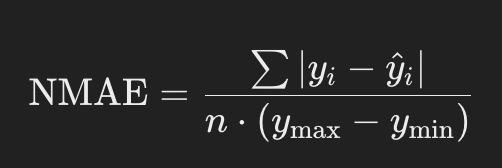
NMAE (Normalized Mean Absolute Error)
Definition: NMAE measures the average magnitude of errors in a set of predictions, normalized by the range of the actual values.
Theoretical Range: The NMAE can theoretically range from 0 to ∞.
0: Indicates a perfect prediction where the predicted values match the actual values exactly (no error).
∞: Indicates increasingly poor predictions as the error increases.
Formula:

where yi are actual values and y^i are predicted values.
FID, IE